
Re-inventing the Daily Commute: Exploring Space Usage And Interior Design Requirements to Support Non-Driving Related Tasks in Autonomous Vehicles
Diane Gyi 1,*, Christopher Wilson 1, Andrew Morris 1, and Robert Bateman 2
1 School of Design and Creative Arts, Loughborough University, Loughborough, UK
2 Nissan Technical Center Europe, Cranfield, UK
Autonomous vehicles (AVs) potentially change the journey experience, allowing occupants to partake in non-driving-related tasks (NDRTs) such as using electronic devices. To support human-centered design, it is important to understand the types of NDRTs and consider ergonomic interior vehicle layouts to optimize carrying out such activities. An exploratory study was conducted using a vehicle buck: data on seat position, discomfort, posture, and observations of both space use and NDRTs were collected. Participants (n = 16) took part in three simulated commutes with different car interior scenarios, allowing for various levels of space availability and design features (e.g., laptop table, armrest). Using laptops, phones, and tablets was the most frequent activity, followed by reading and sleeping. Overall discomfort levels were low for all scenarios. Still, head/neck, upper back, and lower back discomfort were lower in the co-designed scenario where participants had both flexibility of space usage and additional design features. A high frequency of neck flexion was observed but was lower in the co-designed scenario for postures held over ten minutes; this was partly mitigated by the design features. This research explores the in-vehicle space usage of occupants in AVs to guide and evidence future design decisions for supporting NDRTs.
Keywords – Autonomous Vehicles, Driving Simulator, Ergonomics, Human-Centered Design, Vehicle Interiors.
Relevance to Design Practice – To understand occupant needs and requirements for Autonomous Vehicles, it is important to investigate the potential user experience. This people-centered research imagines the opportunities with AV design and different usage of vehicle space (within expected vehicle space constraints). This will help to inform future design decisions.
Citation: Gyi, D., Wilson, C., Morris, A. & Bateman, R. (2025). Re-inventing the daily commute: Exploring space usage and interior design requirements to support non-driving related tasks in autonomous vehicles. International Journal of Design, 19(2), 29-42. https://doi.org/10.57698/v19i2.03
Received May 13, 2024; Accepted March 10, 2025; Published August 31, 2025.
Copyright: © 2025 Gyi, Wilson, Morris, & Bateman. Copyright for this article is retained by the authors, with first publication rights granted to the International Journal of Design. All journal content is open-accessed and allowed to be shared and adapted in accordance with the Creative Commons Attribution 4.0 International (CC BY 4.0) License.
*Corresponding Author: d.e.gyi@lboro.ac.uk
Diane Gyi is a professor of Applied Ergonomics and Design at Loughborough University. She has led several vehicle-related design ergonomics research projects working with industry partners in the UK, Japan, and Europe. Her healthcare background and knowledge of theory and practice have enabled her to champion design ergonomics and healthy design to achieve inclusive (and effective) design solutions. She has published widely, and her research covers topics such as inclusive/accessible transport design, autonomous vehicle interiors, anthropometric (body size) diversity, and healthy aging at work. Diane is part of the Transport Safety Research Center, which, together, specializes in human factors/ergonomics, engineering, psychology, and industrial design. She is also a Fellow of the Chartered Institute of Ergonomics and Human Factors (CIEHF).
Christopher Wilson earned his Ph.D. in Ergonomics and Human Factors from Loughborough University. His doctoral research concentrated on the occupant experience during highly automated driving, encompassing non-driving-related tasks, comfort evaluation, and participatory design methodologies. Currently, Chris is employed at Jaguar Land Rover as a User Research Specialist in Assisted and Automated Driving. In this role, he leads comprehensive evaluations of digital and physical Human-Machine Interface (HMI) experiences, guiding projects from conceptualization through to production.
Andrew Morris is a professor of Human Factors in Transport Safety and is the director of the Transport Safety Research Center at Loughborough University, UK. He holds qualifications in Mechanical Engineering and Ergonomics and Human Factors. Andrew was awarded the US Government Special Award of Appreciation in recognition of outstanding leadership and special contributions in the field of motor vehicle safety (June 2009). Andrew has over 35 years of experience in research into transport safety, vehicle safety, crash investigation, crash injury, and driver behavior research and has published over 300 refereed technical publications, reports, and conference papers on transport safety, crash research, injury prevention, and driver behavior.
Robert Bateman has been a manager for the Research and Advanced Engineering team at Nissan’s European Technical Center for nearly 30 years and leads a UK team to develop Nissan’s Global Research themes in Europe. Projects include the development of the Infiniti Emerg-e high-performance demonstrator vehicle in collaboration with Lotus and JLR as part of an Innovate UK-funded program between 2010 and 2012. He has also delivered other green powertrain programs, working with SMEs and universities on ergonomics activities and looking to ensure safe and comfortable experiences for Nissan customers. Robert has managed several projects co-funded by Innovate UK and CCAV to deliver Nissan’s aims to ensure the autonomous vehicle experience is a human-friendly drive while on motorways, rural, and urban roads whilst maintaining the maximum level of safety to both passengers and other road users.
Introduction
Autonomous vehicles (AVs) offer the opportunity to free up the driver to take part in non-driving activities, optimizing the use of time and requiring designers to rethink the driving experience. Several studies have identified potential future Non-Driving Related Tasks (NDRTs) that could take place within the vehicle during a journey. For example, Large et al. (2017) found participants engaged in demanding cognitive tasks such as using their phone or laptop, although it was noted that the space available to participants was restricted by the use of a current production car in the simulator. Earlier studies, such as Schoettle and Sivak, (2014) found through a survey that watching the road was the most preferred activity (41% of participants), compared with activities such as reading (8.3%) or working (5.3%). Kyriakidis et al. (2015) and Bansal et al. (2016) also found that passive tasks were rated more highly among their participants whereas Wadud and Huda, (2019) found clear differences in activities when the journey type was considered (e.g., commute, business, or leisure) and also differences between inbound and outbound journeys. However, these studies were limited through methodological decisions (underdefined survey questions) or physical constraints through the use of a simulated environment using current production vehicles.
Previous research has investigated additional features such as work surfaces or a seat that allows for out-of-driving position seating arrangements. Salter et al. (2019) investigated the effects of rearward and inward-facing seats on motion sickness. They found that rearward-facing seats increased symptoms of motion sickness but found no significant effects of motion sickness for seats angled inwards up to 10°. Fiorillo et al. (2019) also found rotating seats inwards (evaluated at 11.25°, 45°, and 60°) toward another passenger created better conversations and more comfort, which would be desirable in an AV. It is also important to ensure participants can carry out NDRTs comfortably to reduce the risk of long-term musculoskeletal symptoms (Genaidy & Karwowski, 1993; Smulders et al., 2019)
Interior space is dictated by several factors including vehicle architecture (powertrain location, floor shape), interior safety technology (airbags, rollover protection) as well as the overall vehicle dimensions. It could be expected that future privately owned AVs will be restricted in size to conform to regional legislation, regulations and local customs, city architecture, and road planning. For example, vehicle sizes in North America are larger than typical passenger vehicles driven in Europe. The European Commission limits passenger vehicle width to 2550mm (Council Directive 96/53/EC, 1996) however, most privately owned vehicles will be narrower due to personal preference, road widths, and parking bay sizes. For reference, a 2022 Range Rover has a maximum width of 2209mm, and a 2022 Ford Fiesta has a maximum width of 1941mm (Range Rover Models, n.d.; Parkers, 2021). This overall width restriction in passenger vehicles could significantly influence the NDRTs that can be carried out, and how occupants use the space provided.
To ensure that the design of the vehicle interior provided the necessary space, support, and adaptability to accommodate a broad range of NDRTs in future vehicles, a human-centered design (HCD) approach was taken for this research. One of the main principles of this approach is that end users are involved in the design process and understanding is gained by asking and observing people. Human-centered knowledge and practices have evolved to be a core quality of design and provide opportunities to drive innovation (van der Bijl-Brouwer & Dorst, 2017). As indicated by Giacomin (2015), HCD is distinct from traditional design practices as the focus is on user (the driver) of the product (the car) rather than the creative processes of the designer or the materials/technology, in this case the seat, lap-table, armrest, head/neck support, etc.
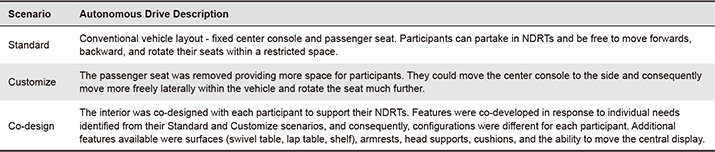
Research was conducted to explore opportunities and different usage of vehicle space in AVs (within expected vehicle space constraints) to inform and evidence future design decisions. The scenario of a regular commute was used in a simulator study involving 16 participants (8 males, 8 females) whom each took part in three simulated 45-minute driving commutes. Each participant experienced three different driving scenarios, which allowed for various levels of space usage and access to new design features such as armrests, a laptop surface, and a headrest (Table 1). The study explored (1) what NDRTs were carried out on the driving commute, (2) what the space requirements for these NDRTs, (3) what additional design features are needed to support carrying out these tasks, and (4) what is the impact of these on reported discomfort. These can provide Original Engineering Manufacturers (OEMs), designers, researchers, and legislators with evidence to make informed decisions about future autonomous vehicle use. In a survey by Wilson et al. (2022), it was found that participants who were more likely to own an Autonomous Vehicle in the future would carry out productive activities such as using a mobile device or working on a laptop, as well as leisure activities such as reading and sightseeing. In this survey, it was also found that the commuting journey involved the most diverse range of NDRTs (working, exercising, sleeping, and applying makeup), therefore, it was decided that this would be the context for the research. This research is also part of a larger project examining the AV journey experience, comfort, and well-being.
Table 1. Scenario descriptions.
Method
Study Design
A bespoke full-size vehicle buck (Figure 1) was built, which was a physical representation of the interior and the dimensions representative of a typical C-segment SUV for interior width, step-over height, roof height, and floor height. This was placed inside a three-screen driver simulator (running SCANeR Studio software version 1.9), and together with the buck, they enabled a simulation of possible future AV scenarios. The seat was positioned at a representative H-point height and the steering wheel, pedals, pillars, forward vision, and instrument panels (IP) were all estimated in terms of size and position. The length of the interior was 2480mm (measured from the front of the IP to the rear vertical panel), which allowed the participants to use the full interior floor space of a car. The interior width of the vehicle buck was 1444mm. These dimensions were chosen as they represented a realistic and feasible vehicle interior package without restricting movement and space utilization. To allow the participants to fully utilize the interior space, the seat base was designed with four ball transfer units in each corner, which allowed the seat to move freely in all four directions. On top of the seat base, a car seat was fitted with an integrated seat belt mount—drivers wore a seat belt for all scenarios. The simulator itself provided surround sound of road noise and passing vehicles and no external light sources were visible in the vehicle buck to increase immersion (apart from a rear light strip to aid seat tracking). Two GoPro cameras were placed inside the vehicle buck: a front-facing camera, positioned on the IP next to the passenger A-pillar, captured the participants’ activities; the second camera positioned at the rear in the center of the vehicle buck tracked the participants’ positions.
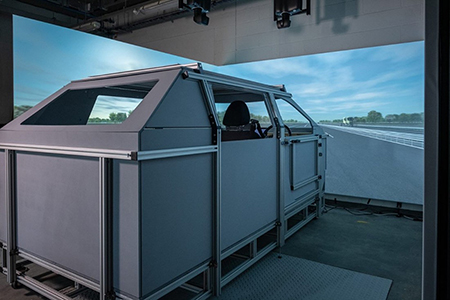
Figure 1. The vehicle buck and the simulator running SCANeR Studio.
Participants took part in three simulated journeys (commutes) with the same autonomous drive but with different vehicle interior scenarios. The first drive was designated as Standard, the second as Customize, and the third as the Co-design scenario (Table 1 and Figure 2). Each participant experienced all three scenarios in the same order, approximately 1 week between each. The rationale was that the interior design for each scenario evolved for each participant, both with experience of autonomous driving and in terms of supporting their individual NDRT needs. Therefore, features for the Co-design scenario were co-developed in response to individual needs identified from the Standard and Customize scenarios. Experience of automated driving (albeit a simulation) also improved confidence in understanding the types of NDRTs selected.
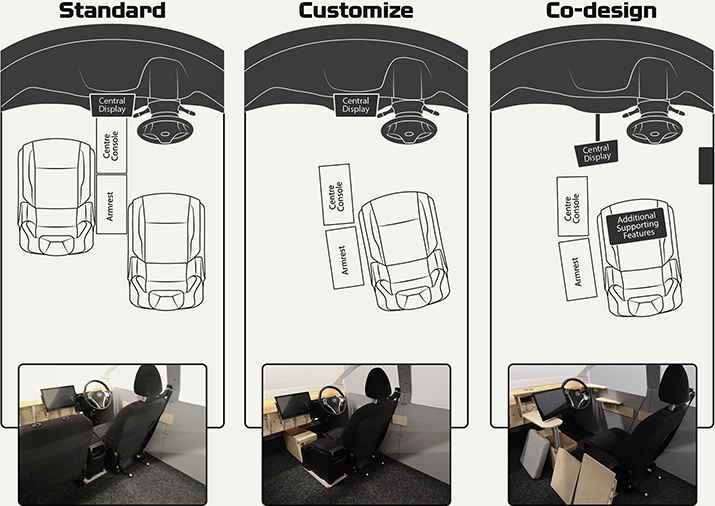
Figure 2. Illustrations and photographs to show the three driving scenarios.
For each scenario, the vehicle remained at a steady speed of 105km/h on a two-lane dual carriageway with no entries or exits. Participants were informed that the vehicle would drive them autonomously and that they would overtake other vehicles as well as be overtaken by them. Each of the three commutes was identical in length, and the journey simulated SAE level 4 autonomous driving (SAE International, 2021). Prior to the study, participants were told that they would be taking part in a simulated commute and to bring any items they believed they would use on such a journey. They were asked to start each journey in their usual driving position (with their seat belt buckled), and then a visual and audio cue indicated that the autonomous driving mode had begun and that they were free to detach from the task of driving for 45 minutes while the vehicle was in autonomous mode; the seat belt remained buckled for the entire commute. At the end of the 45-minute commute, participants were asked to resume their driving position.
Study Protocol
Several data types were captured during this study: position data, measured with a Cartesian coordinate system; NDRT observations (primary and secondary activities); and posture and discomfort data. The methods of measurement are detailed below.
Position Data
Position data was captured by tracking two fixed points on the car seat using the rear camera (GoPro Hero 7). The video footage was processed using Kinovea v0.8.27 (Charmant, 2019; Puig-Diví et al., 2019) and tracked the position of the two points on a calibrated plane, which was dimensionally and positionally defined in the software (using the four calibration markers in Figure 3), as well as correcting for lens distortion. These two sets of coordinates were then used to calculate a third reference point, which is in line (vertically) with the H-point location for the production seat, using basic trigonometry and calculated in Microsoft Excel. From this method, both coordinate data and the angle of rotation can be captured.
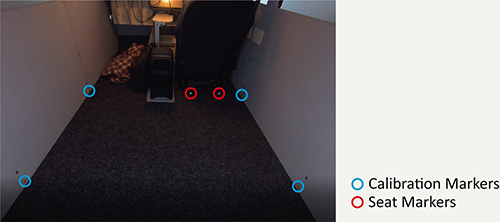
Figure 3. Calibration marker and seat tracking locations.
Primary and Secondary Activities
The duration time (seconds) of primary and secondary activities (NDRTs) were measured using the front camera video by noting down every time the task/activity changed with a timestamp. Primary activities are the main tasks that were judged by the researcher to involve sustained attention and effort, such as working on a laptop or reading. Secondary activities are brief, intermittent actions that occur alongside the primary task, like quickly checking a phone, adjusting clothing, removing shoes or taking a sip of a drink. Multiple secondary activities can happen during a single primary activity.
Discomfort, Wellbeing and Posture
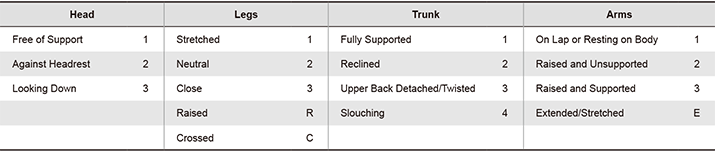
The discomfort was measured at 2 time points during each simulator session using the Body Part Discomfort Scale (Corlett & Bishop, 1976), which involves a 6-point Likert scale ranging from ‘Not Uncomfortable’ to ‘Extremely Uncomfortable.’ This was administered remotely, with participants verbally giving their ratings during the trial. The well-being questionnaire used was adapted from Ahmadpour, Robert, and Lindgaard (2016), which asks a range of questions relating to the feeling of stiffness, freedom to move, and numbness and is rated using a 5-point Likert scale between ‘Strongly Agree’ and ‘Strongly Disagree.’ The posture assessment was carried out using an adapted method from Kamp et al. (2011) where postures were observed and matched to a posture reference (Table 2). Posture was monitored using the front and rear video camera footage, and a new posture was recorded when the participant held a new posture for greater than 30 seconds.
Table 2. Posture assessment reference codes.
Anthropometry
Five key anthropometric measurements were taken to ensure a wide range of anthropometry - stature, sitting height, buttock-heel length, forward grip reach, and bi-deltoid shoulder breadth (Pheasant & Haslegrave, 2018). These were selected as they could be measured utilizing social distancing or by the participants themselves using a sitting height table and stadiometer (due to COVID-19 restrictions).
Simulation Autonomous Drive
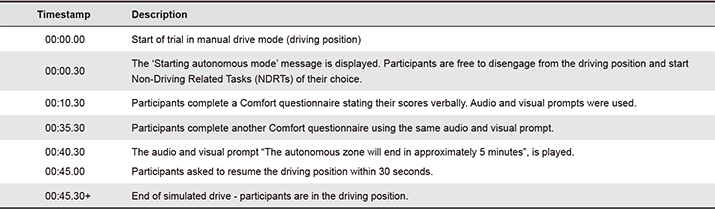
All three scenarios involved an identical simulated commuter car journey with the weather (light fog), time of day (early morning), traffic, and road conditions held consistent. A central display in the vehicle buck was used to show a journey progress bar’ as well as visual prompts (in time with the audio prompts) to start and end the autonomous drive mode. The central display was moved to the front passenger A pillar (located within the windscreen area) for the Co-design scenario, as it was possible for participants to use it by connecting their laptops and using it as a secondary display. The timeline for each condition is shown in Table 3.
Table 3. Simulated commuter car journey timeline.
Sampling Strategy
A purposive sampling technique was used to select participants with the aim of achieving a broad range of anthropometry and gender balance. They were also screened for motion sickness as this was a simulator-based study. They were required to hold a valid driver’s license and be familiar with driving a car. Participants under the age of 18 and over the age of 50 were excluded (the latter due to COVID-19 restrictions). The study was approved by the Loughborough University Ethics Committee and conformed to GDPR.
Data Analysis
Two main sources of data collection were used for this study. The front camera captured participants’ activities and postures, and the rear camera captured the participants’ movement by tracking two fixed points on the seat. The two databases were combined so that spatial data could be analyzed with added variables such as the activity performed, items used, and features used.
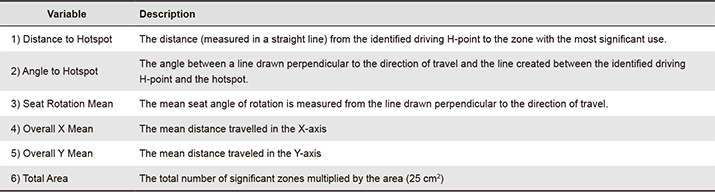
To analyze the spatial data, the Getis-Ord Gi* statistic was used for each zone in the tracked area (Bivand & Wong, 2018), which calculates a Z score and P value for each. Generally, the Gi* statistic can be described as a ratio of the total of the values in a specified area to the global total. The tracked area, in this instance, the floor of the vehicle buck, was divided into different zones (for this study, 50mm x 50mm squares), and a statistical calculation was used to determine if there were significantly more data points in one zone compared to neighboring zones. This generated a hotspot grid that could be further analyzed, creating new variables (see Table 4).
Table 4. Description of hotspot grid variables.
The analysis was carried out in R studio (http://www.rstudio.com/) with several additional packages used to plot and present the data (Bivand & Wong, 2018; Wickham, 2016; Wickham et al., 2019). JASP (ver. 0.16.1, https://jasp-stats.org/download/) was used to analyze the comfort data and Wilcoxon signed rank tests were used to compare different body areas between conditions. Posture data were analyzed in Microsoft Excel to determine the frequency of held postures.
Results
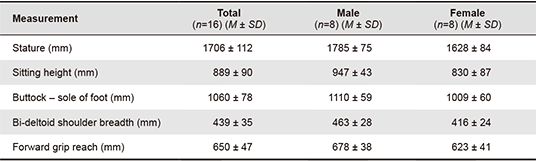
In total 16 participants (8 females, 8 males) took part in all three scenarios (48 simulated drives). There was a diverse range of ages (male M = 34.0, SD = 11.2; female M = 29.6, SD = 3.6), and anthropometric measurements (Table 5) in the sample. Eight participants were in full-time employment, six were doctoral researchers, and two were undergraduate students.
Table 5. Anthropometric measurements of participants (n=16).
Primary and Secondary Activities
Twenty-two primary activities were identified, and time spent on activities recorded for more than one minute are shown in Figure 4 for each scenario. Similar activities were grouped together; for example, ‘sightseeing,’ ‘looking out of the window,’ and ‘looking around the cabin’ were grouped as ‘observing.’ In addition, ‘packing,’ ‘unpacking,’ ‘moving around the cabin,’ and ‘moving features’ were grouped under the primary task of ‘rearranging.’ Using a device was the most prevalent activity, with most of the participants spending time either using a phone, tablet, or laptop (both for work and non-work). Activities recorded for less than a minute were ‘eating,’ ‘drinking,’ ‘using a smartwatch,’ ‘making a phone call,’ ‘checking their phone,’ ‘stretching,’ and ‘playing with the steering wheel.’
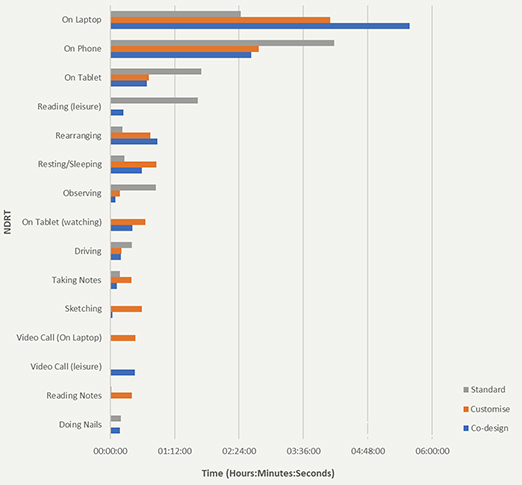
Figure 4. Time spent on NDRTs for each scenario.
Decisions about which activities to carry out evolved with the experience of autonomous driving. For example, laptop use was for 20% of the time in the Standard scenario and up to 46% in the Co-design scenario, whereas the opposite trend occurred with mobile phone use (34% in the Standard compared to 22% in the Co-design scenario). Some participants commented that they had underestimated how long they could keep themselves entertained with only a mobile phone and took the opportunity to partake in more engaging and interesting activities in the Co-design scenario. This differs from the literature (e.g., Bansal et al., 2016; Kyriakidis et al., 2015), which suggests passive tasks (such as listening to music) would be more frequent in Autonomous Vehicles.
Secondary activities shared a timestamp with the primary ones, and this was used to calculate secondary activity duration. For example, if a participant was using a laptop as a primary activity, and during that activity, they observed their surroundings frequently (every two minutes), then the entire duration of the primary activity was used to calculate the proportion of time on the secondary activity. Of the secondary activities, ‘observing’, either the cabin or the simulated environment, was the most frequent activity (47% of primary activity), followed by ‘drinking’ (19%) and ‘on phone’ (14%). Other secondary activities included adjusting their seat, taking their shoes on or off, and being on a video call. The majority of participants focused on their primary activity while occasionally observing their environment, but some balanced up to five activities at once (e.g., phone use, laptop use, drinking, painting nails, reading notes). The latter indicates the need for the vehicle interior design (surface space) to accommodate these activities simultaneously.
Discomfort and Posture
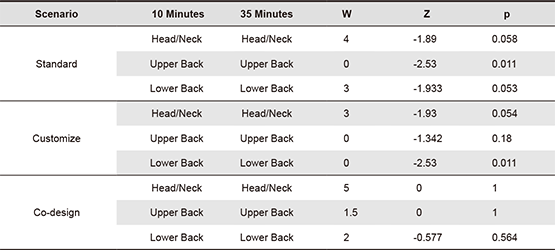
Overall discomfort levels were low in all scenarios, with the mean discomfort score across all body areas being 1.3 (falling between ‘Not Uncomfortable’ and ‘A Little Uncomfortable’). A two-tailed Wilcoxon signed rank test was conducted to examine whether there was a significant difference between the measurements at 10 minutes and 35 minutes for each body area (Figure 5). Table 6 shows that in both the Standard and Customize scenarios, participants reported significantly or near significantly more discomfort for the head/neck, upper back, and lower back after 35 minutes (based on an alpha value of .05). In the Co-design scenario, no such changes in discomfort levels were reported. No significant differences were observed in all other body areas for all scenarios.
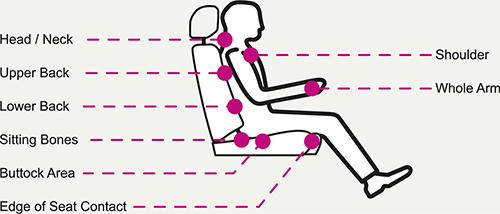
Figure 5. Body areas used for discomfort scores.
Table 6. Results of the Wilcoxon Signed Rank test (n = 16, Alpha value of .05).
Wellbeing was measured at the same time as discomfort using a questionnaire, but there were no differences between scenarios. However, for the Co-design condition, there was a reduction in ‘feeling confined’, which was not found in the other two conditions.
An analysis of participants’ posture was performed based on the method shown in Kamp et al. (2011). In total, 98 unique postures were recorded across all three scenarios. In the Standard scenario, 43 unique postures were observed; this increased to 49 in the Customize scenario and to 53 in the Co-design scenario, indicating more movement. Figure 6 (and referring to Table 2) shows the most frequent postures held throughout all three scenarios.
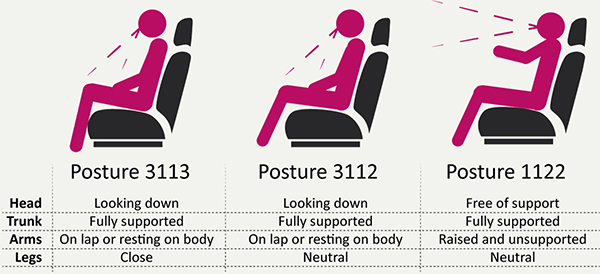
Figure 6. The most frequent postures observed.
Neck flexion was observed in the more frequently held postures, and the Body Part Discomfort scores showed the back and neck areas were of greatest concern in terms of discomfort. By comparing the subjective discomfort reports with the objective posture data, it was identified that neck flexion was linked with higher discomfort scores for the neck and back areas. Although no statistical correlation was calculated, less neck flexion was observed in the Co-design scenario, and there was no significant increase in reported discomfort during the simulated commute, which suggests that reducing/minimizing neck flexion can mitigate discomfort.
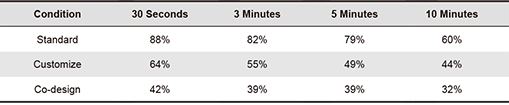
As the most frequent activity and likely cause of neck flexion, laptop usage was examined further. Table 7 shows the percentage of time neck flexion was held while using a laptop for greater than 30 seconds, 3 minutes, 5 minutes, and 10 minutes. Neck flexion was lowest in the Co-design scenario and decreased over time regardless of the scenario.
Table 7. Percentage of time in neck flexion during laptop use (n = 16).
Space Utilization
Space utilization was measured using the constructed variables that are outlined in Table 4. The data points are measured at a calculated H-point plotted on a 2-dimensional X-Y plane for the simulator sessions. One participant in the Standard scenario could not be included in this analysis as they chose to face rearwards and rotate the seat beyond the ability of the tracking method.
Figure 7 shows the hotspot plots for each scenario, with the variables calculated and detailed under each plot. A clear difference can be seen between each. The Standard scenario, where participants were most restricted by their environment, involved the most limited movement. In the Customize scenario, participants moved further rearwards and inwards and were often observed searching for a place to rest their items (such as a laptop). In the Co-design scenario, participants were offered additional features, such as lap tables and pivoting central tables (Figure 2 and Figure 8) to support their activities—they moved further rearwards and rotated their seats than in the Standard scenario. In the Co-design scenario, participants moved 342mm rearwards on average, with the majority moving at least 255mm rearwards. For comparison, a typical C-segment SUV would have a rearward travel distance of roughly 40mm from the nominal H-point position and a maximum travel distance in X of roughly 280mm.
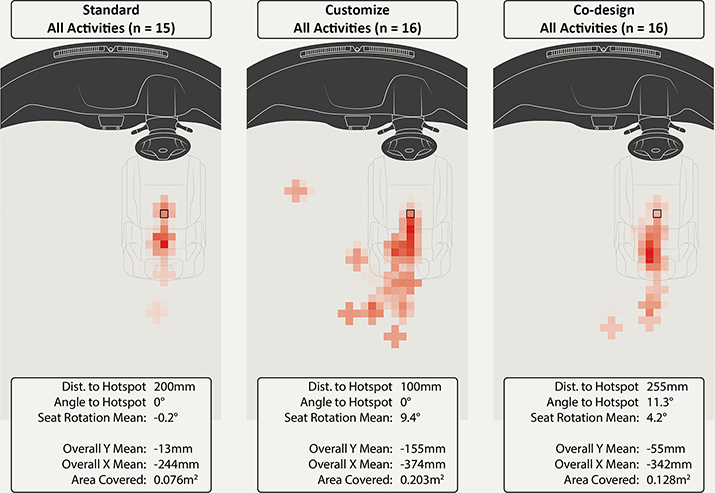
Figure 7. Hotspot analysis for each scenario.
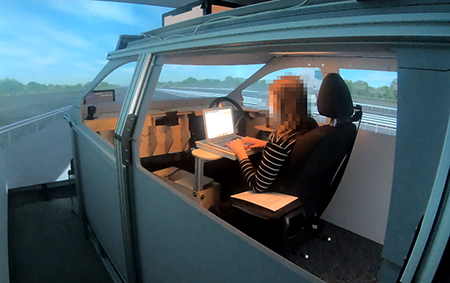
Figure 8. Participant using a laptop with individually co-designed support features.
Figure 9 shows a similar analysis of the data relating to the more frequent activities (i.e., using a laptop, using a mobile phone, and resting/sleeping). Participants rotated their seat the most during laptop use (M = 4.38°, SD = 12.81°, Maximum = 22°) compared to mobile phone use (M = 3.39°, SD = 6.36°, Maximum = 24°) and resting/sleeping (M = 0.65°, SD = 2.90°, Maximum = 4°). This indicates that the tasks that need more space caused participants to rotate the seat inward in search of that space. Although the mean seat rotation for each activity is modest, the maximum recorded angle and standard deviation show greater differences between the activities. Interestingly, participants who rested or slept were comfortable moving the seat rearwards only a little (50mm compared to 100 mm mobile phone and 255 mm laptop), remaining close to the driver controls. The brightest hotspot (most significant) for laptop users was positioned 255 mm (at an 11.3° angle from the X axis) away from the driving position, allowing participants to stretch their legs forwards and fully disconnect from the driving activity. This study indicates that laptop users are the most demanding with regard to the amount of space needed; users of AVs could expect new interior layouts to accommodate these activities.
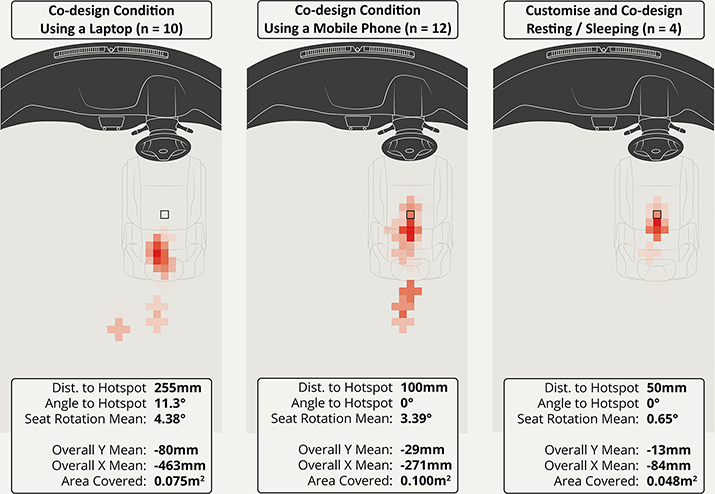
Figure 9. Hotspot analysis for different activities.
Notes were made on key observations and participants’ verbatim during the sessions. One observation was the dependence on flat, stable surfaces to support NDRT objects such as mobile phones, tablets, and laptops. Laptops were supported using the center console, the passenger side dashboard, and the surfaces provided (in the Co-design scenario). Mobile phones were mostly placed face-up on flat surfaces but occasionally propped up against the door (supported by the armrest) for video calls. It is interesting that space utilization was reported to be influenced by the other vehicles on the road, with some commenting that they felt safer sitting towards the center of the buck and so rotated their seats inwards. Indeed, some suggested that the centrally positioned display meant that they were forced to sit on either side of it (to use it as a secondary display), although they would have preferred to sit more centrally in the buck.
Discussion
This simulator study took a holistic approach to understanding potential space use and which NDRTs are likely to take place during a future autonomous driving commute in a single-occupancy commuter vehicle. The research focused on overarching requirements (e.g., space utilization, NDRTs) rather than more detailed requirements/specifications (e.g., seat design, detailed feature design). Therefore, this work will provide an understanding of how autonomy could affect design decisions involving vehicle architecture, which will influence interior car design.
Using a device was the most prevalent activity, with most of the participants spending time either using a phone, tablet, or laptop (both for work and non-work). A previous study by Wilson et al. (2022) found that during a commuting journey, occupants also reported that they would want to carry out a broad range of tasks/activities. Observation data gathered during train journeys found that reading, staring/gazing, or sleeping, and working on a laptop were the three most frequently observed activities, but working on a laptop involved the longest average duration (53 minutes) (Groenesteijn et al., 2014). Another survey conducted in the UK theorized that there could be ‘a possible travel duration threshold’ below which there was no time to do anything other than window gaze/people watch (Lyons et al., 2007). Lyons et al. also found that for business journeys, working or studying was the most frequent activity and surmised that, as first-class travelers spend most of their time working or studying, this could indicate that the increased space available enabled a positive and more comfortable working environment. Petterson (2017) conducted a case study to understand future users’ expectations of AVs and surmised that they would have to make a tangible difference to their lives to be adopted, such as improving the daily commute and being able to be completely immersed in other activities while being transported. They acknowledge that for this, the car design needs to allow the user to seamlessly go from conscious handling to allowing the car interfaces and interactions to fade into the background, and so let new habits and practices emerge.
Seat rotation is often a key feature of concept AV displays by Original Equipment Manufacturers (OEMs), and suppliers tend to showcase seats that can rotate to face rearwards during a journey. This research has found that only a minimal amount of seat rotation would be required to satisfy occupants (mean seat rotation 4.38°, standard deviation of 12.81° for laptop users). This aligns with findings from Salter et al. (2019) those who found that seat rotation angles of below 15° did not significantly contribute to motion sickness for a simulated city or motorway drive. However, they also found that rearward-facing seats significantly contributed to symptoms of motion sickness.
There is strong evidence to suggest comfort research should be measured within the context of the environment and activity (Smulders & Vink, 2021). The current study aimed to achieve this by noting the posture alongside a discomfort score and measuring these in a controlled environment. Previous research has demonstrated that taking walking breaks from long-term driving can improve comfort (Sammonds et al., 2017), and similarly, freedom to move and stretch within the car seat has been shown to have a positive effect on comfort and well-being as well as reducing the risk of musculoskeletal symptoms (Gyi, 2013; Varela et al., 2019). The research presented in this paper has shown that by allowing participants more space in the vehicle, a greater number of postures were observed, resulting in more movement. This increased from 43 observed postures in the Standard scenario to 53 in the Co-design scenario, which is likely to positively impact reports of discomfort. There is a large body of work that highlights neck flexion as an issue for tablet and laptop users (Gold et al., 2012; Shin & Zhu, 2011; Young et al., 2012). A noticeable increase in neutral postures (reduced neck flexion) was found in the current study, likely due to a more adaptable space and additional supporting features such as raised surfaces and armrests. It has been proven that deviating from the neutral posture can lead to joint discomfort (Genaidy & Karwowski, 1993), even when there is no significant difference in physiological measures (Smulders et al., 2019; Van Veen et al., 2014). Overall discomfort levels were low, but a significant improvement was observed in the Co-design scenario.
This research has some inherent limitations. The sessions were conducted in a simulated environment using a vehicle buck, which affected the space available, with a further implication that only one set of interior dimensions could be tested. There will be differences and different challenges to consider for smaller and larger spaces, but the vehicle chosen for this study was a typical family car (and utilized the maximum space possible for this vehicle class). The latter was realistic for this research as, ultimately, car sizes are dictated by legislation and regional architectural and city planning restrictions. The low-mid fidelity design of the vehicle buck and additional features could also influence space utilization; however, a decision was made to keep the design of the buck simple with few distractions and the features as portable as possible so as not to limit movement. This flexibility of space available in the buck was preferable to a fully integrated feature solution (e.g., a fixed deployable surface in the center of the buck) as it allowed more freedom for co-designing discussions. Indeed, the unusual vehicle interior is likely to have impacted on participant choices, but this flexibility was encouraged as it is likely that the utilization of space in future vehicles will change in future Autonomous Vehicles. A further limitation was the number (and age range) of participants, which could impact the variety of NDRTs undertaken and space requirements. This was partly due to the timing of the study, which took place during the COVID-19 pandemic. Further to this, structuring the study around a commuting journey is likely to limit participants’ motivation to carry out leisure activities. Different simulated environments (towns and cities), and multiple occupancy journeys (friends, strangers, family dynamics) were also not explored.
The research design meant that it was not possible to randomize the order of the scenarios as decisions about which activities to carry out evolved with the experience of automated driving. Although there may be a confounding effect when comparing scenarios, the experience of autonomous driving NDRTs allowed more confidence in our findings, i.e., which NDRTs, the space requirements, and additional design features are needed.
Multiple occupancy of AVs was not explored, but clearly, individuals will have different needs/requirements during journeys, so designing solutions that allow all users to utilize the shared space is desirable. In the scenario of shared driverless vehicles, Wu et al. (2024) also propose that design research focuses on users’ subtle feelings and personal preferences, such as being able to report security issues and seating, which allows them to have the flexibility to interact or disconnect with other passengers as needed. Stromberg et al. (2018) advocate that for exploration of the social aspects of AVs, methods that offer a contextualizing dimension enabling consideration of future scenarios could be particularly useful. Pink et al. (2020) conducted ethnographic research that revealed the complexities of ensuring that future AVs fit with human needs and feelings of trust and comfort, which can include familiarity, routines, expectations, and associated anxieties. They advocate a design anthropological approach because it puts potential future users at the center and gets under the surface of what is actually happening. This is an interesting consideration for future AV simulation studies.
Finally, the use of a simulated environment did not replicate driving dynamics, and therefore, it was not as immersive as a real drive. However, due to the nature of the study and the current maturity of autonomous vehicles, a driving simulator was necessary for SAE Level 4 autonomy. Re-engagement with the driving task was not the focus of the study, although the authors fully acknowledge that a range of driving positions and seating configurations may impact a driver’s capability to fully regain control of the vehicle if a handover is requested by the autonomous vehicle. Eriksson and Stanton (2017) found quite large variations in takeover time (between 1.9 seconds and 25.7 seconds) depending on whether a secondary task was being performed at the time a handover request was made by the vehicle. Therefore, it is difficult to generalize from this study on how much time should be allocated. However, given that the takeover can take up to 26 seconds, a relatively long takeover time should be factored into the operational design domain of any vehicle that encourages secondary task performance during autonomous driving.
Conclusions
This study has identified new findings that have not been addressed in the literature, as well as expanded on areas that have. In the context of this research, these are:
- Participants chose to undertake a mentally and physically engaging task for a simulated 45-minute commute. Using electronic devices such as mobile phones, laptops, and tablets was the most frequently conducted activity; for example, laptop use made up 20% of the total time spent in the Standard and increased to 46% in the Co-design scenario. This differs from the literature, which suggests passive tasks (such as listening to music) would be more frequent in AVs (Bansal et al., 2016; Kyriakidis et al., 2015; Schoettle & Sivak, 2014). When participants selected to use a laptop, this was by far the most dominant use of the time during the commuting journey. In contrast, mobile phone users were more likely to undertake different types of activities (e.g., texts, reading, calls).
- Future AVs should consider new seat layouts that allow rotation and extended rearward travel. Laptop users moved inboard as well as rearwards, suggesting a non-parallel seat rail arrangement; this would require major changes to the current vehicle architecture to accommodate both the new seating positions and safety in a collision.
- Participants used more space (a larger footprint) to carry out NDRTs than would be possible in current production seats and interior designs. This increase in space would allow freedom to move and stretch within the car seat, which has a positive effect on the body, reducing the risk of musculoskeletal symptoms.
- Laptop users use the most interior space, which enables them to use the device comfortably. This is to be expected as laptop use would require more space than would be provided normally (255mm to hotspot, 4.38° mean seat rotation). However, mobile phone users also require additional space over a current production vehicle (100 mm to hotspot, 3.39° mean seat rotation).
- There is a possibility that seating postures in AVs could cause discomfort if NDRTs are not adequately supported. This research found high levels of neck flexion during autonomous driving due to device use with some reduction when using supporting features such as work surfaces (e.g., lap tables), which raised the device to a more comfortable level.
By understanding how occupants use space and what they require, designers, researchers, policymakers, and OEMs can design a better AV experience that is safer and more comfortable. This study also showed the importance and impact that additional features (e.g. armrests, laptop table) will have on interior space use and minimize discomfort.
A gap in the literature has been clearly identified, which pertains to understanding user (driver) needs in terms of AV interior requirements in more detail, for example, the larger structural considerations (e.g., overall footprint) and supporting NDRT preferences. Further research is needed to investigate different vehicle sizes, journey types, and multiple occupancies, which will contribute to the growing body of knowledge in autonomous vehicle interior design.
Acknowledgements
We would like to acknowledge the EPSRC and Nissan Motor Co. Ltd for funding this research.
References
- Bansal, P., Kockelman, K. M., & Singh, A. (2016). Assessing public opinions of and interest in new vehicle technologies: An Austin perspective. Transport Research Part C: Emerging Technologies, 67, 1-14. https://doi.org/10.1016/J.TRC.2016.01.019
- Bivand, R., & Wong, D. W. S. (2018). Comparing implementations of global and local indicators of spatial association. TEST, 27, 716-748. https://doi.org/10.1007/s11749-018-0599-x
- Charmant, J. (2019). Kinovea. https://www.kinovea.org/
- Corlett, E. N., & Bishop, R. P. (1976). A technique for assessing postural discomfort. Ergonomics, 19(2), 175-182. https://doi.org/10.1080/00140137608931530
- Council Directive 96/53/EC. (1996). Laying down for certain road vehicles circulating within the community the maximum authorized dimensions in national and international traffic and the maximum authorized weights in international traffic. https://eur-lex.europa.eu/legal-content/EN/TXT/?uri=celex%3A31996L0053
- Eriksson, A. & Stanton N. A. (2017). Takeover time in highly automated vehicles: Noncritical transitions to and from manual control. Human Factors, 59(4), 689-705. https://doi.org/10.1177/0018720816685832
- Fiorillo, I., Piro, S., Anjani, S., Smulders, M., Song, Y., Naddeo, A., & Vink, P. (2019). Future vehicles: The effect of seat configuration on posture and quality of conversation. Ergonomics, 62(11), 1400-1414. https://doi.org/10.1080/00140139.2019.1651904
- Genaidy, A. M., & Karwowski, W. (1993). The effects of neutral posture deviations on perceived joint discomfort ratings in sitting and standing postures. Ergonomics 36(7), 785-792. https://doi.org/10.1080/00140139308967942
- Giacomin, J. (2014). What is human-centered design? The Design Journal, 17(4), 606-623. https://doi.org/10.2752/175630614X14056185480186
- Gold, J. E., Driban, J. B., Yingling, V. R., & Komaroff, E. (2012). Characterization of posture and comfort in laptop users in non-desk settings. Applied Ergonomics, 43(2), 392-399. https://doi.org/10.1016/j.apergo.2011.06.014
- Groenesteijn, L., Hiemstra-van Mastrigt, S., Gallais, C., Blok, M., Kuijt-Evers, L., & Vink, P. (2014). Activities, postures and comfort perception of train passengers as input for train seat design. Ergonomics, 57(8), 1154-1165. https://doi.org/10.1080/00140139.2014.914577
- Gyi, D. (2013). Driving posture and healthy design. In N. Gkikas (Ed.), Automotive ergonomics (pp 123-131). CRC Press. https://doi.org/10.1201/b13017
- Schifferstein, H. N. J., Mugge, R., & Hekkert, P. (2004). Designing consumer-product attachment. In D. McDonagh, P. Hekkert, J. Van Erp, & D. Gyi (Eds.), Design and emotion: The experience of everyday things (pp. 327-331). Taylor & Francis.
- Kamp, I., Kilincsoy, Ü., & Vink, P. (2011). Chosen postures during specific sitting activities. Ergonomics, 54(11), 1029-1042. https://doi.org/10.1080/00140139.2011.618230
- Kyriakidis, M., Happee, R., & de Winter, J. C. F. (2015). Public opinion on automated driving: Results of an international questionnaire among 5000 respondents. Transport Research Part F: Traffic Psychology Behavior, 32, 127-140. https://doi.org/10.1016/j.trf.2015.04.014
- Range Rover Models and Specifications (n.d.). Retrieved May 9, 2025, from https://www.landrover.co.uk/content/dam/lrdx/pdfs/uk/wltp-pdfs/Range-Rover-WLTP-Insert-1L4602310000WGBEN02P.pdf
- Large, D. R., Burnett, G. E., Morris, A., Muthumani, A., & Matthias, R. (2017). Design implications of drivers’ engagement with secondary activities during highly-automated driving – A longitudinal simulator study. In Proceedings of the AHFE international conference on human factors in transportation (pp. 583-594). Springer.
- Lyons, G., Jain, J., & Holley, D. 2007. The use of travel time by rail passengers in Great Britain. Transport Research Part A: Policy and Practice. 41(1), 107-120. https://doi.org/10.1016/j.tra.2006.05.012
- Parkers (n.d.). Ford Fiesta practicality and safety. Retrieved April 10, 2024, from https://www.parkers.co.uk/ford/fiesta/review/practicality/
- Petterson, I. (2017). Travelling from fascination to new meanings: Understanding user expectations through a case study of autonomous cars. International Journal of Design, 11(2), 1-11.
- Pheasant, S., & Haslegrave, C. M. (2018). Bodyspace: Anthropometry, ergonomics and the design of work eBook (3rd ed.). CRC Press.
- Pink, S., Osz, K., Raats, K., Lindgren, T. & Fors, V. (2020). Design anthropology for emerging technologies: Trust and sharing in autonomous driving futures. Design Studies, 69(Jul), 1-21. https://doi.org/10.1016/j.destud.2020.04.002
- Puig-Diví, A., Escalona-Marfil, C., Padullés-Riu, J. M., Busquets, A., Padullés-Chando, X., & Marcos-Ruiz, D. (2019). Validity and reliability of the Kinovea program in obtaining angles and distances using coordinates in 4 perspectives. PLoS ONE, 14(6), Article e0216448. https://doi.org/10.1371/journal.pone.0216448
- SAE International. (2021, April 30). Taxonomy and definitions for terms related to driving automation systems for on-road motor vehicles (Standard No. J3016). Retrieved from https://www.sae.org/standards/content/j3016_202104/
- Salter, S., Diels, C., Herriotts, P., Kanarachos, S., & Thake, D. (2019). Motion sickness in automated vehicles with forward and rearward facing seating orientations. Applied Ergonomics, 78, 54-61. https://doi.org/10.1016/j.apergo.2019.02.001
- Sammonds, G. M., Mansfield, N. J., & Fray, M. (2017). Improving long term driving comfort by taking breaks – How break activity affects effectiveness. Applied Ergonomics, 65, 81-89. https://doi.org/10.1016/j.apergo.2017.05.008
- Schoettle, B., & Sivak, M. (2014). A survey of public opinion about autonomous and self-driving vehicles in the U.S., the U.K., and Australia (Report No. UMTRI-2014-21). The University of Michigan Transportation Research Institute. https://deepblue.lib.umich.edu/handle/2027.42/108384
- Shin, G., & Zhu, X. (2011). Ergonomic issues associated with the use of touchscreen desktop PC. Proceedings of the Human Factors and Ergonomics Society Annual Meeting, 55(1), 949-953. https://doi.org/10.1177/1071181311551197
- Smulders, M., Naddeo, A., Cappetti, N., van Grondelle, E.D., Schultheis, U., & Vink, P. (2019). Neck posture and muscle activity in a reclined business class aircraft seat watching IFE with and without head support. Applied Ergonomics, 79, 25-37. https://doi.org/10.1016/j.apergo.2018.12.014
- Stromberg, H., Petterson, I., Andersson, J., Rydstrom, A., Dey, D., Klingergard, M., & Forlizzi, J. (2018). Designing for social experiences with and within autonomous vehicles – Exploring methodological directions. Design Science, 4(13), 1-29. https://doi.org/10.1017/dsj.2018.9
- Van der Bijl-Brouwer, M., & Dorst, K. (2017). Advancing the strategic impact of human-centerd design. Design Studies, 53, 1-23. https://doi.org/10.1016/j.destud.2017.06.003
- Van Veen, S. A. T., Hiemstra-Van Mastrigt, S., Kamp, I., & Vink, P. (2014). Improving car passengers’ comfort and experience by supporting the use of handheld devices. Work, 49(2), 215-223. https://doi.org/10.3233/WOR-131716
- Varela, M., Gyi, D., Mansfield, N., Picton, R., Hirao, A., & Furuya, T. (2019). Engineering movement into automotive seating: Does the driver feel more comfortable and refreshed? Applied Ergonomics, 74, 214-220. https://doi.org/10.1016/j.apergo.2018.08.024
- Wadud, Z., & Huda, F. Y. (2019). Fully automated vehicles: The use of travel time and its association with intention to use. Proceedings of the Institute of Civil Engineers: Transport, 176(3), 127-141. https://doi.org/10.1680/jtran.18.00134
- Wickham, H. (2016). Ggplot2: Elegant graphics for data analysis. Springer-Verlag.
- Wickham, H., Averick, M., Bryan, J., Chang, W., McGowan, L. D., François, R., Grolemund, G., Hayes, A., Henry, L., Hester, J., Kuhn, M., Pedersen, T. L., Miller, E., Bache, S. M., Müller, K., Ooms, J., Robinson, D., Seidel, D. P., Spinu, V., Takahashi, K., Vaughan, D., Wilke, C., Woo, K., & Yutani, H. (2019). Welcome to the tidyverse. Journal of Open Source Software, 4(43), Article 1686. https://doi.org/10.21105/joss.01686
- Wilson, C., Gyi, D., Morris, A., Bateman, R., & Tanaka, H. (2022). Non-driving related tasks and journey types for future autonomous vehicle owners. Transportation Research Part F: Psychology and Behavior, 85, 150-160. https://doi.org/10.1016/j.trf.2022.01.004
- Wu, J., Clark, S., Kennard, A., Dalum Hesseldahl, K., & Diels, C. (2024). Design for shared driverless vehicles of the future. The Design Journal, 27(4), 1-22. https://doi.org/10.1080/14606925.2024.2420155
- Young, J. G., Trudeau, M., Odell, D., Marinelli, K., & Dennerlein, J. T. (2012). Touch-screen tablet user configurations and case-supported tilt affect head and neck flexion angles. Work, 41(1), 81-91. https://doi.org/10.3233/wor-2012-1337
