Exploring Relationships between Touch Perception and Surface Physical Properties
Institute of Engineering Systems and Design, School of Mechanical Engineering, University of Leeds, Leeds, UK
This paper reports a study of materials for confectionery packaging. The aim was to explore the touch perceptions of textures and identify their relationships with the surfaces’ physical properties. Thirty-seven tactile textures were tested including 22 cardboards, nine flexible materials and six laminate boards. Semantic differential questionnaires were administered to assess responses to touching the textures against six word pairs: warm-cold, slippery-sticky, smooth,-rough, hard-soft, bumpy-flat, and wet-dry. Four physical measurements were conducted to characterize the surfaces’ roughness, compliance, friction, and the rate of cooling of an artificial finger when touching the surface. Correlation and regression analyses were carried out to identify the relationships between the people’s responses and the physical measurements. Results show that touch perception is often associated with more than one physical property, and the strength and form of the combined contribution can be represented by a regression model.
Keywords – Product Experience, Roughness, Texture, Touch Perception.
Relevance to Design Practice – This work contributes to the goal of predicting consumers’ emotional responses to products by characterizing some of the relationships between the dimensions of touch perception and the tactile textures’ physical properties.
Citation: Chen, X., Shao, F., Barnes, C., Childs, T., & Henson, B. (2009). Exploring relationships between touch perception and surface physical properties. International Journal of Design, 3(2), 67-77.
Recieved March 17, 2009; Accepted July 31, 2009; Published August 31, 2009.
Copyright: © 2009 Chen, Shao, Barnes, Childs, & Henson. Copyright for articles published in this journal is retained by the authors, with first publication rights granted to the International Journal of Design. All journal content, except where otherwise noted, is licensed under Creative Commons Attribution-NonCommercial-NoDeriv 2.5 License. By virtue of their appearance in this open-access journal, articles are free to use, with proper attribution, in educational and other non-commercial settings.
*Corresponding Author: b.henson@leeds.ac.uk
Introduction
There is growing interest among consumer goods manufacturers to be able to relate a product’s physical properties to a consumers’ emotional experience when using a product, one aspect of which is touch. They would like to know the relationships between people’s affective responses and a surface’s topographical and material properties; and even more, what affects would be elicited by a specific material. This information is essential for them to be able to manufacture materials with surface properties that would elicit emotions congruent with a product’s brand. This paper presents research aimed at helping them in this goal by focusing on the touch experience of a product’s surface texture. The researchers investigated people’s touch perceptions of various textures, and explored the relationships between their perceptions and the surfaces’ physical properties.
Understanding how and why people have different affective responses to tactile texture is difficult. This paper presents a preliminary exploration of whether a useful framework for developing this understanding is a layered one, in that people’s affective response depends first on their perceptual one. As far as people’s touch information processing is concerned, there is a biologically plausible chain of events. First, touching a surface stimulates mechanical (Merkel discs, Ruffini endings, Meissner’s and Pacinian corpuscles responding to strain and rate of change of strain) and thermal receptors beneath the skin. The response characteristics of these are well-known (Klatzky & Lederman, 2002; Kandel, Schwartz, & Jessell, 2000). The patterns of stimulation are mapped on to outer areas of the brain (primary sensory cortices) in a homuncular manner. A first level of processing relates to psychophysical (or sensorial) judgments, perhaps related to appraisal as a precursor to emotion (i.e. Desmet, 2007). Subsequently these judgments pass to other areas of the brain where they are combined, and later may also be compared to memories, to create affective judgments (Kringelbach, 2005). This paper reports initial work looking at what might be the first link of this chain – the relationships between a person’s touch perception and the combination of tactile texture and physical properties.
Perceptual Dimensions
There are many examples of research in the psychophysics literature that attempt to identify the perceptual dimensions of touch, without necessarily relating them to the physical properties of the stimuli. Hollins, Faldowski, Rao, and Young (1993) carried out a multidimensional scaling analysis of people’s perceived similarities of the tactile properties of stimuli including wood, sandpaper and velvet. People’s ratings of the stimuli against roughness, hardness, slipperiness, bumpiness and warmth were then regressed against the multidimensional space. They found that roughness-smoothness and hardness-softness were robust orthogonal dimensions of touch perception. A third dimension did not strongly correspond to the ratings, but they speculated that it might correspond to elasticity or springiness. Hollins et al. concluded that the “feel” of an object probably depends on a combination of perceptual properties. Hollins, Bensmaia, Karlof, and Young (2000) repeated the experiment using ratio scaling, and this time interpreted the weaker third dimension as sticky-slippery. Hollins, Lorenz, Seeger, & Taylor (2005) used a haptic force-feedback device on virtual surfaces to conclude that resistance to normal force, coefficient of friction, texture scale and vibration amplitude could not be perceptually separated. Gescheider, Bolanowski, Greenfield, and Brunette (2005) used multidimensional scaling to identify perceptual dimensions of blur, roughness and clarity. A commercial example of an attempt to formalize and calibrate descriptions of perceptual dimensions for the automotive industry is the Sensotact® reference frame (Sensotact, www.sensotact.com).
Relating Perception and Properties
There is also a body of psychophysical and neuropsychological work that attempts to compare people’s perceptions with a surface’s and material’s properties. The work of Roberta Klatzky, Susan Lederman, and Mark Hollins accounts for most of what is known (e.g. Lederman & Klatzky, 2007). Because of the need to rigorously control variables, most of the work has studied single perceptual properties, with the most studied property being roughness. Apart from the work of those just mentioned, Ekman, Hosman, and Lindstrom (1965) carried out an early experiment on roughness, and measured the friction coefficient of seven surfaces including five sandpapers, one cardboard and one ordinary paper. They related the friction coefficient values with roughness perceptions, and found that roughness perception has a power function related to the surfaces’ friction coefficient. Smith, Chapman, Deslandes, Langlais, and Thibodeau (2002) tested friction forces and found that perceptions of roughness may have correlations with tangential stroking force rate. Despite the immense understanding that has been established, a single measure or characterization of roughness remains elusive (Hollins & Bensmaia, 2007).
Other psychophysical studies considered the softness of materials. Harper and Stevens’ (1964) study on softness perception established the exponent for its power law, and that hardness and softness judgments were reciprocally related. Tiest and Kappers (2006) studied a set of 124 stimuli to compare subjective judgments with measures of compliance and roughness. They found that perceptions of roughness and softness might depend on more than one physical parameter of the stimuli in some combined way. They acknowledge that correlations between physical properties could have influenced their results. The existence of statistical correlations between physical properties has also been noted elsewhere (Hollins et al. 2000). There is very little psychophysical work on wet-dry perception, perhaps because none of the tactile receptors in the finger respond directly to water (Kandel, Schwartz, and Jessell, 2000, chap. 22).
The relationships between how people experience products and the properties of materials are also being explored in the context of selection of materials for product design. Karana, Hekkert and Kandachar (2009) have analyzed people’s perception of the properties of products and the meanings they attribute to the product. In the experiment, participants rated selected products against 22 properties associated with materials and manufacturing processes on a five-point scale. The means were qualitatively and quantitatively compared with the five meanings that the participants attributed to the products: aggressive, nostalgic, professional, sexy and toy-like. They found that combinations with other object properties, such as shape, context of use and background of the use, affected the meanings attributed to the product. The present authors have studied people’s reports of both handling frosted glass cosmetics bottles (Barnes, Childs, Henson, & Southee, 2004), which demonstrated that affective responses to tactile stimuli could be linked to their rational cause, as well as handling surfaces screen-printed with coarse patterns (Childs & Henson 2007), which related affective responses to textures to the contact mechanics of the finger on the surface .
There is also applicable literature concerned with textiles and clothing. Of particular relevance to the work of this paper is the existence of test methods concerned with compliance and thermal measurement used, for example, to characterize the draping of textiles (Strazdiene & Gutauskas 2005) or the heat loss rate from a human finger when touched (Hu, Hes, Li, Yeung, & Yao, 2006), or both (Kawabata 1982).
Combinations of Perceptual Dimensions
From these psychophysical and physical studies comes an establishment of tactile word pairs, physical measurement methods and possible cross-coupling between perceived tactile properties and the physical measurements, all of which have guided the present research. The approach taken here is different in two ways. First, the previous studies’ subjective and objective relations were largely approached on a one-to-one basis (i.e. the relationship between a single perceptual property such as roughness and a single property such as the size of gratings). In reality, however, a perception of a surface or material is a combination of perceptions of different properties. While others have considered how perceptions from different senses combine, for example, in visual and haptic judgments of length (Ernst & Banks 2002), there has been very little work into how touch perception of different material properties combine. One-to-one relations are not sufficient for understanding people’s subjective responses to surfaces and materials. Therefore, in this study, we take into account how several different material and texture perceptual properties combine. Secondly, contexts were rarely specified in previous studies. Context is important for an industrial application because the range of materials used in different industries varies, and people’s perceptions change when they are presented with different products. Others have confirmed the importance of context in experiencing materials (Karana et al., 2009). For example, if materials for food packaging are tested, a surface that is described as being rough may not be considered rough if it were placed together with sand papers. A person may like a soft surface on his or her mobile phone, but would not like a soft surface in their kitchen. Thus, we acknowledge that the words used in this study are not purely perceptual, but are perhaps affectively biased by the stated context.
Affective Engineering
The method used in this research is taken from affective engineering. Affective engineering is concerned with measuring people’s affective responses to products, identifying the properties of the products to which they are responding, and then using the information to design better products. It is a westernized approach to kansei engineering which has been pioneered by Nagamachi (1995) in Japan since the 1970s. Kansei is a Japanese term for consumers’ psychological impressions and feelings about a product.
The most commonly used approach in affective engineering is to identify adjectives that people use to describe the product, and then to embody them into a self-report, semantic differential questionnaire. On a semantic differential questionnaire, respondents are asked to rate a stimulus on, typically, five, seven or nine-point scales between bivalent adjectives, such as rough and smooth (Osgood, Suci, & Tannenbaum, 1957). The responses to the questionnaires are turned into a measure of affective response using multivariate techniques, such as principal components analysis. This reduces the responses against the words to a small number of constructs, and allows the calculation of a measure of each stimulus against those constructs against which measures of the physical properties or features of the stimuli can be regressed (Henson, Barnes, Livesey, Childs, & Ewart, 2006). This approach has been applied successfully to many different types of products (Schütte, 2005). The approach taken here is similar, except that correlation and regression are used, because the aim is to investigate perceptions against particular adjectives, rather than constructs that emerge from the use of principal components analysis.
This paper investigates people’s touch perceptions of 37 surface textures in the context of food packaging. Responses of the textures were assessed by rating against six adjective pairs: warm-cold, slippery-sticky, smooth-rough, hard-soft, bumpy-flat, and wet-dry. People’s preference of surface textures was assessed using like-dislike. Four physical measurements were conducted: surface roughness, friction coefficient, compliance, and the rate of cooling of an artificial finger when touching the surface. The results were related to participants’ perceptual ratings. Correlation and regression analysis were carried out to identify relationships between one or more of the physical properties and touch perceptions.
Method
The investigation of the tactile textures included three aspects of work: a self-report study to obtain perceptual ratings of materials; measurement of the surfaces’ physical properties; and correlation and regression analysis between the two, as shown in Figure 1.
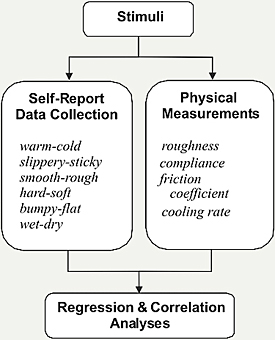
Figure 1. A self-report, semantic differential questionnaire establishes affective responses of stimuli against words warm-cold etc., which are regressed against and correlated with physical measurements of the stimuli.
Stimuli
The 37 tactile textures used in the study included three types of materials: (1) surfaces 1-22 were cardboards; (2) surfaces 23-31 were flexible materials, such as laminated foils and papers; and (3) surfaces 32-37 were laminate boards. The cardboards and flexible materials are used for food packaging, while the laminate boards are used for furniture manufacturing and were included to expand the variety of textures. These 37 stimuli covered a wide variety of textures with different physical properties, e.g. roughness, hardness, and warmth. The stimuli were cut into 11cm x 8cm rectangles and were labeled for identification.
Self-Report Data Collection
A semantic differential questionnaire was administered to collect data on people’s touch perceptions of the 37 textures. The experiment was conducted in a neutrally-furnished consumer research laboratory used for focus groups and self-report studies. The surface textures were presented in two, neutrally-colored cabinets. One side of each cabinet was kept open and covered with a white curtain so that participants could not see the stimuli, while still allowing them to touch the surfaces.
Semantic differential questionnaires were prepared using six pairs of adjectives: warm-cold, slippery-sticky, smooth-rough, hard-soft, bumpy-flat, and wet-dry. These are words commonly found in the affective engineering and psychology literature for studies on touch perception (Hollins, et al., 2000; Barnes et al., 2004; Childs & Henson, 2007). Rather unconventionally, the pairs of words were separated on a twenty point scale. This was done to allow room on the scale for participants to express their ratings precisely. Semantic differentials usually use odd numbers on the scale to allow participants to express indifference on the valenced item; and five, seven or nine points are most often used, perhaps because due to the limited short term memory of the participants (Miller, 1956). On each questionnaire, the words were randomly polarized and presented in a random order. At the bottom of each questionnaire was a three-point scale asking whether participants liked each surface. Figure 2 shows an example of a questionnaire.
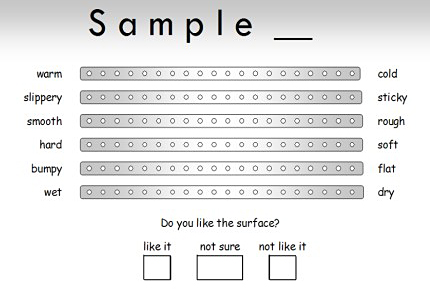
Figure 2. An example questionnaire.
Eighteen participants, 12 males and six females, aged 20 to 60, completed questionnaires. Participants attended each session singly or in pairs in the consumer research laboratory. Before the questionnaires were administered, they were asked to sit by the table where the cabinets were placed. The participants were told that the experiment was to assess the suitability of materials for confectionery packaging, and the context of confectionery packaging was introduced. The details of this aspect of the protocol cannot be disclosed for commercial reasons, but typically a context would be introduced through the use of a structured activity, such as a controlled discussion of advertisements in magazines, or the watching of a video (Henson et al., 2006).
Participants were asked to touch the stimuli one at a time while imagining them being used for confectionery packages. They then rated each stimulus against the words on the questionnaires. No restrictions were given as to which hand or which part of the hand could be used to touch the surfaces. After completing each questionnaire, they were asked to take the stimulus out of the cabinet and record its identification number on the questionnaire. The stimuli were presented to each participant in a random order. Participants received a small gift to compensate them for their time.
Physical Measurements
Four physical measurements were carried out on each of the stimuli. Arithmetical mean roughness, Ra (µm), was used because it is probably the most popular measure of the roughness of surfaces. It measures the average height of the peaks and valleys of the surface.. Roughness was measured using a commercial stylus surface profilometer (RTH Form Talysurf 120L). The diamond stylus (radius 2.5µm) of the Talysurf machine scanned an area of 5mm × 5mm on each surface and recorded the spot heights at a resolution of 1024 data points per mm2. These were then filtered by the acquisition software to remove any apparent form, and thresholded to remove any suspected rogue points from the surface. A three dimensional texture profile was subsequently generated. Post-processing software was then used to extract the values of Ra roughness.
Friction coefficient, rates of cooling of an artificial finger, and compliance were measured using the same piezo-electric force platform (Kistler MiniDyn), shown schematically in Figure 3. For the friction measurement (Figure 3(a)), each stimulus was fixed to the force platform. An experimenter pressed (load Fy) and slid (load Fx) his/her finger tip against it. The forces, Fx and Fy, were recorded against time. The friction coefficient was obtained from the ratio Fx/Fy. Loads Fy were in the range 0.5 to 3N. For the heat transfer measurement (Figure 3(b)), an artificial, silicone rubber fingertip was loaded on to the surface without sliding (Fy = 1N). A thermocouple was embedded just within the tip. Before contacting the surface, the tip was heated by an internal cartridge heater to 32 ± 0.2°C, which is the typical temperature of the skin of the human finger. On contact under load with the surface, the change (fall) with time of the thermocouple temperature was recorded. The maximum rate of change (°C/s), which occurred at the start of contact, was taken as the measure the rate of cooling of the artificial finger. For the compliance measurement, a soft rubber support was inserted between the surface and the force platform, and the artificial finger was replaced by a steel ball of radius 7 mm. The ball was pressed into the surface of each stimuli and the ball’s displacement Dy with increasing load Fy was recorded. The measure of compliance was empirically taken to be the value of Dy (mm) when Fy was 3N. In all cases, measurements were repeated several times and averages obtained.
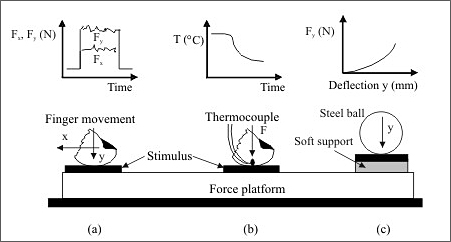
Figure 3. Schematic views of experimental apparatus:
(a) measurement of friction, (b) rate of cooling of the artificial finger, and (c) compliance.
Correlation and Regression Analysis
The responses to the stimuli were scored between -10 and +10 and means were obtained across all participants for each stimulus against each word. Not liking a stimulus was scored as -10, and liking +10, to normalize liking responses with those of the other words. An Excel file was created and the data double-entered as a matrix X of order (p, n) x m, where p was the number of subjects, n was the number of stimuli and m were average scores of the six adjective pairs. Mean average scores were then calculated and entered in a separate file. Correlation and regression analyses were conducted with the commercial software SPSS 12.0, and Pearson’s correlation was selected for correlation analysis. The mean responses of the six adjective pairs, scores of people’s preference, and the four measurements were used as variables. For the regression analysis, mean scores of adjective pairs were selected one at a time as the dependent variable and the four measurements of physical properties were selected as independent variables. To verify our findings, a regression analysis was also performed on like-dislike with the six subjective perceptions as independent variables.
Results
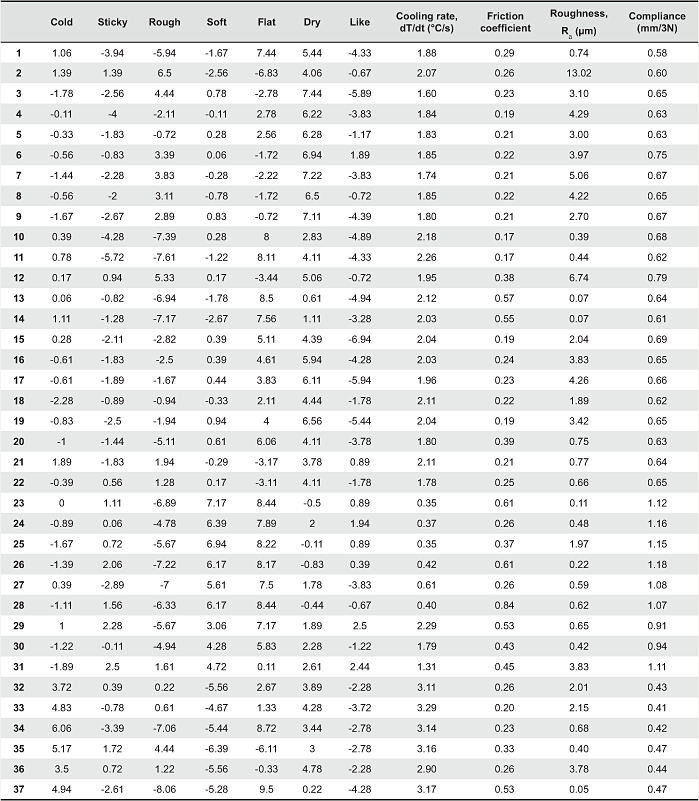
The participants’ mean average scores of the stimuli against the words are shown in Appendix A. Average values of each of the four physical measurements are also recorded in Appendix A.
Correlation analysis created an 11x11 matrix illustrating the relationships between each variable (Table 1). In the table, only correlations at a significant level (p<0.01) are shown. Row and column titles shown in non-italics are the word responses, whereas the rows and columns for the physical measurements are shown in italic font. Only one word from each word pair is shown for clarity in the row and column titles, and is the word from the end of each scale that was scored +10 and corresponds to the signs of the correlations in the table. Figure 4 illustrates the relationships shown in Table 1.
Table 1. Correlation matrix of participants’ responses and measurements of physical properties, showing relationships between responses to adjectives and physical properties of stimuli
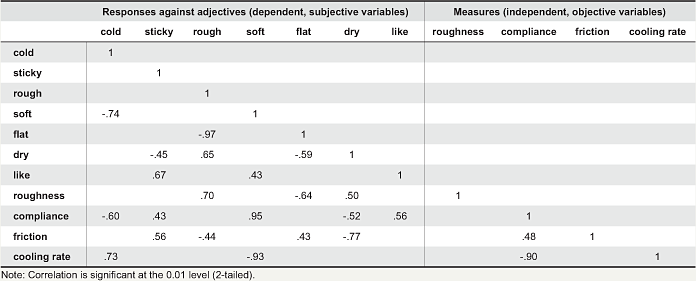
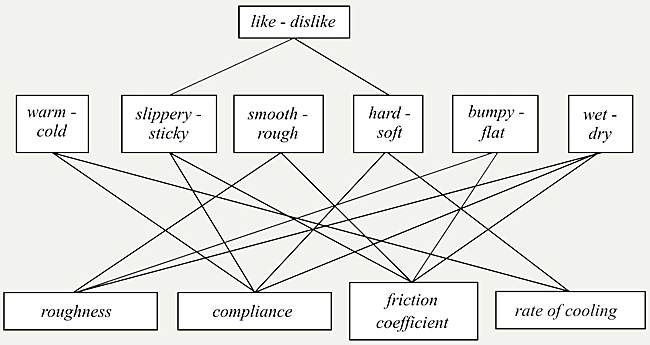
Figure 4. Correlations between liking, responses to adjective pairs and the physical measurements.
This is a graphical representation of the data in Table 1, with lines representing significant correlations.
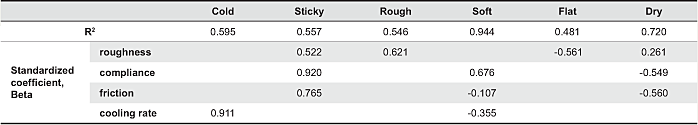
Correlation analysis was used to explore the linear relationships between pairs of variables. It was found that ratings against a pair of adjectives can have relationships with more than one measured physical property. To explore the strength and the form of combinations of these physical properties contributing to a rating, regression analysis was performed. Six significant models (p<0.001) were created. Table 2 presents the standardized coefficients of the measured physical properties that significantly entered the models (p<0.05). The full regression models are shown in Appendix B.
Table 2. Standardized coefficients of the measured physical properties in the regression model predicting responses against adjectives
The regression model for like-dislike containing the six subjective perceptions accounted for 95% of observed variance (R2=0.957, F(6,37)=115.568, p<0.0001). However, it was observed that only coefficients for slippery-sticky (b=0.66) and hard-soft (b=0.53) were significant (p<0.05) in the model.
Discussion
The following observations can be made regarding Table 1. For relationships between people’s responses to the textures against the pairs of words, the words smooth-rough and bumpy-flat were found to have very strong negative correlations; hard-soft and warm-cold were found to have a strong negative correlation; and wet-dry was found to be correlated with smooth-rough, and negatively correlated with slippery-sticky and bumpy-flat. It is perhaps surprising that no relationship was established for warm-cold and smooth-rough; others have found them to be correlated (Hollins et al., 2000). All of these correlations might show that perceptual properties influence one another. For example, the negative correlation between hard-soft and warm-cold, might indicate that a surface perceived as soft might also be more likely to be perceived as being warm and vice versa. Likewise, the positive correlation between smooth-rough and wet-dry might indicate that a surface perceived as rough will also probably be perceived as dry and vice versa; and a surface perceived as rough might also be perceived as bumpy and vice versa. Hollins et al. also found a strong correlation between smooth-rough and bumpy-flat. They speculated that smooth vs. flat, and rough vs. bumpy were treated as synonymous by the participants in their experiment.
For relationships between people’s preference and the perceptions of the six adjective pairs, it can be seen that participants’ ratings against like has positive correlations with sticky and soft. Other researches suggest that smooth surfaces are warm, and that people tend to prefer smooth surfaces over rough ones (Hollins et al. 2000).
For relationships between the responses and the physical measurements (Table 2), all six responses to pairs of adjectives were found to have significant correlations with more than two measurements:
- the perception of warm-cold was related to a surface’s thermal property and compliance;
- the perception of slippery-sticky was related to a surface’s friction coefficient and compliance;
- the perception of smooth-rough was related to a surface’s friction coefficient and roughness;
- the perception of hard-soft was related to a surface’s thermal property and compliance;
- the perception of bumpy-flat was related to a surface’s friction coefficient and roughness; and
- the perception of wet-dry was related to friction coefficient, roughness, and compliance.
These correlations perhaps demonstrate that touch perceptions have relationships with more than one physical property. As noted in the introduction and elsewhere by others (Hollins et al. 2000), some correlations between perceptual dimensions might be found because the correlations exist between the physical properties. For example, the roughness of a surface might affect the area of the surface in contact with the finger and consequently affect the rate of heat transfer. However, the only significant correlations between the physical measures found in this study are those between compliance, friction and cooling rate. These relationships might account for the correlations between slippery-sticky, warm-cold and the physical measurements. They cannot fully account for the perceptions of hard-soft, because friction is not a significant correlate; nor smooth-rough, because there is no correlation between roughness and friction. The perceptions of wet-dry cannot be accounted for by correlations between physical measures, because they also depend on roughness. It is possible that there are other physical parameters that are important of which we are unaware and have not measured.
The following observations are made about the relationships between the reported perceptions and the physical measurements. The regression model for warm-cold explained 59.5% of the variance in the regression model. This perception is therefore strongly related to how quickly the finger cools when it touches a material. A surface with a high thermal conductivity (at a lower temperature than the finger) is likely to be perceived as being cold. Three of the measured properties explained 55.7% of the variance for the perception of slippery-sticky: compliance, friction coefficient and roughness. Among them, compliance is the most important property. A highly compliant surface with a high friction coefficient is likely to be perceived as being sticky. Measured roughness explained 54.6% of variance for the perception of smooth-rough. A rough surface is, unsurprisingly, likely to be perceived as being rough. Three of the measured properties explained 94.4% of variation for the perception of hard-soft: rate of cooling, compliance and friction coefficient. Among them, compliance is the main property that affects a person’s perception of hard-soft. A highly compliant surface, with low friction coefficient and low rate of cooling is likely to be perceived as soft. The regression model for bumpy-flat explained 48.1% of the variance in the data and was found to depend on the measured value of roughness. A surface with high roughness value is likely to be perceived as being bumpy. Three of the measured properties explained 72% of variance for the perception of wet-dry: compliance, friction coefficient and roughness. Among them, compliance and friction coefficient are the two principal properties that affect a person’s perception of wet-dry. A surface with low compliance, low friction coefficient and high roughness is likely to be perceived as being dry.
There are at least two sources of numerical error in the measurement of people’s perception of tactile textures in this study. First, the semantic differential scale gives, at best, ordinal data, and the calculation of mean values is strictly not permissible (Stevens, 1946). In other words, the measurement scales are not necessarily linear. Secondly, the regression analysis assumes a linear relationship between the rating of perception and the measured stimulus, while it is accepted that these are more likely to be related by a power law. Thus the regression models might not capture some important relationships. Compared to these sources of error, it is unlikely that any small biases introduced by the use of an unconventional 20 point scale much affected the outcomes.
Nevertheless, the work reveals some interesting possible relationships that are worthy of further exploration. Of particular interest might be the perception of wet-dry, because no afferents in the finger respond directly to wetness. Future work should select textures with particular hypotheses in mind, in order to design rigorous factorial experiments or apply Taguchi orthogonal arrays. Such work will require the use of more rigorous psychophysical experimental techniques and further consideration of the extensive literature on multimodal interactions.
This approach has taken previous psychophysical research on touch perceptions a step forward by considering the combinations of surfaces’ physical properties in relation to a perception. The novelty of the work lies in the consideration of combinations of physical properties. Most previous work has approached subjective and objective relations on a one-to-one basis. In particular, this work included consideration of perceptions of warmth and wetness, which as yet have not been extensively considered in studies of perceptual dimensions. The regression models provide useful information for designing a material with specific perceptual properties. For example, Table 2 shows that the model of hard-soft is the best to predict the perception using the four measured properties (R2=0.94). The perception of softness will increase as a surface’s compliance increases and the thermal property decreases. The friction coefficient, which did not show significant correlation with hard-soft in Table 1, only plays a small role in affecting the perception of a surface’s hardness. The regression model of slippery-sticky shows that the perception was influenced by three measured properties: rate of cooling, compliance and friction coefficient. The regression model implies that the perception of softness of a surface can be increased, not only by using a compliant material, but by using a low friction surface with a low rate of cooling.
Comparing the correlation matrix (Table 1) and the regression models (Table 2), some strongly correlated items shown in Table 1 did not enter the regression models. For example, warm-cold was found to have a strong correlation with the rate of cooling and compliance, but only the thermal property entered the regression model. An explanation for this inconsistency is that if two independent variables are strongly correlated, it is likely that entering one variable into the model is sufficient to predict the results; by entering the other variable, the model will not be significantly improved. For warm-cold, a very strong correlation was found between it, compliance and rate of cooling, but only the rate of cooling was required for the predictive regression model.
The study reported in this paper is at an early stage of research to explore the relationships between perceptual properties and a surface’s physical properties, while the context of the study was limited to confectionery packaging. For this reason, the findings are difficult to generalize, and they do not necessarily apply to all tactile textures. A change of context might change the correlations between perceptions and measured physical properties. More experiments using a large variety of surface textures in different contexts need to be carried out to identify a stable pattern of relationships. In the introduction to this paper, it was hypothesized that people’s affective responses to tactile textures might depend on their combinations of perceptions of the surface. Should experiments exploring combinations of perceptual dimensions identify stable patterns of relationships, more work will be required to determine the relationships between those perceptions and affective responses.
Conclusions
A study was conducted on the touch perceptions of 37 tactile textures in the context of confectionery packaging. Eighteen participants touched the stimuli unseen and rated them against the words warm-cold, slippery-sticky, smooth-rough, hard-soft, bumpy-flat, and wet-dry. The surfaces’ roughness, compliance, friction, and the rate of cooling of an artificial finger when touching the surface were measured.
The aim was to explore the touch perceptions of tactile textures and identify their relationships with the surfaces’ physical properties. Results of a correlation analysis show that touch perception is often associated with more than one physical property. For example, ratings against the words warm-cold were found to depend on both the compliance and rate of cooling of the surface; and ratings against wet-dry depended on the friction coefficient, compliance and roughness of the surface. Regression models demonstrated the form and strength of the combined contributions of these surface properties to the perceptions. Results of a correlation analysis show that ratings against each pair of adjectives were related. For example, perceptions of warmth of a surface were related to perceptions of softness; and perceptions of dryness were related to perceptions of roughness, flatness and stickiness.
Whereas most previous work has approached subjective and objective touch relations on a one-to-one basis, this work has taken the study of touch perception a step forward by considering the combinations of surfaces’ physical properties in relation to a perception. In particular, this work included consideration of perceptions of warmth and wetness, which as yet have not been extensively considered in studies of perceptual dimensions.
This study is an essential step towards the understanding of relationships between a surface’s physical properties and consumer’s affective responses. This work aligns with industrial needs to be able to manufacture surfaces that would have desired affective impact on consumers.
Acknowledgments
This work was funded by the UK’s EPSRC (EP/D060079/1) and the EC (NEST043157). The views expressed here are the authors’ and not those of the EC. We thank Dr Diyar Akay for his assistance with the analysis of the data.
References
- Barnes, C. J., Childs, T. H. C., Henson, B., & Southee, C. H. (2004). Surface finish and touch – A case study in a new human factors tribology. Wear, 257(7-8), 740-750.
- Childs, T. H. C., & Henson, B. (2007). Human tactile perception of screen-printed surfaces: Self-report and contact mechanics experiments. Journal of Engineering Tribology, 221(3), 421-441.
- Desmet, P. (2007). Product emotion. In H. N. J. Schifferstein & P. Hekkert (Eds.), Product Experience- A multidisciplinary approach (pp. 379-397). Amsterdam: Elsevier Science.
- Ekman, G., Hosman, J., & Lindstrom, B. (1965). Roughness, smoothness, and preference: A study of quantitative relations in individual subjects. Journal of Experimental Psychology, 70(1), 18-26.
- Ernst, M. O., & Banks, M. S. (2002). Humans integrate visual and haptic information in a statistically optimal fashion. Nature, 415(6870), 429-433.
- Gescheider, G. A., Bolanowski, S. J., Greenfield, T. C., & Brunette, K. E. (2005). Perception of the tactile texture of raised-dot patterns: A multidimensional analysis. Somatosensory and Motor Research, 22(3), 127-140.
- Harper, R., & Stevens, S. S. (1964). Subjective hardness of compliant materials. Quarterly Journal of Experimental Psychology, 16(3), 204-215.
- Henson, B., Barnes, C. J., Livesey, R., Childs, T. H. C., & Ewart, K. (2006). Affective consumer requirements: A case study of moisturizer packaging. Concurrent Engineering Research and Applications, 14(3), 187-196.
- Hollins, M., & Bensmaia, S. J., (2007). The coding of roughness. Canadian Journal of Experimental Psychology, 61(3), 184-195.
- Hollins, M., Bensmaia, S., Karlof, K., & Young, F. (2000). Individual differences in perceptual space for tactile textures: Evidence from multidimensional scaling. Perception & Psychophysics, 62(8), 1534-1544.
- Hollins, M., Faldowski, R., Rao, S., & Young, F. (1993). Perceptual dimensions of tactile surface texture- A multidimensional-scaling analysis. Perception & Psychophysics, 54(6), 697-705.
- Hollins, M., Lorenz, F., Seeger, A., & Taylor, R.. (2005). Factors contributing to the integration of textural qualities: Evidence from virtual surfaces. Somatosensory and Motor Research, 22(3), 193-206
- Hu, J. Y., Hes, L., Li, Y., Yeung, K. W., & Yao, B. G. (2006). Fabric touch tester: Integrated evaluation of thermal mechanical sensory properties of polymeric materials. Polymer Testing, 25(8), 1081-1090.
- Kandel, E. R., Schwartz, T. M., & Jessell, T. M. (2000). Principles of neural science (4th ed.). New York: McGraw-Hill.
- Karana, E., Hekkert, P., & Kandachar, P. (2009). Meanings of materials through sensorial properties and manufacturing processes. Materials & Design, 30(7), 2778-2784.
- Kawabata, S. (1982). The development of the objective measurement of fabric handle. In S. Kawabata, R. Postle, & M. Niwa (Eds.), Objective specification of fabric quality, mechanical properties and performance (pp. 31-60). Osaka, Japan: Textile Machinery Society of Japan.
- Klatzky, R. L., & Lederman, S. J. (2002). Touch. In A. F. Healy & R. W. Proctor (Eds.), Experimental psychology (Chap. 6, pp. 147-176). New York: Wiley.
- Kringelbach, M. L., (2005). The human orbitofrontal cortex: Linking reward to hedonic experience. Nature Reviews Neuroscience, 6(9), 691-702.
- Lederman, S. J., & Klatzky, R. L. (Eds.). (2007). Special issue: New directions in touch. Canadian Journal of Experimental Psychology, 61(3), 169-275.
- Miller, G. A. (1956). The magical number seven, plus or minus two: Some limits of our capacity for processing information. Psychological Review, 63(2), 81-97.
- Nagamachi, M. (1995). Kansei engineering: A new ergonomic consumer-oriented technology for product development. International Journal of Industrial Ergonomics, 15(1), 3-11.
- Osgood, C. E., Suci, G. J., & Tannenbaum, P. H. (1957). The measurement of meaning. Urbana, IL: The University of Illinois Press.
- Schütte, S. (2005). Engineering emotional values in product design- Kansei engineering in development. Unpublished doctoral dissertation, Linkoping University, Linkoping, Sweden.
- Smith, A. M., Chapman, C. E., Deslandes, M., Langlais, J-S., & Thibodeau, M-P. (2002). Role of friction and tangential force variation in the subjective scaling of tactile roughness. Experimental Brain Research, 144(2), 211-223.
- Stevens, S. S. (1946). On the theory of scales of measurement. Science, 103(2684), 677-680.
- Strazdiene, E., Gutauskas, M. (2005). New method for the objective evaluation of textile hand. Fibres & Textiles in Eastern Europe, 13(2), 35-38.
- Tiest, W. M. B., & Kappers, A. M. L. (2006). Analysis of haptic perception of materials by multidimensional scaling and physical measurements of roughness and compressibility. Acta Psychologica, 121(1), 1-20.
Appendix
Appendix A. Participants' ratings of textures, and physical properties
Appendix B. Regression models for adjectives