Basic Semantics of Product Sounds
Elif Özcan * and René van Egmond
Delft University of Technology, Delft, The Netherlands
Product experience is a result of sensory and semantic experiences with product properties. In this paper, we focus on the semantic attributes of product sounds and explore the basic components for product sound related semantics using a semantic differential paradigm and factor analysis. With two experiments, we determined eight factors that underlie the semantic associations of product sounds (attention, roughness, smoothness, temporal constancy, (un)familiarity, unpleasantness, machinery, and power). Correlations of the results from both experiments indicate that perceptual factors (attention, roughness, smoothness, and temporal constancy) influence cognitive factors (power, machinery, and (un)familiarity) and emotional factors (unpleasantness).This finding suggests a hierarchical structure in the meaningful associations of product sounds. Furthermore, we have shown that product sound related semantics is sound type dependent.
Keywords – Product Sounds, Semantics, Sound Design, Psychoacoustics, Pleasantness, Emotion.
Relevance to Design Practice – Product sound design (PSD) is an emerging topic within the field of product development. New insights into the PSD related theory are needed to support this emerging field.
Citation: Özcan, E., & van Egmond, R. (2012). Basic semantics of product sounds. International Journal of Design, 6(2), 41-54.
Received January 27, 2011; Accepted May 26, 2012; Published August 31, 2012.
Copyright: © 2012 Özcan & van Egmond. Copyright for this article is retained by the authors, with first publication rights granted to the International Journal of Design. All journal content, except where otherwise noted, is licensed under a Creative Commons Attribution-NonCommercial-NoDerivs 2.5 License. By virtue of their appearance in this open-access journal, articles are free to use, with proper attribution, in educational and other non-commercial settings.
*Corresponding Author:e.ozcan@tudelft.nl.
Elif Özcan is an assistant professor at the Faculty of Industrial Design Engineering of Delft University of Technology. She holds a PhD (cum laude) on Product Sounds: Fundamentals & Application. Her main research interests include the perceptual and cognitive processes of product experience and the semantic associations occurring during human-product interaction. Her latest studies concern the effect of sound on affective responses towards products. Some of her key publications can be found at Acta Psychologica (2007 and 2009) and Journal of the Audio Engineering Society (2011). She is a member of the Product Sound Design Group at her current affiliation.
René van Egmond, PhD, is an associate professor at the Faculty of Industrial Design Engineering, Delft University of Technology, specializing in perception and the design of the sound of industrial products. He has a background in (psycho)-acoustics, experimental psychology, music theory, and music psychology. He leads the Product Sound Design Group at his current affiliation.
Introduction
Products, with all their sensory properties, evoke certain sensations that lead to a particular product experience. For example, a red sports car with its aerodynamic shape, soft leather seats, firm steering wheel, and roaring engine could cause high arousal and therefore can be experienced as thrilling, sophisticated, and/or sportive. Such experiences influence users’ reasoning, emotional state, purchasing decisions, preference, and expectations with respect to the product (Schifferstein & Hekkert, 2008). Consequently, products become “meaningful” entities for users. Meaning attribution is often studied within the context of product semantics. Designers and design researchers have been developing methods and theories to understand the underlying processes of product semantics (Demirbilek & Sener, 2003; Lin, Lin, & Wong, 1996; Petiot & Yannou, 2004; Schifferstein & Hekkert, 2008; van Rompay, 2008). Although product semantics basically concern the formal qualities of all product properties, semantics of the auditory property of products (i.e., product sounds) have not been well studied. With this study, we aim to explore and understand the basic components for product sound related semantics.
In this paper, we consider product sounds as sounds produced by domestic appliances when they are performing a function. Such sounds can be “consequentially” or “intentionally” produced by products (van Egmond, 2008). Consequential sounds refer to the sounds that are electrically or manually produced as a consequence of a function. For example, hairdryers, shavers, and epilators automatically produce engine sounds when they are turned on, or the door of a washing machine produces an impact sound when opened/closed. Intentional sounds are sounds that are deliberately designed and added to a product by designers, many of which are digitally synthesized sounds. For example, microwave ovens ring when the food is ready, or washing machines produce a warning beep when the washing cycle has finished.
There is evidence that the auditory property of a product has a semantic impact on product experience (Blauert & Jekosch, 1997; Spence & Zampini, 2006). However, product sound design related semantics is not well established because fundamental knowledge on the meaningful associations of product sounds has not been thoroughly studied. Existing sound design related studies are often case-based and tackle one type of product and its acoustic challenges (Lageat, Czellar, & Laurant, 2003; Susini, McAdams, Winsberg, Perry, Vieillard, & Rodet, 2004; van Egmond, 2008; Västfjäll, Kleiner, & Gärling, 2003). Studies specifically concerning the semantic attributes of product sounds are also limited by the requirements of certain manufacturers (e.g., Lageat, et al., 2003; Letens, 2000; van Egmond, 2008; Zeitler, Ellermeier, & Fastl, 2004). Therefore, existing literature does not provide an overall view on meaning attribution to product sounds and its consequences as semantic attributes. With such knowledge, however, designers could have a systematic way of listing semantic attributes that they could use during user evaluations of a product sound.
Studies concerning cognitive science suggest that semantic associations derive from sensorial and cognitive processing of an object. Any interaction with an object evokes concepts, which (in cognitive terms) connect the sensory representation of an object to semantic knowledge making the object “meaningful” (Barsalou, 1999; Murphy, 2002; Paivio, 1991). Thus, seeing, hearing, touching a product activates a bundle of semantic associations that are at the disposal of a user to be able to further elaborate on his/her experience with the product. Furthermore, in addition to sensory, conceptual, and semantic representation of objects, there is one more mental representation that is essential for the economy of the cognitive processing, i.e., lexical representation. Lexical representation is a specific type of semantic attribute that can solely represent a concept with as a few words as possible. For example, when one identifies a product as a sports car, car as a lexical representation defines what the product is, and sports additionally specifies the most salient feature of that product. Lexical representation of a sound is often determined by the sound source and action causing the sound (e.g., car passing) (see Fabiani, Kazmerski, Cycowicz, & Friedman, 1996; Gaver, 1993; Marcell, Borella, Greene, Kerr, & Rogers, 2000; Vanderveer, 1979).
Semantic associations of sounds are activated earlier than their lexical associations (Cummings, Ceponiene, Koyama, Saygin, Townsend, & Dick, 2006; McCauley, Parmelee, Sperber, & Carr, 1980; see also Cleary, 2002). In other words, people are able to verbalize their auditory percept before a complete identification occurs. Moreover, if people fail to identify or access any lexical representations, they are still able to verbalize the psycho-acoustical and structural properties of the sounds (Vanderveer, 1979). Fabiani et al. (1996) have categorized semantic and lexical representations of environmental sounds as not-known (e.g., noise), sound imitation (e.g., too-too-too), sound description (e.g., high-pitched), name or compound name (e.g., bird, water drain bubbles).
Synthesized sounds also elicit semantic associations (Björk, 1985; Edworthy, Hellier, & Hards, 1995; Kendall & Carterette, 1993; Solomon, 1958; von Bismarck, 1974). These meaningful associations refer to abstract concepts (e.g., controlled, dangerous, steady, urgent, etc.), sensory judgments (e.g., unpleasant, obtrusive), and/or psychoacoustic character of the sound (e.g., sharp, high, loud). Changes in the acoustic dimensions (e.g., pitch, speed, inharmonicity, and rhythm) influence the perceived meaning of a synthesized sound.
Zwicker & Fastl (1990) suggest that people’s psychoacoustic experiences with sounds result in sensory (un)pleasantness. According to their psychoacoustics and sensory pleasantness model, listeners experience sounds as less pleasant when the psychoacoustic experience of sounds gets sharper, rougher, louder, and noisier. For product sounds, listeners may be experiencing unpleasantness as psychoacoustic judgments indicate high ratings of roughness, sharpness, and loudness. Bisping (1997), using machinery sounds such as car sounds, suggested that two perceptual factors, i.e., power and pleasantness, characterized car interior sound quality. According to Bisping, loudness, as well as low frequencies, is an indication for power perception: as the loudness of the sound increased the power perception also increased, while the pleasantness perception, however, decreased. Västfjäll et al. (2003) has investigated the pleasantness-powerfulness perceptions via the activation (arousal/powerfulness) and valence (pleasantness) dimensions as proposed by Mehrabian and Russell’s (1974) theory of human affective experience. They concluded that sharpness of the sound related to the activation dimension whereas loudness and roughness related more to valence.
In product functioning, sound plays an important role in the power judgment of a product, because the loudness of the sound indicates the amount of energy necessary to operate a product. For example, a jet engine is more powerful than a car engine and the sound emitted by a jet engine is expected to be louder than the sound of a car engine. Therefore, power perception elicited by product sounds can also have a semantic impact on the sound source. That is, power judgment may be a cognitive judgment on the product quality (e.g., this is a weak shaver or this is a powerful vacuum cleaner).
Furthermore, the studies regarding pleasantness and power perception imply that psychoacoustic judgments may be underlying the emotional responses to product sounds and cognitive associations of them. That is to say that semantic associations may also be layered, and psychoacoustic judgments resulting from the perceptual analysis of the sound may be indicative of higher-level semantic associations. For example, a roaring sound of a Harley Davidson motorbike may be perceived as loud and rough (psychoacoustic), which may cause high arousal and pleasantness (emotional) and therefore is experienced as powerful and adventurous (cognitive).
Product Sounds
The domain of product sounds has been defined in the earlier studies of the present authors (Özcan, 2008; Özcan & van Egmond, 2005). Figure 1 summarizes the domain of product sounds with product sound categories and underlying acoustical variables (refer to Appendix 1 for the names and the acoustical content of the sounds). According to the figure, six perceptually relevant product sound categories constitute the domain of product sounds. These categories are air, alarm, cyclic, impact, liquid, and mechanical sounds. As shown, the acoustical content of product sounds is explained by two dimensions: sharpness & loudness and noisiness & low frequencies. Each product sound category has distinct acoustical constitution.
The aforementioned studies have also indicated that product sounds are able to activate a network of conceptual associations. This network consists of basic concepts such as action, emotion, location, abstract meaning, onomatopoeia, psychoacoustics, sound type, source, and temporal properties. Thus, when users experience a product sound, a variety of concepts can be activated and, if necessary, the most salient concepts are verbally described. The occurring descriptions would be in the form of semantic attributes. For example, a product sound could be described as washing machine, washing machine spinning, bathroom, sharp and loud, liquid, pleasant, cyclic and continuous, and hygienic. The source and action descriptions of product sounds seem to occur the most. Onomatopoeias and psychoacoustic descriptions also occur frequently depending on whether a product sound is identified with its source (e.g., a shaver, a toothbrush). If the source information is not available, then the spectral-temporal description of the sound becomes salient. Furthermore, the activated conceptual network depends on the type of product sound. For example, air sounds (e.g., hairdryers, vacuum cleaners) activate mostly source and location related information, whereas alarm sounds (e.g., alarm clocks, microwave finish signals) activate mostly abstract associations (e.g., wake-up call, food is ready) and emotions.
The basic concepts cover categories of semantic knowledge in a broad way and imply the type of semantic attributes that can be used to describe product sounds. However, these concepts do not indicate any basic semantic associations that can describe product sounds. It is interesting to discover what common semantic attributes are used for product sounds in general. For example, can the words bathroom, sharp, continuous, or mechanical describe all kinds of product sounds? Moreover, what are the underlying factors for the basic semantic associations of product sounds?
This Study
The main objective of this study is to explore the basics and the underlying factors of the semantic associations of product sounds. We conducted two experiments. In Experiment 1, we investigated the semantic associations of individual product sounds, and in Experiment 2 we investigated the semantic associations of product sound categories as a whole. We were interested to find whether there would be differences in the level of semantic associations evoked by individual sounds and sounds presented as a category. Categories in general may evoke higher-level associations that tend to describe all the members (because categories represent several members a whole) whereas an individual sound may evoke associations specific to the item presented.
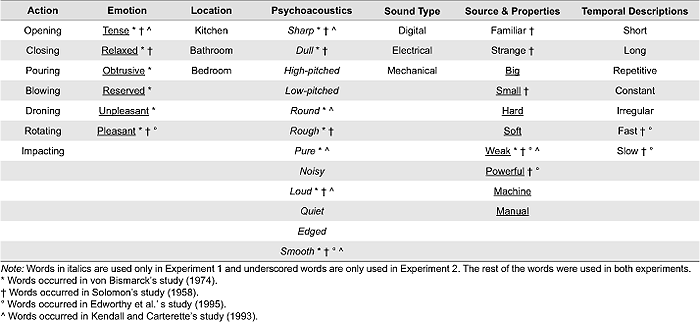
Product sound categories presented in Figure 1 were used as the bases for the experiments. Thus, the semantic associations of product sounds were studied within the context of six perceptually relevant product sound categories (air, alarm, cyclic, impact, liquid, and mechanical). In total, 48 attributes were selected from the aforementioned literature, or from the sound descriptions that occurred in an earlier study (Özcan & van Egmond, 2005). These attributes are categorized into seven groups: action, emotion, location, psychoacoustics, sound type, source & properties, and temporal descriptions (see Table 1).
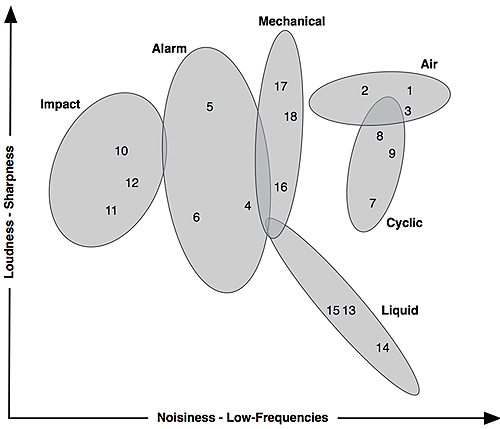
Figure 1. The domain of products sounds with product sound categories and underlying acoustical dimensions.
Numbers correspond to sound names in Appendix 1 (inspired by Özcan, 2008).
Table 1. Selected attributes and product sound related basic concepts (Experiments 1 and 2).
Experiments 1 and 2 also differed in the attribute selection. In Experiment 1 with individual sounds, the main focus was on psychoacoustic attributes. Because in Experiment 2 sounds were presented as a group, psychoacoustic attributes would not be applicable. In Experiment 2 with sound sequences (i.e., sound sequences represented a group of sounds from a sound category) the main focus was on concepts of a higher level than psychoacoustic descriptions. Thus, attributes associated to pleasantness (pleasant, obtrusive, etc.) and power perception (powerful, weak, machine, etc.) were used. The selected attributes can be found under the sound related concepts emotion and source properties in Table 1. In total, 34 attributes were used in Experiment 1, and 36 attributes were used in Experiment 2.
In this study we were also interested to discover basic attributes that are appropriate to describe all types of product sounds. We presented participants a large list of words and had them decide by a rating task which words would be used the most. Therefore, participants’ ratings were analyzed to eliminate the inappropriate words and bring out the appropriate ones. However, the eliminated ones could also be used to see what not to use for certain product sounds.
Experiment 1
Method
Participants
Thirty-six students of the Delft University of Technology participated. The average age of the participants was 23.3 years. All participants reported normal hearing. Students were paid a small fee for their participation.
Stimuli
Three sounds were selected to represent the six perceptual product sound categories. Thus, in total 18 product sounds were selected. The sounds had a maximum duration of 5 seconds and were presented at a similar comfortable listening level. A list of the sounds can be found in Appendix. The sound files can be listened to using the following link: (http://soundcloud.com/semantics_product-sounds).
Rating Attributes
Thirty-four descriptive words were selected as semantic attributes to be rated in Experiment 1 (see Table 1). These words reflected the basic concepts of action, location, psychoacoustics, sound type, source properties, and temporal descriptions. Within the “source properties” only the words “familiar” and “strange” were used. These attributes replaced the exact sound sources and referred to participants’ familiarity with the sound sources. The words were translated from English into Dutch.
Apparatus
The stimuli and the descriptive words (attributes) were presented using a specially designed application developed using the Trolltech Qt (Mac OS X - free edition) tool kit. The application ran on a Macintosh Powerbook G4 1.33 GHz computer with 12” screen. The stimuli were presented through AKG Studio Monitor K240DF 2x600Ohm headphones. The experiment took place in a quiet room.
Procedure
A participant’s task was to rate the presented product sound for each attribute on a 7-point unipolar scale (‘1’ representing “weak” and ‘7’ representing “strong” association) or a participant could indicate “non-applicable” (N/A). The latter choice indicated that there was absolutely no semantic association between the attribute and the corresponding sound. The instructions were presented prior to the experiment. First, a participant took a practice trial with two animal sounds and three attributes that were not used in the study. Participants were encouraged to listen to each sound more than once during the rating task. Following the practice trial, a participant started the real experimental session. The presentation order of the stimuli and of the attributes was randomized for each participant.
Results
Data were analyzed in three phases: elimination of non-applicable rating attributes, factor analysis, and reliability tests on the descriptive word of each extracted factor.
Elimination of Attributes
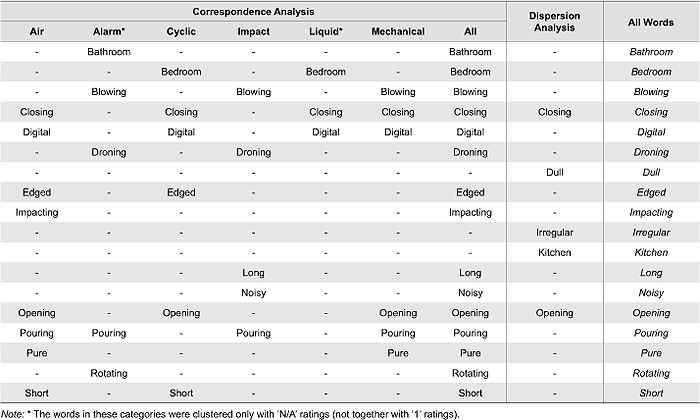
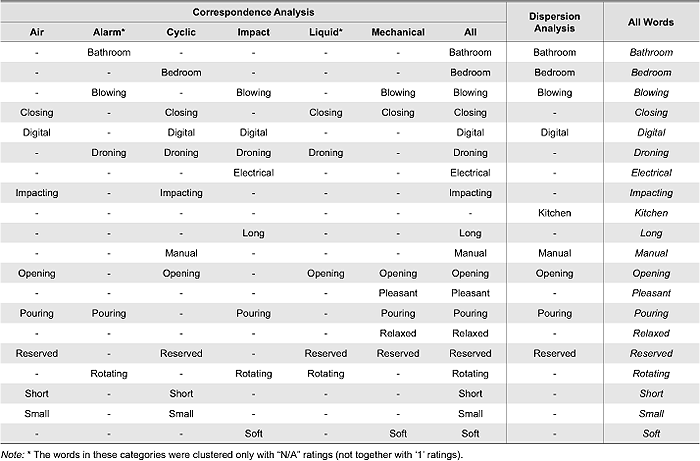
Elimination of the attributes was performed in three stages (See Figure 2 for an overview of the methods used). Table 2 presents the eliminated words as a function of analysis methods by which the inappropriate words were determined (i.e., correspondence analysis and dispersion analysis). The last column (All Words) indicates the total number of words (18) that were excluded for further analysis.

Figure 2. An overview of the steps taken in three stages of attribute elimination.
Table 2. Eliminated attributes for each product sound category in each analysis (Experiment 1).
In the first stage, participants that often rated ‘N/A’ were determined. On average, in 8% of the cases, a participant rated ‘N/A’. Two participants with ‘N/A’ rating frequencies of 44% and 53% were excluded from further analysis.
Following this, for each product sound category, the words that were associated most frequently with N/A ratings were determined in the second stage. A correspondence analysis on the frequency data of word-rating combination was performed and followed by a hierarchical cluster analysis (Ward’s method) on the coordinates stemming from the correspondence analysis. For four out of the six sound categories (air, cyclic, impact, and mechanical), cluster analysis yielded a cluster of words that were associated with N/A and ‘1’. For the other two sound categories (alarm and liquid), cluster analysis yielded a cluster of words that were associated with N/A only. In the second stage, 15 words in total were eliminated.
In the third stage, it was then determined if the attributes differentiated over sounds, and if participants agreed. A measure of dispersion for the sounds was determined by taking the mean over participants for each attribute and sound, and then the variance was calculated over sounds for each attribute. This variance indicated if attributes differentiated between sounds. Another measure of dispersion was determined by taking the mean over sounds for each attribute and each participant, and then the variance was calculated over participants for each attribute. This variance indicated how well participants agreed. Thus, each word (e.g., attribute) was associated with two variances (i.e., dispersion measures). A hierarchical cluster analysis (Ward’s method, on the standardized data) was conducted with the two dispersion measures as input. What resulted was a cluster containing five words having a low agreement and a high differentiation measure. Two of these descriptive words had already been determined as an inappropriate word in the second stage. Thus, only three words (i.e., dull, irregular, and kitchen) were eliminated in this phase. In total, 18 words were eliminated for Experiment 1.
Factor Analysis
The ratings were analyzed using the method of principal components analysis with Varimax rotation. For the analysis, “N/A” ratings were replaced by the mean values taken over participants and sounds for each attribute. Five factors explained 60% of the variance. We measured the sampling adequacy by KMO (Kaiser-Meyer-Olkin Measure) at 0.76, which is higher than the necessary 0.5. Furthermore, Bartlett’s test of sphericity was significant (x2(190) = 3001.26, p<.001), which means the correlation matrix is not an identity matrix, indicating that the factor model is appropriate. A reliability analysis using Cronbach’s alpha model was conducted in order to check the internal consistency of the descriptive words in a factor. The Cronbach’s alpha values of each factor are presented in Table 3. These values ranged from .78 to .39. The factors, the attributes, and the explained variance are presented in Table 3. The factors are interpreted in the following.
Table 3. Attributes, factor loadings for a five-factor solution,
percentages of variance explained, and Cronbach’s Alpha for the attributes (Experiment 1).
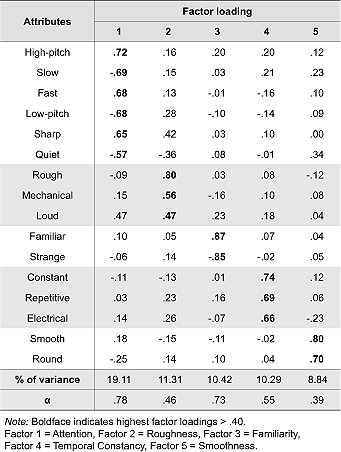
On Factor 1, words high-pitch, fast, and sharp positively loaded high, while words slow, low-pitch, and quiet negatively loaded high. These words describe the attention value of the product sounds. Therefore, Factor 1 was interpreted as Attention. On Factor 2, words rough, mechanic, and loud loaded high. Words describing the psychoacoustic characteristics of machinery sounds loaded on this factor. Therefore, Factor 2 was interpreted as Roughness. On Factor 3, the word familiar positively loaded, and word strange negatively loaded high. These words indicate the familiarity of listeners with sound sources. Therefore, Factor 3 was interpreted as Familiarity. On Factor 4, words constant, repetitive, and electrical positively loaded high. Words describing the temporal character of electrical sounds loaded on this factor. Therefore, Factor 4 was interpreted as Temporal Constancy. On Factor 5, words smooth and round positively loaded high. Therefore, Factor 5 was interpreted as Smoothness.
The mean of the regression weights of the factor scores was determined over participants for each sound category. In Figure 3, the sound categories are presented in three spaces for the five averaged regression weights. In order to prevent abundance of data presentation, we have chosen to present only three combinations of factor dimensions. According to the figures, air sounds are positioned the highest on the Temporal Constancy factor and rather low on the Familiarity factor. Alarm sounds are positioned the highest on the Attention and the Familiarity factors, are relatively high on the Temporal Constancy factor. Cyclic sounds are positioned the lowest on the Attention factor and relatively high on the Smoothness and Temporal Constancy factor. Impact sounds are positioned the lowest on the Temporal Constancy, Familiarity, and Smoothness factors. Liquid sounds are positioned the highest on the Smoothness and the lowest on the Roughness factors. In addition, they are positioned relatively low on the Attention and high on the Familiarity factors. Mechanical sounds are positioned the highest on the Roughness. In addition, these sounds are positioned relatively high on the Attention and relatively low on the Smoothness factors.
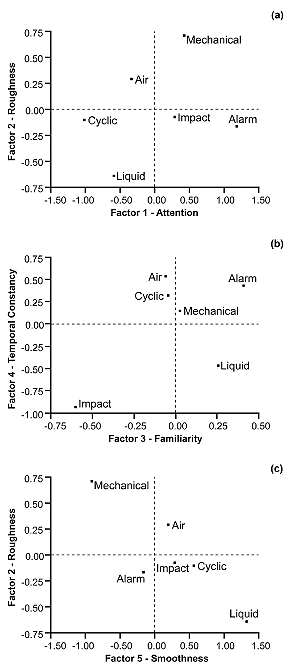
Figure 3. Product sound categories presented as a function of (a) Factor 1 - Attention and Factor 2 - Roughness;
(b) Factor 3 - Familiarity and Factor 4 - Temporal Constancy; (c) Factor 2 - Roughness and Factor 5 - Smoothness.
Discussion
The factor analysis of the rating attributes resulted in five factors that categorize the semantic associations of product sounds. These factors are Attention, Roughness, Familiarity, Temporal Constancy, and Smoothness. Three out of five factors (Attention, Roughness and Smoothness) relate to the psychoacoustic character of product sounds and, as such, relate to perceptual judgments. For the Attention factor, perceptual judgments on a sound may result in basic emotional responses (van Egmond, 2004) that may determine the attentive value of a sound. Therefore, listeners respond to some sounds more attentively than others (e.g., compare an alarm clock sound and a kitchen hood sound). The Roughness factor mainly refers to machinery products. The Smoothness factor indicates that the sound categories seem to be clustered by the material composition of the sound source. Roughness and Smoothness factors seem to be the opposites of each other. Machinery sounds are described rougher than aero- and hydro-dynamic sounds. Thus, these factors imply that auditory roughness / smoothness may be a consequence of material roughness / smoothness.
The Temporal Constancy factor is a good indicator whether a sound is produced manually or electrically. Sounds produced by electrical devices (air, cyclic, machine, alarm sounds) are described as repetitive and constant. Sounds produced by users’ actions are often not that regular (liquid and impact sounds). Familiarity with the product sounds may yield successful sound identification. Alarm sounds appear to be the most familiar sounds, and impact sounds appear to be the least familiar. The remaining categories are not distinguished by familiarity. This may indicate that sounds that have a distinct spectral-temporal structure (i.e., alarm sounds) are identified easier than sounds that are short and noisy (i.e., impact sounds). Previous experimental studies support the occurrence of these factors and that temporal structure of the product sounds has direct influence on auditory memory and indirect influence on sound source identifiability (Özcan & van Egmond, 2007).
In general, listeners find the spectral and temporal descriptors suitable for product sounds from all categories, but at the same time judge their familiarity with the sounds. This finding indicates that not only perceptual judgments but also judgments on the source of the sound become important when describing product sounds. Furthermore, the strength of a semantic association and a sound depends on the sound type.
Experiment 2
Power and Pleasantness perceptions may also be relevant to the product sound domain. The high-occurrence of psychoacoustic description of product sounds may imply that product sounds elicit sensory responses and therefore can be experienced on an emotional level. Furthermore, if product sounds are related to machinery objects that are electrically powered, it is possible that power judgment is present for product sounds. Therefore, in Experiment 2 we further investigated whether power and pleasantness perceptions as higher-level associations underlie the semantic associations elicited by product sound categories.
Method
Participants
Thirty-three students of the Delft University of Technology participated. The average age of the participants was 21.5 years. All participants reported normal hearing. Students were paid a small fee for their participation.
Stimuli
Six sound sequences were created to represent one of the six perceptual product sound categories (air, alarm, cyclic, impact, liquid, mechanical). For each category, three sounds from Experiment 1 were selected to create the sound sequences. The sound sequences had a maximum duration of 15 seconds (maximum 5 seconds for each sound) and were presented at a similar comfortable listening level. The sound files can be listened to using the following link: (http://soundcloud.com/semantics_product-sounds).
Rating Attributes
Thirty-six descriptive words were selected as semantic attributes to be rated in Experiment 2 (see Table 1). These words reflected the basic concepts of action, location, emotions, sound type, source & properties, and temporal descriptions. A set of words that referred to the concept of emotion was added. Within source & properties, in addition to the words familiar and strange another set of words were used to describe the power perception. The words were translated from English to Dutch.
Apparatus & Procedure
The set-up of the experiment and the procedure was identical to Experiment 1.
Results
Data were analyzed identically as in Experiment 1 in three phases. The method and order of analysis in each stage were identical to that in Experiment 1.
Elimination of Attributes
Elimination of the attributes (see Figure 2) was performed in three stages on the product sound categories (i.e., sound sequences). Table 4 presents the inappropriate words as a function of product sound categories and methods of analysis. The last column (All Words) indicates the total amount of words (20) that were excluded for further analysis.
Table 4. Eliminated attributes for each product sound stream in each analysis (Experiment 2).
First, two participants with “N/A” rating frequencies of 52% and 62% respectively were excluded from further analysis (in 10% of the cases participants rated “N/A”). Second, the correspondence analysis resulted in 19 words inappropriate to describe product sounds as a category (i.e., sound sequences). Third, a dispersion analysis resulted in a cluster containing nine words. Eight of these descriptive words had already been determined inappropriate in the second stage. Thus, only one word, kitchen, was eliminated in this phase. In total, 20 words were eliminated for Experiment 2.
Factor Analysis
Principal components analysis with Varimax rotation resulted in five factors that explained 67% of the variance. The KMO value was 0.76. Furthermore, Bartlett’s test of sphericity was significant (x2(120) = 1065.59, p<.001). The Cronbach’s alpha values of the reliability test for each factor ranged from .85 to .42. Factor 4 had a high alpha value (.70). The words loaded on this factor also had very high communalities (familiar: -.85, strange: .84) indicating a strong consistency within the factor. The factors, the attributes, and the explained variance are presented in Table 5. Factor interpretation is presented in the following.
Table 5. Attributes, factor loadings for a five-factor solution,
percentages of variance explained, and Cronbach’s alpha for the attributes (Experiment 2).
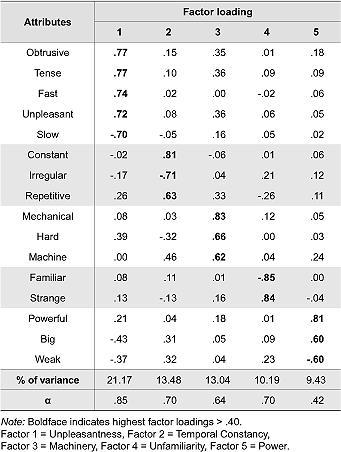
On Factor 1, words unpleasant, obtrusive, tense, and fast positively loaded high and the word slow negatively loaded high. These words are related to negative emotions and the operation speed of the product. Therefore, Factor 1 was interpreted as Unpleasantness. On Factor 2, words constant and repetitive loaded positively high, and the word irregular loaded negatively high. Therefore, Factor 2 was interpreted as Temporal Constancy. On Factor 3, words mechanic, hard, and machine loaded positively high. Therefore, Factor 3 was interpreted as Machinery. On Factor 4, the word strange loaded positively high, and the word familiar loaded negatively high. Therefore, Factor 4 was interpreted as Unfamiliarity. On Factor 5, words powerful and big loaded positively high, and the word weak loaded negatively high. These words indicate the power that is employed to operate a product. Therefore, Factor 5 was interpreted as Power.
In Figure 4, the sound sequences are presented in three factor spaces resulting from the regression weights. According to the figures, air sounds are positioned the highest on the Temporal Constancy factor and rather high on the Power factor. Alarm sounds are positioned the highest on the Unpleasantness factor and the lowest on Unfamiliarity factor. Cyclic sounds are positioned the highest on the Power factor and the lowest on the Unpleasantness factor. Impact sounds are positioned the lowest on the Temporal Constancy and rather high on the Unfamiliarity factor. Liquid sounds are positioned the lowest on both the Power factor and Machinery factor. Mechanical sounds are positioned the highest on both the Mechanical and the Unfamiliarity factors, and rather high on the Unpleasantness factor.
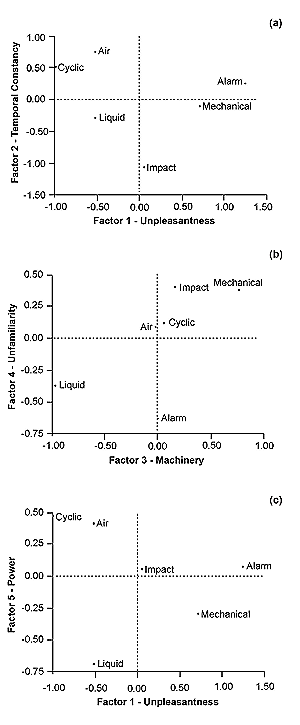
Figure 4. Product sound sequences presented as a function of (a) Factor 1- Unpleasantness and Factor 2 - Temporal Constancy; (b) Factor 3 - Machinery and Factor 4 - Unfamiliarity; (c) Factor 1 - Unpleasantness and Factor 5 - Power.
Comparison of the Factors of Experiment 1 and Experiment 2
Because the same sounds were used in both experiments, and because both experiments contained common attributes—except the emotion descriptions that were used for pleasantness perception instead of psychoacoustics, and some sound source property descriptions for power perception—we were able to compare the factors that occurred in these two studies. The mean of the regression weights for each product sound category of both studies were calculated and correlated with each other. Table 6 presents the correlations of the each factor weights from two studies. Below, only the significantly correlated results are presented.
Table 6. Correlation matrix of regression weights from factor analysis of Experiments 1 and 2.
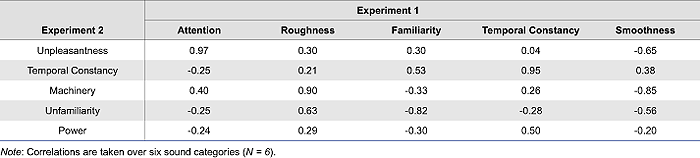
The Attention factor of Experiment 1 and Unpleasantness factor of Experiment 2 exhibited a strong and negative correlation. The Smoothness factor of Experiment 1 was negatively correlated with the Machinery factor of Experiment 2. The Roughness factor of Experiment 1 was positively correlated with the Machinery factor of Experiment 2. Another high and negative correlation was observed for the (Un)Familiarity factor of both experiments. Temporal Constancy factors of both experiments were also highly correlated. Although not significant, the Power factor of Experiment 2 was positively correlated with the Temporal Constancy factor of Experiment 1; the Unfamiliarity factor of Experiment 2 was positively correlated with the Roughness of Experiment 1 and negatively correlated with Smoothness of Experiment 1.
Discussion
In this experiment, we explored the basic factors that determine the semantics of product sounds presented as a category. The factor analysis of the rating attributes resulted in five factors. These factors are Unpleasantness, Temporal Constancy, Machinery, Unfamiliarity, and Power. In line with the product sound related literature (Bisping, 1997; Västfjäll et al., 2003), pleasantness and power factors have been salient factors in determining the basic semantics of product sound categories.
Furthermore, the results show that product sound related semantics is sound type dependent. Although the occurring factors represent all sounds from different sound categories, not all factors relate to a sound category to the same degree. For example, while alarm sounds have connotations of unpleasant emotions, cyclic sounds have connotations of pleasant emotions. Additionally, impact sounds do not relate to emotions to the same degree as alarm and cyclic sounds do. For the field of design, this implies that the extent to which semantic associations are evoked by product sounds should be studied in relation to the type of sound. This finding also opens new avenues for research that tackles the semantic associations of one sound category only.
The occurrence of the Power factor in the current study implies that sound can also be used as an indicator for assessing the working capacity of a domestic appliance. Sound can be one aspect of a product that users rely on for power judgment. Bisping (1997) and Västfjäll et al. (2003) suggested that loudness is a good indicator for power judgments for the automotive industry. Loudness perception is evoked by sound intensity that is, in physical terms, determined by the energy released during sound propagation. Furthermore, people can judge not only the working capacity but also the size of the product. The attribute big loaded on this factor and, similarly, cyclic sounds, which include the biggest domestic products (e.g., washing machines, dishwashers) within the product sound domain, were described best with this factor.
Özcan (2008) provided evidence that product sounds evoke emotional responses. However, it was not clear what type of emotions could be elicited by product sounds. With the current study, we have shown that product sounds can elicit both positive and negative emotions depending on the type of the product sound. Alarm and mechanical sounds are found the most unpleasant, and cyclic. air, and liquid sounds are found the most pleasant. Comparing these findings with Experiment 1, we find that the same sound types, alarm and mechanical, were best described by semantic attributes such as high-pitch, sharp, and fast in the Attention factor. Thus, in line with Zwicker and Fastl’s theory (1990), sharpness plays an important role in sensory pleasantness of a product sound, and it can be used as a good predictor for emotional judgments. Furthermore, it seems that the speed of sound propagation also influences the pleasantness perception, as the semantic attribute fast has occurred both in the Unpleasantness factor of Experiment 2 and in the Attention factor of Experiment 1. This may be an essential design element for especially alarm sounds, if they need to be designed to draw attention by causing sensory unpleasantness.
Furthermore, in addition to sharpness and loudness, as psychoacoustic attributes, roughness also influences people’s semantic decision on product sounds. The results show that roughness of the sound could be used to judge whether the sound belongs to a machinery product that produces mechanical sounds (e.g., shavers, epilators, electric toothbrushes). This factor does not characterize liquid and air sounds.
Among the five factors, two factors remained the same in comparison to Experiment 1: (Un)Familiarity and Temporal Constancy. Except the Power factor, the remaining factors seem to represent only higher-level concepts. The Roughness factor transformed into the Machinery factor, and the Attention factor transformed into the Unpleasantness factor. Thus, comparing the results of both studies allowed us to understand different levels of product semantics.
Conclusions
We can conclude that determining mere psychoacoustic judgments on product sounds is not enough to understand the semantic associations of product sounds. Psychoacoustic judgments are a first level reaction to a perceived product sound. Sound descriptions such as sharp or loud primarily refer to the auditory properties of the sound but do not necessarily refer to the semantics of user experience. This study showed that psychoacoustic responses precede emotional responses and power judgments. For example, if a shaver sound is perceived too sharp, a designer can expect that the shaver sound will be experienced as unpleasant; or if a vacuum cleaner needs to be experienced as powerful, a designer can first check whether the vacuum cleaner sound is perceived loud enough. Accordingly, our results suggest a hierarchical structure in the meaningful associations of product sounds, psychoacoustic responses being at the bottom level of semantic associations followed by either an emotional or a cognitive judgment (see Figure 5 for a summary).
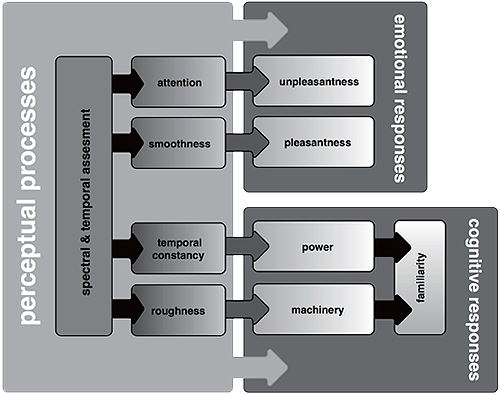
Figure 5. Hierarchical structure of the product sound related semantics presented as a function of
perceptual, emotional, and cognitive processing.
This conclusion also supports Spence and Zampini’s (2006) suggestion that product sounds have a semantic impact on product judgment and further explains what kind of semantic network a product sound will activate. Knowledge about such semantic networks can be useful in various ways in a design project. Designers intend to design a product expression (i.e., product character) that fits the company values or marketing strategies (e.g., feminine hairdryer, sporty shaver; powerful vacuum cleaner). Consequently, users are expected to perceive the character of the products (e.g., femininity, sportiveness, or powerfulness). The extent to which designers are able to design, and users are able to perceive, these expressions can be understood with the help of semantic analysis and the relevance of the semantic analysis to the physical product properties. Auditory property of a product is no exception. With the knowledge provided in this paper, (sound) designers can begin to imagine a semantic network for product sounds and link psychoacoustic, emotional, and cognitive judgments in a structured way.
From the methodological perspective, the authors realize that the selected set of semantic attributes play an important role in the way the factors are formed. However, the attribute elimination process allowed us to determine only the best descriptive semantic attributes. The remaining most effective attributes reflected participants’ preference to describe product sounds as they are. For example, if power related attributes were not found appropriate, they would have disappeared in the elimination process. Similarly, some attributes were found to be robust in both studies, and (un)familiarity and temporal descriptions occurred to be salient factors.
Interestingly none of the action and location descriptions have been found appropriate to describe product sounds. This does not mean that listeners are unable to identify the action that causes the sound or the location in which it occurs. Literature (e.g., Gaver, 1993) suggests a strong relation between a sound and its cause (i.e., a source in action) and listeners are able to identify the action (Marcell et al., 2000). Similarly, in an earlier study Özcan and van Egmond (2009) found that an ambiguous product sound is identified more accurately within a specific context (i.e., a room in which the sound is typically heard). Thus, the inappropriateness of these words only implies that the chosen action and location descriptions are too specific to describe all sounds.
Semantic attributes are often used in the evaluation of the intended product character and expected product experience. Such evaluations require a list of attributes that would (or not) describe certain qualities of product properties. This study provided factors that represent categories of semantic associations but did not elaborate on the kind of semantic attributes designers could use in such evaluations. It is the (sound) designers’ task to decide on the type of semantic attributes. For example, for understanding the kind of emotional responses a product sound could elicit, designers could use not only pleasant-unpleasant but other emotion descriptions such as irritating, disturbing, relaxing, and so on.
Acknowledgments
We gratefully acknowledge the help of Joline Boschman and Linda Rindertsma for the running of the experiments, and the valuable comments of Pieter Desmet during the preparation of the manuscript. We also feel obliged to thank Alexandre Vieira for voluntarily programming the experimental software in his free time.
Endnotes
- Praat is a free software program for acoustical analysis for phonetics. Paul Boersma and David Weenink have implemented it (see www.praat.org).
- Psysound is a psycho-acoustical analysis program (see for more info online http://farben.latrobe.edu.au/mikropol/volume5/cabrerad/PsySound.html). For reliable measuring, it was calibrated by the SPLs of each sound for the analysis of the psycho-acoustical parameters.
References
- Aures,W. (1985). Berechnungsverfahren für den sensorischen Wohlklang beliebiger Schallsignale [A model for calculating the sensory euphony of various sounds]. Acustica, 59(2), 130-141.
- Barsalou,L.W.(1999).Perceptual symbol systems. Behavioral and Brain Sciences, 22(4), 577-609.
- Björk, E. A. (1985). The perceived quality of natural sounds. Acustica, 57(3), 185-188.
- Blauert, J., & Jekosch, U. (1997). Sound-quality evaluation: A multi-layered problem. Acta Acustica united with Acustica, 83(5), 747-753.
- Bisping, R. (1997). Car interior sound quality: Experimental analysis by synthesis. Acta Acustica united with Acustica, 83(5), 813-818.
- Boersema, P. (1993). Accurate short-term analysis of the fundamental frequency and the harmonics-to-noise ratio of a sampled sound. In Proceedings of the Institute of Phonetic Sciences (Vol. 17, pp. 97-110). Amsterdam, the Netherlands: University of Amsterdam.
- Cleary, A. M. (2002). Recognition with and without identification: Dissociative effects of meaningful encoding. Memory & Cognition, 30(5), 758-767.
- Cummings, A., Ceponiene, R., Koyama, A., Saygin, A. P., Townsend, J., & Dick, F. (2006). Auditory semantic networks for words and natural sounds. Brain Research, 1115(1), 92-107.
- Demirbilek, O., & Sener, B. (2003). Product design, semantics and emotional response. Ergonomics, 46(13/14), 1346-1360.
- Edworthy, J., Hellier, E., & Hards, R. (1995). The semantic associations of acoustic parameter commonly used in the design of auditory information and warning signals. Ergonomics, 38(11), 2341-2361.
- Fabiani, M., Kazmerski, V. A., Cycowicz, Y. M., & Friedman, D. (1996). Naming norms for brief environmental sounds: Effects of age and dementia. Psychophysiology, 33(4), 462-475.
- Gaver, W. W. (1993). What in the world do we hear? An ecological approach to auditory source perception. Ecological Psychology, 5(1), 1-29.
- Kendall, R. A., & Carterette, E. C. (1993). Verbal attributes of simultaneous wind instrument timbres: I. von Bismarck’s adjectives. Music Perception, 10(4), 445-468.
- Lageat, T., Czellar, S., & Laurent, G. (2003). Engineering hedonic attributes to generate perceptions of luxury Consumer perception of an everyday sound. Marketing Letters, 14(2), 97-109.
- Letens, U. (2000, March 20). Exemplarische Darstellung einer subjektiven Beurteilung von PKW-Fahrgeräuschen [Exemplary representation of a subjective assessment of car-driving noises]. Paper presented at Fortschritte der Akustik DAGA 2000, Oldenburg, Germany.
- Lin, R., Lin, C. Y., & Wong, J. (1996). An application of multi-dimensional scaling in product semantics. International Journal of Industrial Ergonomics, 18(2-3), 193-204.
- Marcell, M. E., Borella, D., Greene, M., Kerr, E., & Rogers, S. (2000). Confrontation naming of environmental sounds. Journal of Clinical and Experimental Neuropsychology, 22(6), 830-864.
- Mehrabian, A., & Russell, J. A. (1974). An approach to environmental psychology. Cambridge, MA: MIT Press.
- McCauley, C., Parmelee, C. M., Sperber, R. D., & Carr, T. H. (1980). Early extraction of meaning from pictures and its relation to conscious identification. Journal of Experimental Psychology: Human Perception and Performance, 6(2), 265-276.
- Murphy, G. L. (2002). The big book of concepts. Cambridge, MA: MIT Press.
- Özcan, E. (2008). Product sounds: Fundamentals & application. Delft, the Netherlands: Delft University of Technology.
- Özcan, E., & van Egmond, R. (2005). Characterizing descriptions of product sounds. In D. Brock (Ed.), Proceedings of the 11th International Conference on Auditory Display (pp. 55-60). Limerick, Ireland: ICAD.
- Özcan, E., & van Egmond, R. (2007). Memory for product sounds: The effect of sound and label type. Acta Psychologica, 126(3), 196-215.
- Özcan, E., & van Egmond, R. (2009). The effect of visual context on the identification of ambiguous environmental sounds. Acta Psychologica, 131(2), 110-119.
- Paivio, A. (1991). Dual coding theory: Retrospect and current status. Canadian Journal of Psychology, 45(3), 255-287.
- Petiot, J. F., & Yannou, B. (2004). Measuring consumer perceptions for a better comprehension, specification and assessment of product semantics. International Journal of Industrial Ergonomics, 33(6), 507-525.
- Schifferstein, H. N. J., & Hekkert, P. (Eds.). (2008). Product experience. Amsterdam, the Netherlands: Elsevier.
- Solomon, L. N. (1958). Semantic approach to the perception of complex sounds. Journal of the Acoustical Society of America, 30(5), 421-425.
- Spence, C., & Zampini, M. (2006). Auditory contributions to multisensory product perception. Acta Acustica united with Acustica, 92(6), 1009-1025.
- Susini, P., McAdams, S., Winsberg, S., Perry, I., Viellard, S., & Rodet, X. (2004). Characterizing the sound quality of air-conditioning noise. Applied Acoustics, 65(8), 763-790.
- Vanderveer, N. J. (1979). Confusion errors in identification of environmental sounds. Journal of the Acoustical Society of America, 65(1), 60.
- van Egmond, R. (2004). Emotional experience of frequency modulated sounds: Implications for the design of alarm sounds. In D. de Waard, K. A. Brookhuis, & C. M. Weikert (Eds.), Human factors in design (pp. 345-356). Maastricht, the Netherlands: Shaker.
- van Egmond, R. (2008). The experience of product sounds. In H. N. J. Schifferstein & P. Hekkert (Eds.), Product experience (pp. 69-89). Amsterdam, the Netherlands: Elsevier.
- van Rompay, T. J. L. (2008). Product expression: Bridging the gap between the symbolic and the concrete. In H. N. J. Schifferstein, & P. Hekkert (Eds.), Product Experience (pp. 333-351). Amsterdam, the Netherlands: Elsevier.
- Västfjäll, D., Kleiner, M., & Gärling, T. (2003). Affective reactions to interior aircraft sounds. Acta Acustica united with Acustica, Acta Acustica, 89(4), 693-701.
- von Bismarck, G. (1974). Timbre of steady sounds: A factorial investigation of its verbal attributes. Acta Acustica united with Acustica, 30, 146 - 159.
- Zeitler, A., Ellermeier, W., & Fastl, H. (2004, March 22). Significance of meaning in sound quality evaluation. Paper presented at the joint CFA/DAGA 2004 congress, Strasbourg, France.
- Zwicker, E., & Fastl, H. (1990). Psychoacoustics: Facts and models. Berlin, Germany: Springer.
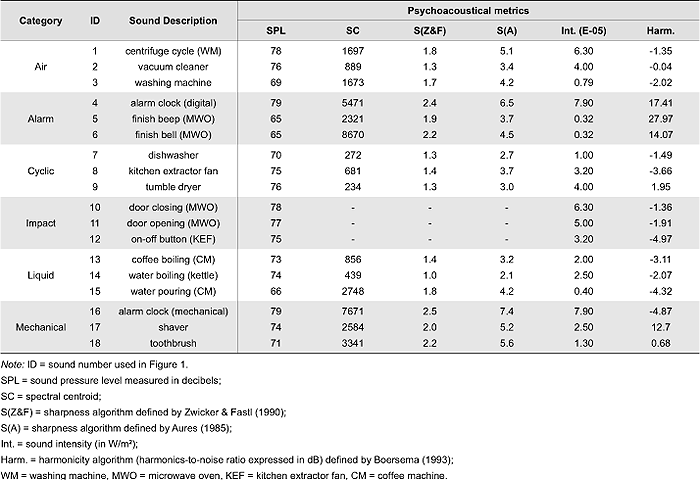
Appendix
Table A1. Psychoacoustical metrics calculated for each product sound as a function of product sound category1 2.