
Noisy Products: Does Appearance Matter?
Anna Fenko 1, *, Hendrik N. J. Schifferstein 2, and Paul Hekkert 2
1 Faculty of Behavioral Sciences, University of Twente, Enschede, the Netherlands
2 Department of Industrial Design, Delft University of Technology, Delft, the Netherlands
Noisiness is an important product experience that is not restricted to the auditory properties of products; bright colors and cluttered visual patterns can also be experienced as noisy. The aim of this study was to determine to what extent the overall product noisiness is attributed to the sounds that the products make and to what extent is it attributed to the visual appearance of the products. We manipulated the auditory and visual properties of alarm clocks and whistling kettles by combining noisy and quiet stimuli of the two sensory modalities according to a full factorial design. Participants in our experiment assessed the noisiness, pleasantness, and annoyance of the products. The results demonstrated that noisiness and annoyance of the products were generally dominated by the product sound, whereas contribution from visual patterns was insignificant. The noisiness of the sound had a negative influence on the overall pleasantness of the products. The results suggest that in order to create pleasurable product experience, designers need to pay more attention to the auditory properties of products.
Keywords – Multisensory Product Experience, Noisiness, Pleasantness, Sensory Dominance.
Relevance to Design Practice – Designers are aware of the importance of sound for products that make noise while functioning. But to what extent is it important? In this study, we measure the relative impact of sound and visual appearance on product experience.
Citation: Fenko, A., Schifferstein, H.N.J., Hekkert, P. (2011). Noisy products: Does appearance matter? International Journal of Design, 5(3), 77-87.
Received April 23, 2010; Accepted August 12, 2011; Published December 30, 2011.
Copyright: © 2011 Fenko, Schifferstein, & Hekkert. Copyright for this article is retained by the authors, with first publication rights granted to the International Journal of Design. All journal content, except where otherwise noted, is licensed under a Creative Commons Attribution-NonCommercial-NoDerivs 2.5 License. By virtue of their appearance in this open-access journal, articles are free to use, with proper attribution, in educational and other non-commercial settings.
*Corresponding Author: A.Fenko@utwente.nl
Anna Fenko is an Assistant Professor of Marketing Communications and Consumer Psychology at the Faculty of Behavioural Sciences, University of Twente. She has an MSc degree in psychology (cum laude) from Moscow State University (Russia) and a PhD in design research from Delft University of Technology (Netherlands). She was a Fulbright visiting scholar at Jones School of Management at Rice University (Houston, USA). She has presented her work at various international conferences and published, among others, in Applied Ergonomics, Food Quality and Preference and Material and Design.
Hendrik N.J. Schifferstein is an Associate Professor in the Department of Industrial Design at Delft University of Technology. After having worked in the food realm for several years, he now studies the multisensory experiences evoked by consumer durables. Among others, he published in Perception and Psychophysics, Acta Psychologica, Marketing Letters, The Design Journal, and Journal of Experimental Psychology: Human Perception and Performance. He is co-editor of the books Food, People and Society (2001; Springer Verlag), Product Experience (2008; Elsevier) and From Floating Wheelchairs to Mobile Car Parks (2011; Eleven International).
Paul Hekkert is a Professor of Form Theory at the Faculty of Industrial Design Engineering, Delft University of Technology and Head of the Section Design Aesthetics. He has published on product experience and aesthetics in major international journals and is co-editor of Design and emotion: the experience of everyday things (2004) and Product Experience (2008). Together with a colleague/designer, he has developed an interaction-centered design approach called Vision in Product Design (ViP). In addition, he is the Founder and Chairman of the Design and Emotion society.
Introduction
Noisiness is an important experience in the product domain, because everyday products may contribute to noise pollution. Some products, such as a vacuum cleaner or a washing machine, make harsh and unpleasant sounds. Other products may be less noisy, but working together may be quite distracting and annoying for their users. In a broad context, noise refers to irrelevant or superfluous information or activity, especially that which distracts from what is important (Simpson & Weiner, 1989). Perceived noisiness is not restricted to the auditory properties of products; bright colors and cluttered visual patterns can also be considered noisy and annoying, especially in situations that require focus and concentration. For these reasons, there are architectural regulations and business dress codes that restrict the use of bright colors in an effort to reduce visual noisiness in social environments.
Multisensory Integration in Product Experience
Our perceptual experience of the world is richly multimodal (Stein & Meredith, 1993). Different sensory modalities make different contributions to overall product experience. For instance, color and material have been found to contribute about equally to the experience of ‘warmth’ in scarves and trays (Fenko, Schifferstein, & Hekkert, 2010), while the experience of ‘freshness’ in soft drinks and dishwashing liquids depends more on smell than color (Fenko, Schifferstein, Huang, & Hekkert, 2009). Furthermore, Ludden and Schifferstein (2007) have found that the sounds that dust busters and juicers produce influence their overall perceived quality.
In the present study, we focus on the experience of noisiness. According to people’s self-reports, the sensory modalities of audition and vision both play an important role in experiencing noisiness. In an extensive preliminary questionnaire study on product descriptors (Fenko, Otten, & Schifferstein, 2010), we investigated various affective, sensory and symbolic product experiences in relation to the sensory modalities. The aim of this research was to select multisensory product experiences for which at least two sensory modalities were important (according to people’s self-reports). We selected “noisy” from the list of 34 different adjectives for the present study, because it was the only experience that demonstrated both the dominance of audition (mean rating 4.9 out of 5) and a relatively important secondary modality (vision, mean rating 3.1).
Results of questionnaire studies on sensory integration should be interpreted with caution, because people are usually unaware of perceptual mechanisms underlying their experience. A good example is the McGurk effect (McGurk & MacDonald, 1976) that demonstrates an interaction between audition and vision in speech perception. When a recording of the sound ‘ba’ is combined with a video of lip movements saying ‘ga,’ most people think they are hearing ‘da.’ When people close their eyes, they hear ‘ba’ correctly. The brain combines the two types of information automatically; knowledge about the effect has little effect on one's perception of it. Another example of audio-visual interaction is ventriloquism (e.g., Bertelson, 1999). A ventriloquist synchronizes the movements of a puppet's mouth with his own speech while avoiding movements of his own head or lips. As a result, the audience perceives a speaking puppet. This effect is regularly experienced when watching television and movies, where voices seem to emanate from the actors' lips rather than from the loudspeakers. The ventriloquism effect does not depend on the direction of deliberate or automatic visual attention (Bertelson, Vroomen, de Gelder, & Driver, 2000; Vroomen, Bertelson, & de Gelder, 2001). All these examples demonstrate visual dominance over audition. However, Shams, Kamitani, and Shimojo (2000) have also demonstrated the opposite effect of auditory dominance over visual perception: when a single visual flash is accompanied by multiple auditory beeps, the single flash is incorrectly perceived as multiple flashes. This illusion is quite robust and persists even when subjects are aware of the experimental manipulation.
Audio-visual interactions can play an important role in product experience. For instance, Fastl (2004) has demonstrated that the color of a visual stimulus can influence loudness evaluation in such a way that – for the same acoustic stimulus – the loudness of a red train is rated 15 % higher than the loudness of a green train. These examples show that people can be mistaken in their assessment of the relative contribution of different senses to a product experience, such as noisiness. That is why experimental manipulation is necessary to establish which sensory modality is more important for a specific product experience.
Experiencing Noisiness
Auditory Noisiness
Many everyday products generate sounds while operating. For some products these sounds are a consequence of their functioning, like the rotating sound of a washing machine, the mechanical sound of a hammer, or the blowing sound of a hair dryer. For other products, sounds are designed intentionally to attract people’s attention (e.g., the alarm sounds of a kitchen timer or microwave oven) or to provide auditory feedback during an interaction (e.g., pressing the buttons of a phone) (Özcan & van Egmond, 2008). In addition, designers intentionally modify many consequential sounds in order to enhance certain product experiences, such as an experience of quality for car doors (Kuwano, Fastl, Namba, Nakamura, & Uchida, 2006) or an experience of luxury for cigarette lighters (Lageat, Czellar, & Laurent, 2003). Although there is an increasing interest in the sound design of domestic appliances, most sound designers work on the reduction of industrial and traffic noise and diminishing the loudness of domestic appliances (Lyon, 2000).
Besides a contribution of product sounds to the overall noisiness in a certain situation, sounds themselves may also differ with respects to their noisiness. From the physical point of view, any complex sound may be described as a combination of pure tones of various amplitudes, frequencies, and phases. Musical tones typically contain only a few components, for which the frequencies and phases have simple relationships. More complex sounds contain many components, which may not be systematically related in frequency and phase. From an acoustical perspective, noise refers to a non-repetitive signal in which the amplitude varies randomly (Handel, 2006). In terms of the frequency spectrum, the amplitudes and the phases of the frequency components are randomly distributed. The power across the frequency components may be flat, creating white noise, or may vary, creating pink or brown noise. Brown noise decreases in power by 6 dB per octave, and pink noise falls off at 3 dB per octave. The sound from a water-spray or a jet of air is an approximation of white noise (Northwood, 1963). The sound of brown noise is a low roar resembling a waterfall or heavy rainfall and has a “damped” or “soft” quality compared to white and pink noise.
In this paper we are interested in the subjective experience of noisiness. When speaking of noise in relation to sound, what is commonly meant is meaningless sound of greater than usual volume. Thus, a loud activity may be referred to as noisy. For instance, conversations of other people may be called noise for people not involved in any of them, and noise can be any unwanted sound, such as the noise of dogs barking, neighbors playing loud music, road traffic sounds, or jet engine at close quarters. People can easily assess the degree of noisiness of various sounds. Subjective ratings of “noisiness” usually increase as 1) the frequency of a sound is raised (Hellman, 1984); 2) the complexity of the spectrum is increased (Hellman, 1985); and 3) the duration is increased beyond 200 milliseconds (Kryter, 1966).
Although in the psychoacoustic literature the terms “noisy” and “annoying” are often used as synonyms (Berglund, Berglund, & Lindvall, 1976; Bowsher & Robinson, 1962; Hellman, 1982; Takeshima, Suzuki, & Sone, 1991; Schultz, 1978), in the present study we treat noisiness and annoyance as separate experiences. Not all annoying sounds are necessarily noise: loud music or conversation can be experienced as annoying if they distract listeners from their activities (Northwood, 1963). Speech sounds are particularly troublesome if they are intelligible or nearly so. Sudden impacts, startling or alarming sounds, and sounds with marked height or rhythm (for example, a dripping faucet) are particularly distracting and therefore annoying (Job, 1988). Similarly, a single identifiable source of sound is more troublesome than the same loudness level produced by a random assortment of many sounds from many sources (Northwood, 1963). Random and meaningless sounds sometimes mask other sounds that would be distracting. Paradoxically, the white noise from ventilators and air conditioners can successfully mask a particular intruding sound and help to reduce the annoyance from such sound.
The capacity of sounds to induce annoyance depends on many acoustical and non-acoustical factors. Few sounds are intrinsically annoying. The most common examples include the sound of a metal saucepan being scraped with a knife, a pneumatic drill at close range, and a powerful motorcycle accelerating (Bowsher & Robinson, 1962). Annoyance from a sound increases with the increase of the duration of the event: longer exposures to low sound levels are equally annoying as shorter exposures to higher sound levels (Fujii, Soeta, & Ando, 2001; Hiramatsu, Takagi, & Yamamoto, 1983). Loudness was found to account for a relatively small percentage of the variability in self-reported annoyance, usually 10% to 25% (Griffiths & Langdon, 1968; McKennel, 1963).
Visual Noisiness
The English word ‘noisy’ can be used without implication of audible sound. In the latter sense, it means “showy, ostentatious; conspicuous; overwhelming; gaudy, loud, or bright in color” (Simpson & Weiner, 1989). This meaning of noisiness refers to the use of bright colours and to visual complexity.
Perceived visual complexity usually increases with the quantity and range of objects and the variety of colors, materials and surface styles, while the number of objects and surfaces remain constant (Heaps & Handel, 1999). The perceived complexity of an image also depends on the degree of perceptual grouping, a characteristic independent of the quantity of parts. Regularities, such as symmetry, repetition, and similarity, simplify a visual pattern, making it less noisy (Feldman, 1997; Palmer, 1999; van der Helm, 2000). Similarly, textures with repetitive and uniformly oriented patterns are judged as less complex than disorganized and cluttered patterns (Heaps & Handel, 1999; Oliva & Torralba, 2001).
Visual complexity has been reported to influence aesthetic judgment (e.g., Berlyne, 1963; Eisenman, 1967; Eysenck & Hawker, 1994). Berlyne (1971) believed that the pleasure or hedonic value of an object depends on its capacity for arousal. He suggested that the same characteristics determine pleasure and arousal: intensity, color, frequency, novelty, and complexity. As the arousal potential of an object increases, one's pleasure at first rises but eventually peaks and then falls down again. Thus, pleasure is a function of an arousal change. Represented graphically, the curve is bell-shaped. The bell-shaped curve goes back to Wundt's (1893/1904) theory of sensory affect, depicting pleasantness as a function of stimulus intensity. In a number of experiments Berlyne and his co-workers have shown that medium levels of complexity for visual or auditory stimuli are liked most, while low and high levels are liked the least (Berlyne, Mcdonnell, & Nicki, 1967; Berlyne, 1971). Possibly, low levels of visual noisiness may be experienced as boring and thus not particularly pleasant, while high levels of visual noisiness may cause high levels of arousal and thus be experienced as annoying and unpleasant. Therefore, we expect the medium level of visual noisiness to be experienced as the most pleasant.
Present Study
In the present study, we manipulated the auditory and visual properties of two products in order to find out to what extent the overall experience of product noisiness depended on the specific sounds these products made and their visual appearances. In the pre-study, we asked respondents to assess the noisiness, pleasantness, and annoyance of various product sounds or product images on a 10-point scale. In the main study, we created products combining noisy and quiet stimuli of both sensory modalities in four different combinations: 1) noisy sound + noisy visual pattern, 2) noisy sound + quiet visual pattern, 3) quiet sound + noisy visual pattern, and 4) quiet sound + quiet visual pattern. Participants indicated how noisy, pleasant, and annoying they found these products on a 10-point scale.
Pre-study
Method
Participants
Two groups of Dutch-speaking participants took part in the pre-study. The first group (10 men and 12 women, age ranged from 17 to 54, mean age 29) assessed the reproduced sounds of alarm clocks and kettles, and the second group (14 men and 12 women, age ranged from 22 to 45, mean age 32) assessed pictures of the two products with various types of decorative patterns.
Stimulus Materials
Two products were used in the experiment: a kettle with a removable whistle (HEMA) and an electronic radio alarm clock (AKAI). We selected these products, because for both of them noisiness is a functional property: the sounds of the products are designed intentionally to attract people’s attention.
Ten alarm sounds were created using digital sound samples and recordings. Ten different whistling sounds were created by manipulating the whistles of the kettles (e.g., enlarging holes, drilling additional holes, and filling whistles with various materials). Original sounds of the two products were also used in the experiment. All sounds were recorded with a semi-professional digital recorder with a frequency bandwidth of 20,000 Hz at 1.5-meter distance from the object. Each sound lasted for 10 seconds.
Decorative visual patterns were created in which the amount of elements and colours, the size of the elements, and regularity and symmetry of the pattern were manipulated. These patterns were applied manually to the photographs of the kettle and alarm clock using Adobe Photoshop. The resulting images (12 for each product) are shown in Figures 1 and 2.
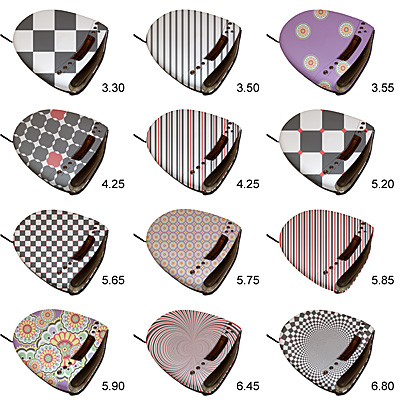
Figure 1. Images of alarm-clocks used in the pre-study (with mean noisiness ratings).
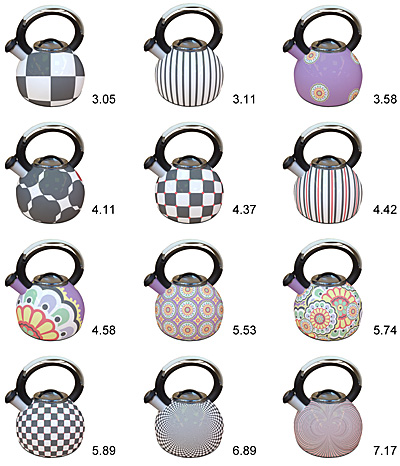
Figure 2. Images of whistling kettles used in the pre-study (with mean noisiness ratings).
Procedure
Most adjectives that describe product experiences have several meanings, and usually not all these meanings can be translated adequately into another language (Brislin, 1980). In the Dutch language several adjectives are used to capture auditory and visual aspects of noisiness (Van Dale, 2008): 1) lawaaierig – noisy, full of or characterized by loud and nonmusical sounds; 2) luidruchtig – loud, with high volume; noisy, full of or characterized by loud and nonmusical sounds; 3) druk – restless, overwhelming (of artwork etc.); with too many flowers, lines, figures; loud (of colors). That is why in the pre-study we used several Dutch adjectives to assess auditory and visual noisiness. We selected the word lawaaierig as the multisensory measure of product noisiness, because it correlates both with auditory and visual noisiness.
In the group that evaluated sounds, kettle and alarm clock sounds were presented in two separate sets. Half of the group evaluated kettle sounds first, and half evaluated alarm sounds first. Within each set all the sounds were randomized between participants. Participants filled out the questionnaire evaluating how noisy (lawaaierig), loud (hard), pleasant (prettig), and annoying (irritant) they found each sound on a 10-point scale (from “not at all” to “extremely”).
In the group who evaluated product images, the images were presented in two separate series. Half of the group evaluated 12 whistling kettles first, and half evaluated 12 alarm clocks first. The images of the products were presented in random order on a 17" laptop screen. Participants filled out the questionnaire evaluating how noisy (lawaaierig), loud (druk), colorful (kleurrijk), pleasant (prettig) and annoying (irritant) they found each image on a 10-point scale (from “not at all” to “extremely”).
Statistical Analysis
For each product, repeated measures ANOVAs on the ratings were performed with sound or visual pattern as within-subjects factor. Post-hoc analyses with Bonferroni adjustment were performed to test the significance of the differences between means. Pearson correlations between all evaluative ratings were computed.
Results
Auditory noisiness. The statistical analysis showed significant main effects of sound on the noisiness (lawaaierig) for both alarm clocks (F (9, 180) = 11.0, p < 0.001) and kettles (F (9, 180) = 36.6, p < 0.001). Mean noisiness ratings for sounds varied between 1.76 and 9.48 for whistling kettles and between 4.76 and 8.24 for alarm clocks. Original sounds of the products were rated the highest on noisiness (9.48 for a kettle, and 8.24 for an alarm clock). The acoustical analysis of sounds, performed with Adobe Audition 5.5, showed that sounds with well-defined frequency peaks (at 2, 4, and 8 KHz) were assessed as noisier than sounds without pronounced frequency peaks (see Figure 3).
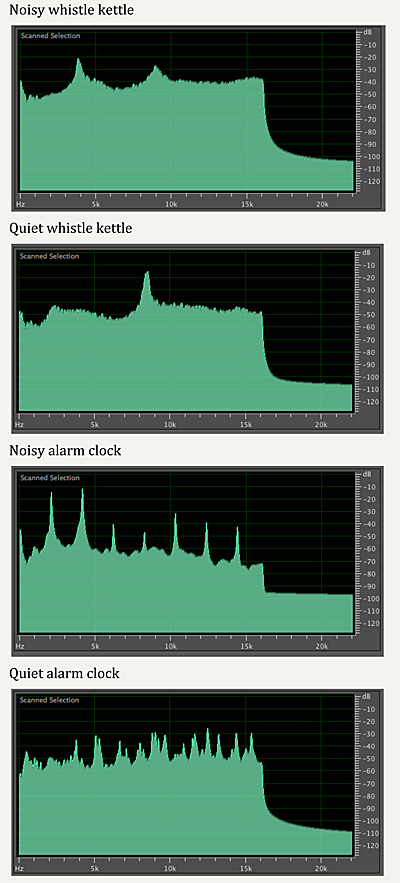
Figure 3. Frequency analysis of the sounds used in the main study (Adobe Audition CC 5.5).
Noisiness was positively correlated with annoyance (irritant; 0.62 for alarm clocks and 0.77 for kettles) and negatively correlated with pleasantness (prettig; - 0.40 and - 0.61 for both products, respectively). All correlations were significant at the 0.01 level (2-tailed). Noisiness was also positively correlated with loudness (hard; 0.76 and 0.90) and with the other noisiness measure (luidruchtig; 0.85 and 0.90).
Visual noisiness. The main effect of visual pattern on the noisiness (lawaaierig) was significant both for both alarm clocks (F (11, 209) = 13.7, p < 0.001) and kettles (F (11, 198) = 11.9, p < 0.001). Mean noisiness ratings for the visual patterns varied between 3.05 and 7.17 for kettles and between 3.30 and 6.80 for alarm clocks (see Figures 1 and 2). In both products the ratings of noisiness increased as the amount of elements and colors increased. Regular patterns were perceived as less noisy than irregular patterns.
The correlations between noisiness and annoyance (irritant) were positive for both alarm clocks (0.74) and kettles (0.74). Pleasantness (prettig) was negatively correlated with noisiness both for kettles (-0.43) and alarm clocks (- 0.16). All correlations were significant at the 0.05 level (2-tailed). In addition, noisiness ratings were positively correlated with colorfulness (kleurrijk; 0.37 and 0.24) and the other noisiness measure (druk, 0.64 and 0.69).
Main Study
Method
Participants
The participants were 40 Dutch-speaking students and staff of TU Delft (17 women and 23 men). Ages ranged from 18 to 51 years with a mean age of 24.
Materials
The stimuli for the main study were selected in such a way that differences between auditory and visual stimuli were similar for each product. For the kettles we selected sounds with mean ratings 5.57 and 3.57 (difference 2.00) and visual stimuli with mean ratings 5.89 and 3.58 (difference 2.31). For the alarm clocks we selected sounds with mean ratings 8.05 and 4.86 (difference 3.19) and images with mean ratings 6.80 and 3.30 (difference 3.50). All differences between noisy and quiet stimuli for each product were significant at the 0.01 level, but mean differences for alarm clocks were larger than for kettles. This was the result of technical difficulties in creating different kettle sounds.
For each product, we made a computer video clip in Adobe Flash CS4. In the clips, the products were presented in a naturalistic environment: alarm clocks in the bedroom, kettles in the kitchen (see Figure 4). To increase the degree of realism, the steam of boiling kettles was added to the latter clips. For each product, a visual image was combined with a sound according to a full factorial (2 × 2) design: 1) sound noisy + image noisy (SNIN), 2) sound noisy + image quiet (SNIQ), 3) sound quiet + image noisy (SQIN), and 4) sound quiet + image quiet (SQIQ).
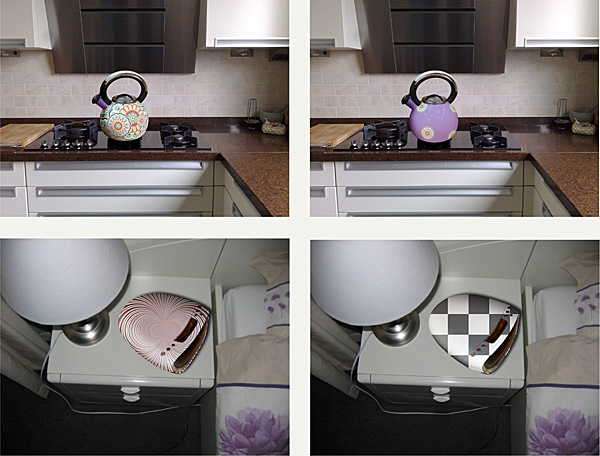
Figure 4. Images of products used in the main study.
Procedure
To prevent participants from figuring out the purpose of the study, the experiment was performed with two groups of participants. One group assessed products that combined noisy sound with noisy image (SNIN) and quiet sound with quiet image (SQIQ). Another group assessed products that combined noisy and quiet stimuli (SNIQ and SQIN). Each group evaluated 4 products (two kettles and two alarm clocks). The sequences in which products were presented were randomized between participants in such a way that products from the same category never followed each other.
The experiment took place in a quiet room with natural lighting. One laptop computer with fixed visual and sound settings was used throughout the experiment. The experimenter first explained to the participants that they were about to see four different products and asked them to answer 5 evaluative questions for each product. After participants filled in their personal information, they clicked the “start” button. Then the first product appeared on a 17" diagonal computer screen and the sound was played through headphones. Participants saw each product and heard the product sound for 10 seconds. After a couple of seconds the first question appeared below the image. The next question appeared automatically after the previous question was answered. For each product, participants assessed how noisy (lawaaierig, druk, and schreeuwerig), annoying (irritant) and pleasant (prettig) they found the product on a 10-point scale (from “not at all” to “extremely”). In addition, spontaneous comments given by participants during the experiment were recorded.
Data Analysis
Two of the four variants of each product were evaluated by one group of participants, while the other two were evaluated by another group. As a consequence, some effects could be tested using within-participants comparisons, while the other effects should be tested using between-participants comparisons. Due to the particular design of the study, ANOVA F-tests were hard to interpret. Therefore, we used T-tests only.
Results
The noisiness ratings (lawaaierig) suggest that only the sounds are important in determining product noisiness (Figure 5). For the alarm clocks, the products with noisy sound were assessed as noisier than the two alarm clocks with quiet sound (T (SNIQ – SQIQ) = 7.0, p < 0.001; T (SNIN – SQIN) = 4.2; p < 0.01). The means for kettles exhibited a similar pattern. However, for kettles only the noisiness of the product with noisy sound and quiet image was significantly higher than the noisiness of the product with quiet sound and noisy image (T (SNIQ – SQIN) = 2.3; p < 0.05). Overall, these results suggest that the overall noisiness of both products depends on sound; it is not influenced by visual noisiness.
The pattern of annoyance ratings roughly matched the noisiness ratings for both products (see Figure 5). The pleasantness ratings for alarm clocks showed the reversed pattern, although somewhat less pronounced: two alarm clocks with quiet sound were assessed as more pleasant than two alarm clocks with noisy sounds. However, for kettles the only significant difference in pleasantness ratings was found between the unpleasant combination of noisy stimuli (SNIN) and the combination of noisy sound and quiet image (SNIQ).
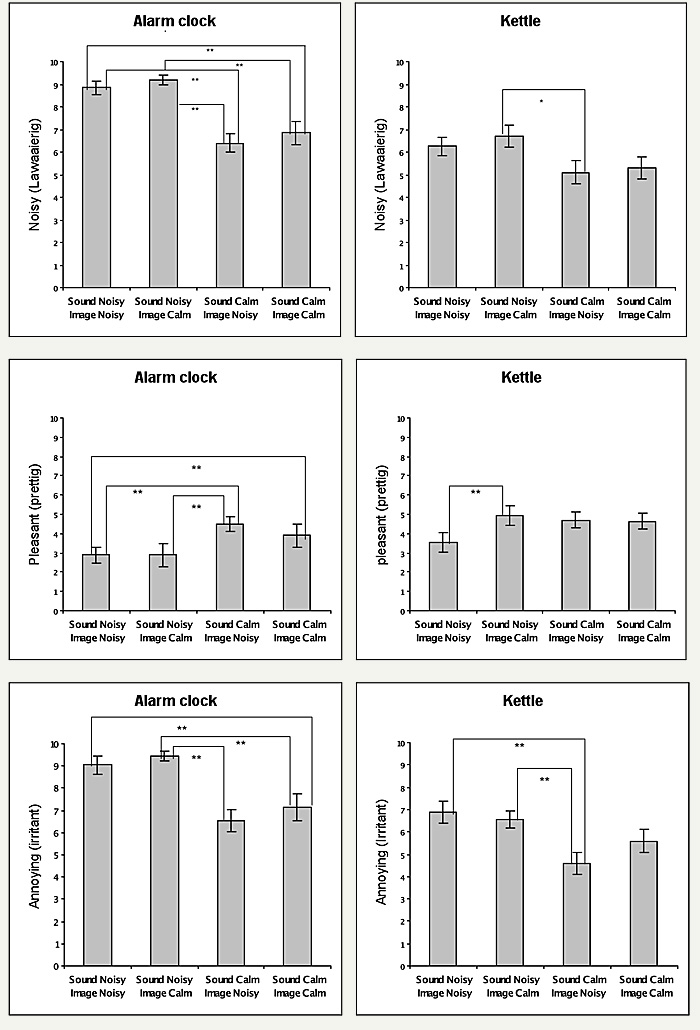
Figure 5. Mean noisiness, pleasantness and annoyance ratings for kettles and alarm clocks (with SE). Note: ** Differences between means are significant at .01 level, * at .05 level (2-tailed T-test).
The ratings of product noisiness (lawaaierig) were positively correlated with the ratings of annoyance (irritant; 0.77 for alarm clocks and 0.69 for kettles) and negatively correlated with the ratings of pleasantness (prettig; - 0.56 and - 0.27 for both products, respectively). All correlations were significant at the 0.05 level (two-tailed). Noisiness (lawaaierig) was positively correlated with one of the two additional noisiness measures (schreeuwerig; 0.37 and 0.35). The correlation between lawaaierig and the second noisiness measure (druk) was positive only for alarm clocks (0.40), but was not significant for kettles.
Discussion
Pre-study
In agreement with previous studies, our sound pre-study found a high correlation between noisiness and annoyance (Bowsher & Robinson, 1962; Griffiths & Langdon, 1968; Berglund et al., 1976). Rhythmical sounds were assessed as noisier than constant sounds, which also corresponds with previous findings (Northwood, 1963). We also found some differences in sound experience between products. While whistling kettle sounds varied in subjective noisiness between 1.76 and 9.48, even the most quiet alarm clock sound was assessed as quite noisy (4.76), possibly due to unpleasant associations users have with alarm clocks (waking up early in the morning). These associations may influence the experience of noisiness and annoyance of product sounds.
The results of the visual pre-study demonstrate that noisiness of an image depends on the amount of elements and colors, as well as regularity in the visual pattern. These findings correspond to the existing data on perceived visual complexity (Feldman, 1997; Palmer, 1999; Heaps & Handel, 1999; Oliva & Torrabla, 2001; van der Helm, 2000).
For both products, we found positive correlations of noisiness with annoyance and negative correlations with pleasantness. Studies in experimental aesthetics generally tend to show that medium levels of visual complexity are perceived as pleasant, while low and high levels are perceived as unpleasant (Berlyne, 1971). In our pre-study the link between visual noisiness and visual complexity was assumed, but not tested experimentally. Further research is needed to determine whether the relation between noisiness and pleasantness follows the bell-shaped curve pattern similar to the relation between complexity and pleasantness (Berlyne, 1971; Messinger, 1998).
In the present study, we manipulated visual complexity by changing the visual pattern applied to products. However, the shape of a product can also contribute to the experience of its complexity and, hence, its noisiness. Therefore, it would be interesting to explore the role of product shape on product noisiness in future studies. In these future studies, it will be important to show the products from different angles or to allow participants to interact with physical products in order to assess the full impact of shape differences.
Main Study
The results of the main study demonstrated that the overall experiences of noisiness and annoyance were influenced mainly by the sound of both alarm clocks and kettles, while the contribution from the visual pattern was not significant. The ratings of pleasantness for the alarm clocks were also dominated by sound. For the kettles, however, the single significant difference in mean pleasantness rating was due to the visual pattern.
The differences between the two products in our study can be partly explained by the choice of stimuli for the main experiment. The noisiness differences between the stimuli chosen for kettles (2.00 between the auditory and 2.31 between the visual stimuli) were less prominent than the noisiness differences between the alarm clock stimuli (3.19 for the auditory and 3.50 for the visual stimuli). This can explain why in the main study the effect of sound was less pronounced for kettles than for alarm clocks.
Spontaneous comments made by participants during the experiment indicated that both alarm clock sounds were quite irritating. Several participants asked to stop the sound; others commented that they always found alarm clocks annoying. On the other hand, the cheerful visual patterns that had been chosen for kettles were perceived as pleasant by most participants. Several participants commented: “What a nice kettle!”
General Discussion
Product experience can be defined as “the awareness of the psychological effects elicited by the interaction with a product, including the degree to which all our senses are stimulated, the meanings and values we attach to the product, and the feelings and emotions that are elicited” (Hekkert & Schifferstein, 2008, p.2). In this study, noisiness was analyzed as the multisensory product experience that integrated auditory and visual sensory perceptions and evoked affective reactions (annoyance and unpleasantness).
Many sensory adjectives, such as sharp, dull (touch), sweet, sour (taste), loud, and quiet (sound), extend their meaning from one basic or prototypical sensory modality to one or more secondary modalities (Ullmann, 1963; Williams, 1976). For instance, Sweetser (1990) argues that the connection between different meanings of sensory words is metaphorical in nature. When we analyze multisensory experiences, such as “noisy,” it is difficult to determine which meaning of the word is literal and which is metaphorical, because both meanings may refer to basic perceptual processes. For example, Rakova (2003) argues that synaesthetic and double-function adjectives (such as ‘bright’ and ‘sharp’) are literal rather than metaphorical, because all meanings of such adjectives refer to the same psychologically primitive concept. For example, both tactile and gustatory meanings of the term ‘hot’ are literal. It does not seem right to say that thermal heat is more primary than food spiciness, because virtually the same neural mechanisms underlie the perception of thermal heat and spicy heat (Green, 1986). Other authors (e.g., Nogales, 2007) argue that a sharp sound is metaphorically related to a sharp knife because of a particular shared property. Specifically, the sharp sound plays the same role with silence and human ears as the sharp knife plays with bread and cheese.
In the case of “noisy,” complexity can be the property that is shared by auditory and visual noisiness. Complexity in the auditory modality refers to the presence of different frequencies and to phases that are not systematically related to each other. The ultimate auditory complexity is “white noise” that contains all frequencies. Complexity in the visual modality refers to the large amount of different elements, colors, and textures that are put together without any regularity or symmetry.
Complexity may not be the only property common to visual and auditory noisiness. A high frequency sound and a pure bright color are not complex, but they are likely to contribute to the noisiness of a certain situation. Vice versa, a painting or a piece of music can be perceived as complex but not noisy. In these cases, noisiness may refer to certain sensory properties (such as frequency, hue, intensity, loudness, and brightness) that are perceived as unpleasant, because they attract automatic attention and distract people from their normal activity. It is also possible that they are experienced as unpleasant, because they evoke arousal that exceeds the optimum arousal level (Berlyne, 1971).
The correlation between auditory noisiness and annoyance is widely documented (Berglund et al., 1976; Bowsher & Robinson, 1962; Griffiths & Langdon, 1968; Schultz, 1978) and was supported by our findings. We also found a correlation between visual noisiness and annoyance. Nevertheless, noisiness is not necessarily a negative experience. If we look at language differences, we can find some positive connotations with noise. In English, there is no special verb to indicate an activity of making noise, but such verbs exist in German (rauschen), French (bruire), and Russian (шуметь). They mostly involve sounds of nature (e.g., trees, water), of happy crowds of people (e.g., an outdoor festival, a ball, a party), of children playing, and so on. Hence, all these situations refer to the positive meaning of noise-making. This suggests that the positive correlations between noisiness, annoyance and unpleasantness may not be universal.
Since sensory connotations of English and Dutch terms for noisiness are different, product experiences of noisiness might also differ between participants who speak different languages. In recent years, many studies have claimed experimental evidence that language has an important influence on cognitive processing of sensory information (Gordon, 2004; Levinson, 2003; Li & Gleitman, 2002; Núñez & Sweetser, 2006; Robertson, Davies, & Davidoff, 2000). Although in our study we found high positive correlations between Dutch synonyms of noisiness (such as lawaaierig, druk, schreeuwerig, and luidruchtig), our results might have been different if we had used any of these synonyms, because their exact meanings differ. Further cross-cultural and cross-language research is needed into the relationships between the various noisiness synonyms, between noisiness and complexity, and into the relationships between noisiness, annoyance, and unpleasantness in different product-usage situations. Such research can clarify the experiential basis and metaphorical meaning of noisiness and help designers to create products with more pleasurable sensory properties.
Conclusion
In this study, noisiness was analyzed as the multisensory product experience that integrated auditory and visual sensory perceptions and evoked affective reactions (annoyance and unpleasantness). We manipulated auditory and visual properties of two products - alarm clocks and whistling kettles - to determine the dominant sensory modality for the experience of noisiness. The results demonstrated that the overall experiences of noisiness and annoyance were influenced mainly by the sound for both alarm clocks and kettles, while the contribution of the visual pattern was not significant. These results suggest that in order to create pleasurable product experience, designers need to pay more attention to the auditory properties of products.
References
- Berglund, B., Berglund, U., & Lindvall, T. (1976). Scaling loudness, noisiness, and annoyance of community noises. Journal of the Acoustical Society of America, 60(5), 1119-1125.
- Berlyne, D. E. (1963). Complexity and incongruity variables as determinants of exploratory choice and evaluative ratings. Canadian Journal of Psychology, 17(3), 274-290.
- Berlyne, D. E., Mcdonnell, P., Nicki, R. M., & Parham, L. C. (1967). Effects of auditory pitch and complexity on EEG desynchronization and on verbally expressed judgments. Canadian Journal of Psychology, 21(4), 346-367.
- Berlyne, D. E. (1971). Aesthetics and psychobiology. New York: Appleton-Century-Crofts.
- Bertelson, P. (1999). Ventriloquism: A case of cross-modal perceptual grouping. In G. Aschersleben, T. Bachmann, & J. Müsseler (Eds.), Cognitive contributions to the perception of spatial and temporal events (pp. 347-362). Amsterdam: Elsevier.
- Bertelson, P., Vroomen, J., de Gelder, B., & Driver, J. (2000). The ventriloquist effect does not depend on the direction of deliberate visual attention. Perception and Psychophysics, 62(2), 321-332.
- Bowsher, J. M., & Robinson, D. W. (1962). On scaling the unpleasantness of sounds. British Journal of Applied Physics, 13(4), 179-181.
- Brislin, R. (1980). Translation and content analysis of oral and written material. In H. Triandis & J. Berry (Eds.), Handbook of cross-cultural psychology (Vol. 2, pp. 389-444). Boston: Allyn and Bacon.
- Eisenman, R. (1967). Complexity–simplicity: Preference for symmetry and rejection of complexity. Psychonomic Science, 8(4), 169-170.
- Eysenck, H. J., & Hawker, G. W. (1994). The taxonomy of visual aesthetic preferences: An empirical study. Empirical Studies of the Arts, 12(1), 95-101.
- Fastl, H. (2004). Audio-visual interactions in loudness evaluation. In Proceedings of the 18th International Congress on Acoustics (pp. 1161-1166), Kyoto, Japan.
- Feldman, J. (1997). Regularity-based perceptual grouping. Computational Intelligence, 13(4), 582-623.
- Fenko, A., Otten, J. J., & Schifferstein, H. N. J. (2010). Describing product experience in different languages: The role of sensory modalities. Journal of Pragmatics, 42(12), 3314-3327.
- Fenko, A., Schifferstein, H. N. J., & Hekkert, P. (2010). Looking hot or feeling hot: What determines the product experience of warmth? Materials and Design, 31(3), 1325-1331.
- Fenko, A., Schifferstein, H. N. J., Huang, T. C., & Hekkert, P. (2009). What makes products fresh: The smell or the colour? Food Quality and Preference, 20(5), 372-379.
- Fujii, K., Soeta, Y., & Ando, Y. (2001). Acoustical properties of aircraft noise measured by temporal and spatial factors. Journal of Sound and Vibration, 241(1), 69-78.
- Gordon, P. (2004). Numerical cognition without words: Evidence from Amazonia. Science, 306(5695), 496-499.
- Green, B. G. (1986). Sensory interactions between capsaicin and temperature in the oral cavity. Chemical Senses, 11(3), 371-382.
- Griffiths, I. D., & Langdon, F. J. (1968). Subjective response to road traffic noise. Journal of Sound and Vibration, 8(1), 16-32.
- Handel, S. (2006). Perceptual coherence: Hearing and seeing. New York: Oxford University Press.
- Heaps, C., & Handel, S. (1999). Similarity and features of natural textures. Journal of Experimental Psychology: Human Perception and Performance, 25(2), 299-320.
- Hekkert, P., & Schifferstein, H. N. J. (2008). Introducing product experience. In H. N. J. Schifferstein & P. Hekkert (Eds.), Product experience (pp.1-8). Amsterdam: Elsevier.
- Hellman, R. P. (1982). Loudness, annoyance, and noisiness produced by single-tone–noise complexes. Journal of the Acoustical Society of America,72(1), 62-73.
- Hellman, R. P. (1984). Growth rate of loudness, annoyance, and noisiness as a function of tone location within the noise spectrum. Journal of the Acoustical Society of America, 75(1), 209-218.
- Hellman, R. P. (1985). Perceived magnitude of two-tone–noise complexes: Loudness, annoyance, and nosiness. Journal of the Acoustical Society of America, 77(4), 1497-1504.
- Hiramatsu, K., Takagi, K., & Yamamoto, T. (1983). Experimental investigation on the effect of some temporal factors of nonsteady noise on annoyance. Journal of the Acoustical Society of America, 74(6), 1782-1793.
- Job, R. F. S. (1988). Community response to noise: A review of factors influencing the relationship between noise exposure and reaction. Journal of the Acoustical Society of America, 83(3), 991-1001.
- Kryter, K. D. (1966). Psychological reactions to aircraft noise. Science, 151(3716), 1346-1355.
- Kuwano, S., Fastl, H., Namba, S., Nakamura, S., & Uchida, H. (2006). Quality of door sounds of passenger cars. Acoustical Science and Technology, 27(5), 309-312.
- Lageat, T., Czellar, S., & Laurent, G. (2003). Engineering hedonic attributes to generate perceptions of luxury: Consumer perception of an everyday sound. Marketing Letters, 14(2), 97-109.
- Levinson, S. (2003). Space in language and cognition: Explorations in cognitive diversity. New York: Cambridge University Press.
- Li, P., & Gleitman, L. (2002). Turning the tables: Language and spatial reasoning. Cognition, 83(3), 265-294.
- Ludden, G. D. S., & Schifferstein, H. N. J. (2007). Effects of visual–auditory incongruity on product expression and surprise. International Journal of Design, 1(3), 29-39.
- Lyon, R. H. (2000). Designing for product sound quality. New York: Marcel Dekker.
- McGurk, H., & MacDonald, J. (1976). Hearing lips and seeing voices. Nature, 264(5588), 746-748.
- McKennel, A. C. (1963). Aircraft noise annoyance around London (Heathrow) airport. London: Central Office of Information.
- Messinger, S. M. (1998). Pleasure and complexity: Berlyne revisited. Journal of Psychology, 132(5), 558-564.
- Nogales, P. (2007). The extent of the literal by Marina Rakova. Mind, 116(462), 467-471.
- Northwood, T. D. (1963). Sound and people. Canadian Building Digest, 41, 973-978.
- Núñez, R., & Sweetser, E. (2006). Looking ahead to the past: Convergent evidence from Aymara language and gesture in the crosslinguistic comparison of spatial construals of time. Cognitive Science, 30(3), 401-450.
- Oliva, A., & Torralba, A. (2001). Identifying the perceptual dimensions of visual complexity of scenes. International Journal of Computer Vision, 42(3), 145-175.
- Özcan, E., & van Egmond, R. (2008). Product sound design: An interdisciplinary approach. In Proceedings of the 4th International Conference on Design Research. Sheffield, UK: Sheffield Hallam University. Retrieved May 20, 2010, from http://shura.shu.ac.uk/drs2008
- Palmer, S. E. (1999). Vision science: Photons to phenomenology. Cambridge, MA: MIT Press.
- Rakova, M. (2003) The extent of the literal. Houndmills, UK: Palgrave Macmillan.
- Robertson, D., Davies, I., & Davidoff, J. (2000). Color categories are not universal: Replications and new evidence from a stone-age culture. Journal of Experimental Psychology: General, 129(3), 369-398.
- Shams, L., Kamitani, Y., & Shimojo, S. (2000). What you see is what you hear. Nature, 408(6814), 788.
- Schultz, T. J. (1978). Synthesis of social surveys on noise annoyance. Journal of the Acoustical Society of America; 64(2), 377-405.
- Simpson, J., & Weiner, E. (Eds.), (1989). The Oxford english dictionary (2nd ed.). New York: Oxford University Press.
- Stein, B. E., & Meredith, M. A. (1993). The merging of the senses. Cambridge, MA: The MIT Press.
- Sweetser, E. (1990). From etymology to pragmatics: Metaphorical and cultural aspects of semantic structure. New York: Cambridge University Press.
- Takeshima, H., Suzuki, Y., & Sone, T. (1991). Evaluation of steady noise from a multidimensional point of view. Journal of Sound and Vibration, 151(3), 519-528.
- Ullmann, S. (1963). Semantic universals. In J. H. Greenberg (Ed.), Universals of language (pp. 179-207). Cambridge, MA: MIT Press.
- Van Dale groot woordenboek Nederlands – Engels [Van Dale comprehensive Dutch – English dictionary allerlei] (4th ed.). New York: French & European.
- Van Der Helm, P. A. (2000). Simplicity versus likelihood in visual perception: From surprisals to precisals. Psychological Bulletin, 126(5), 770-800.
- Vroomen, J., Bertelson, P., & de Gelder, B. (2001). The ventriloquist effect does not depend on the direction of automatic visual attention. Perception and Psychophysics, 63(4), 651-659.
- Williams, J. (1976). Synaesthetic adjectives: A possible law of semantic change. Language, 52(2), 461-418.
- Wundt, W. (1904). Grundzüge der physiologischen psychologie [Principles of physiological psychology]. (E. B. Titchener, Trans.). London: Allen. (Original work published 1893).
