Comparing Thermographic, EEG, and Subjective Measures of Affective Experience During Simulated Product Interactions
1 School of Industrial Design, Swansea Metropolitan University, Swansea, UK.
2 Department of Psychology, Anglia Ruskin University, Cambridge, UK.
The affective experience of a stimulus has traditionally been studied by statistically correlating the Electroencephalogram (EEG) and Affective Self Report (ASR). Here, this method is extended into a three-way correlation by including measurement of changes in forehead temperature on the right and left sides using Infrared Thermography (IRT). Sixteen male undergraduate designers were given a cognitive task whilst simultaneous IRT and EEG measurements were conducted. Measures of Arousal and Valence were recorded along with an additional post-test measure of Task Engagement. Using a Pearson product-moment correlation coefficient, the initial results exhibited inconclusive evidence of triangulation between the three methods, although a strong positive association was established between changes in forehead temperature and changes in total EEG activity. Further analysis revealed that the sample group was complex: half displayed higher temperatures on the right side and half displayed higher temperatures on the left side throughout the test. Analysis of these smaller groups revealed significant correlations between IRT, EEG, and ASR. The results support the view that IRT has potential use in the measurement of cognitive work and affective state changes during user-product interactions and suggest that further work is required to establish a more definitive relationship between forehead temperature dynamics and affect.
Keywords - Infrared Thermography, Affect, Interaction, Experience, Design.
Relevance to Design Practice - Thermal imaging offers design researchers a highly accurate, non-contact, and objective measurement tool for exploring the dynamics of user’s affective state during user-product interactions. This modality can add depth to our understanding of the nature and quality of user experience and provide useful visual and statistical data for designers.
Citation: Jenkins, S. D., Brown, R. D. H., & Rutterford, N. (2009). Comparing thermographic, EEG, and subjective measures of affective experience during simulated product interactions. International Journal of Design, 3(2), 53-65.
Received February 26, 2009; Accepted July 17, 2009; Published August 31, 2009.
Copyright: © 2009 Jenkins, Brown, & Rutterford. Copyright for articles published in this journal is retained by the authors, with first publication rights granted to the International Journal of Design. All journal content, except where otherwise noted, is licensed under Creative Commons Attribution-NonCommercial-NoDeriv 2.5 License. By virtue of their appearance in this open-access journal, articles are free to use, with proper attribution, in educational and other non-commercial settings.
*Corresponding Author: sean.jenkins@smu.ac.uk
Introduction
There is a need for design researchers to move beyond the limitations of subjective interpretations of ‘design and emotion’ and explore the use of new tools and multi-modal methods in the objective measurement of human experience. Love (2004) identifies epistemological contradictions in design theory and proposes that a research programme based on a developing understanding of physiological processes in human cognition, action, and intent is required to further underpin research in this field. Furthermore, the ‘State of the Art’ report from the ENGAGE Consortium (2005) identifies a need for more “robust” and “statistical” methods to underpin the understanding of user-product interaction which “will require theoretical deepening and instruments that enable capture of the richness and dynamics of product experiences.”
Currently, subjective self-report methods are a commonly used tool in design research and a number of techniques have been developed to quantify and qualify user-product interactions across the broad field of Industrial Design (See the tools and methods section of the knowledge base at www.designandemotion.org for a comprehensive list). Many of these tools have been developed specifically to assist designers in the development and evaluation of ‘emotional’ design. Several utilise visual methods of communication and recording, avoiding some of the issues inherent in the conventional ‘questionnaire’ format and providing more appealing data for designers. However, their main limitations in the exploration of user-product interaction are that they do not provide objective measurements and they cannot capture the real-time dynamics of the experience. Their accuracy has often been questioned because these tools are subjective; the results being dependent upon each individual subject’s (1) perception of the experience and its context and (2) ability to interpret and express their feelings.
There are two further challenges for design researchers exploring emotions in user-product interactions. First, the multiplicity of products and differing scenarios of use generate a complex variety of interactions eliciting complex and highly variable responses. Secondly, it is difficult to define what it is that is actually being experienced. There are two dominant views on the structure of emotions: the specific affects approach and the dimensional approach. The specific affects approach (Plutchick, 1980) focuses on core emotions, such as happiness, surprise, anger, disgust, sadness, and fear. It proposes that these primary emotions can be experienced individually, in isolation, or that they can be blended to create secondary emotions, providing a much wider spectrum of affective experience. The ‘dimensional approach’ (Russell, 1980) provides an alternative to this by positing the notion of ‘core affect,’ which consists of a blend between valence (the subjective perception of the experience as positive/negative) and arousal (the degree of physiological change from low/high). To investigate these competing views, it is therefore essential that a more diverse range of methods and tools be developed and employed within design and emotion research.
Recent theories in the field of neuroscience propose that emotions play an essential part in our cognitive processes and decision making (Bechara & Damasio, 2005). These developments have identified the importance of the role that the body and our ‘sense’ of our body may play in defining our conscious mind and sense of ‘self.’ These theories relate emotion, feeling, and consciousness to the body and state the significance of the physiological and neurological somatosensory systems that monitor and control its stability (Damasio, 2000). The suggestion that emotion is a key part of the mechanism of homeostasis and that this mechanism is in turn pivotal in shaping our experience of the world around us is an important one in relation to the further development of tools for the objective measurement of affective experience. The human body is a thermo-regulatory system and human skin, the largest organ, plays a key role in the regulation of body temperature. Regional skin temperature dynamics reflect the internal condition of the body and have been used extensively in medicine to study and monitor the health status of the individual. On this basis, it is possible to hypothesise that change in temperature dynamics may also be a reflection of a change in the affective status of the individual as the body attempts to maintain homeostasis. Furthermore, it is proposed that Infrared Thermography (IRT) may be used as a novel tool to capture and analyse these physiological changes for use in design research as an objective measure of user-product interaction.
The experiment reported in this paper explores the efficacy of IRT as an accurate, non-contact measurement tool for studying user affective experience during product interaction. At this stage, the aim of the research project is to establish that it is possible to use IRT to measure changes in affective state, not specific emotions, as core affect theory has a strong conceptual link with the mechanism of homeostasis. This will be achieved by correlation with frontal Electroencephalogram (EEG) and Affective Self Report (ASR), which are established methods reported to measure affective state change.
Physiological Measures of Affect
There are a variety of methods used to measure response to emotional stimuli in psychological research studies; skin conductance (Electrodermal response, EDR or Galvanic Skin Response, GSR), cardiac function (Electrocardiogram, ECG), heart rate (HR), respiration, blood pressure (BP), facial musculature (Electromyogram, EMG) and more recently, gastric myoelectrical activity (Electrogastrogram, EGG). Recent studies have identified that combinations of such metrics may provide a feasible method for developing products that could measure and respond, for example, to levels of stress in the user (Healy & Picard, 2005). Furthermore, EEG and the advanced imaging technique of Functional Magnetic Resonance Imaging (fMRI) have been used by researchers in the cognitive neurosciences to observe brain activity while cognitive tasks are taking place. Research methods focus on the measurement of specific Autonomic Nervous System (ANS) activity (Christie & Friedman, 2004), and there is increasing evidence of ‘emotional patterning’ in ANS activity relating to specific affective states (Vianna & Tranel, 2005). It is of particular significance for this research work that measures relating to vascular activity, particularly HR and BP (Waldstein et al., 2000), are ‘tried and tested’ metrics and have been used in parallel with Electroencephalogram (EEG) measures.
The EEG has been defined as the difference in voltage between two recording locations plotted over time (Fisch, 1999) and is generated by the cortical pyramidal cells with the postsynaptic potentials from these cells forming an extracellular dipole layer. The EEG records the potential that is directed towards the scalp through a conductive paste and the electrodes that are placed on the surface of the scalp. The main drawback of EEG and other similar techniques is their varying levels of invasiveness; i.e., contact or interference with the subject’s body, which place limitations on experimental methods particularly when exploring user/product interaction. IRT is a highly accurate non-contact method of measuring changes in skin temperature arising from vasodilation and constriction (Ring & Ammer, 2000). It is proposed that this method may be sensitive enough to be used as an objective measure of a subject’s affective response to designed stimuli.
Infrared Thermography
Infrared Thermography is a technique used to visualise and measure infrared radiant energy. Infrared radiation is part of the electromagnetic spectrum. It has the same speed as visible light but occupies a space on the spectrum at a longer wavelength, which makes it invisible to the naked eye. IRT cameras contain sensors highly sensitive to this part of the spectrum and are capable of radiometric (temperature) measurements while recording digital video and still images. All objects with a temperature above absolute zero emit thermal energy in the form of infrared radiation, and all objects absorb infrared radiation from the surrounding environment. Different materials emit different amounts of thermal radiation, the efficiency with which an object emits infrared radiation is known as emissivity. A theoretical blackbody has an emissivity of 1.0, and all real materials exhibit emissivity values as fractions of this. It is known that human skin is a highly effective emitter and has an emissivity of .98 (±.01), which is a key advantage in the use of IRT for human temperature measurement.
In recent years, technological improvements in thermal imaging cameras (Figure 1) have considerably advanced the application of thermography in a variety of fields, ranging from medical and engineering applications, such as condition monitoring to police surveillance and screening for infectious diseases at airports. Modern cameras have high levels of thermal sensitivity and spatial resolution and are more affordable, portable and robust (hand-held or tripod mounted versions are available). Their associated software packages contain a variety of advanced tools for real-time and post-event visual and statistical analysis of both still images and video sequences. It is developments in medical research and diagnosis that provide some of the most important empirical knowledge for transfer to this design research project. The repeatability and reliability of thermal imaging is an area of key concern in medicine, and appropriate standards have been established to produce reliable and valid results (Ring & Ammer, 2000; Ring et al., 2007).
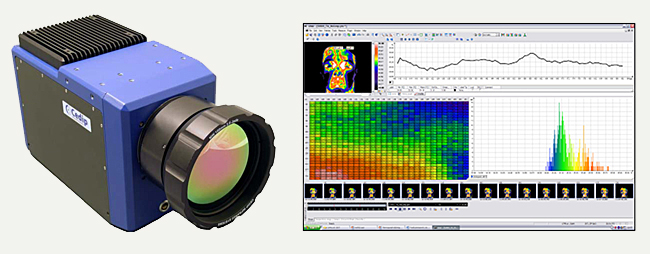
Figure 1. Cedip Titanium 560M mid-wave (3.6 - 5.1µm) camera and ALTAIR software.
Exploration of the use of thermal imaging in the analysis of human interaction with products has been limited to the physical level, for example user comfort studies (Ring, Hawkes, Elvins, & Jones, 1995; McLoone, Jacobson, Adams, & Johnson, 2000). There is no evidence of its use to analyse other facets of human-product interaction, specifically changes in affective state. Thermography has been widely used in medical and ergonomic research to analyse various physical conditions, but there is little information relating to its application in psychophysiological studies, particularly in studies of emotion. Recently researchers have begun to explore IRT’s potential as a method of monitoring levels of frustration during Human Computer Interaction (Puri, Olson, Pavlidis, Levine, & Starren, 2005) and to study extreme physiological changes evoked by stress or fear inducing stimuli (Merla & Romani, 2007). A common factor in this recent body of work is the focus of facial vasculature and its links to ANS activity. Furthermore asymmetry in facial blood flow and temperature has been linked to differential hemispheric influence of the brain on the expression of emotion (Benedicic, Dolenc, Stefanovska, & Bosnjak, 2006).
Recently published work by the authors outlined a preliminary investigation into the potential use of IRT as an accurate, non-contact measurement tool for use in studying user experience during product interaction (Jenkins, Brown, & Donne, 2007). This work demonstrated that there were significant changes in forehead temperature dynamics of subjects engaged in puzzle-solving activity and that these can be accurately measured using IRT. Based on theories positing a relationship between vascular blood flow of the head and affective state (Adelmann & Zajonc, 1989; McIntosh, Zajonc, Vig, & Emerick, 1997; Zajonc, 1985; Zajonc, Murphy, & Inglehart, 1989), the premise of this work was that the observed temperature changes at the Regions of Interest (ROI) on the forehead arise from a combination of cognitive and emotional psychophysical effects. Puzzle-solving was selected as it could be viewed both as a representation of the activity of designing and of interaction with a complex product; both requiring a degree of cognitive work, physical action, and affective state change.
In validating the efficacy of IRT as a measurement tool for the analysis of affective experiences during user/product interaction, it is important to establish a correlation between other accepted measures used in emotion research. If a relationship can be established between IRT and EEG, it would further support the proposal that forehead temperature dynamics are a reflection of internal ‘states of mind.’ Frontal EEG in combination with ASR is an established method of measuring both emotional and cognitive functions. Furthermore, there is a substantial body of scientific literature exploring the relationship between frontal EEG asymmetry and self reports of emotion, which provides a useful framework for evaluating the IRT findings (Allen & Nazarian, 2004; Cacioppo, 2004; Davidson, 2004). Like EEG, IRT can provide a record of change in the subject’s state in real time; therefore, comparisons can be made between modalities both as a function of time and in relation to known patterns of frontal cortex activity as a correlate of affective state. Many studies have related left side activation to positive emotions and approach behaviours, and right side activation to negative emotion and withdrawal behaviours (e.g., Coan & Allen, 2004). It is proposed that the established method of using EEG and ASR is extended to a three-way statistical correlation including IRT. The experimental method focuses on the comparison of these different measurements for the same stimulus rather than responses evoked by different stimuli. Successful triangulation between these modalities will support the assertion that IRT can provide a robust instrument to deepen our understanding of product experiences.
Experimental Method
The experimental procedure (Figure 2) consisted of three main stages: (1) preparation and acclimatisation of the subject, (2) baseline measurement and (3) test condition measurement.
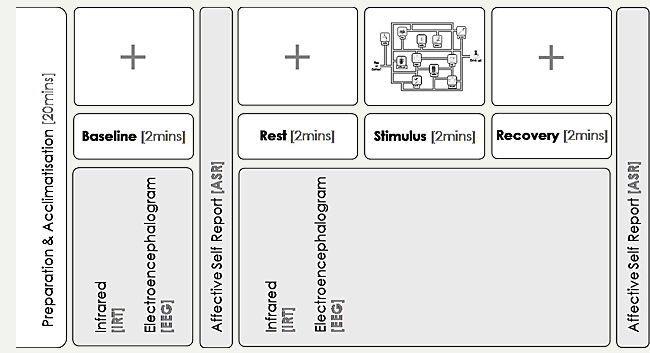
Figure 2. Experimental procedure.
Experimental Procedure
Sixteen male volunteers (mean age=21.75 years) from the undergraduate degree portfolio at the School of Industrial Design participated in the experiment, which had been approved by the University ethics committee. All subjects were fully briefed and signed a consent form prior to their participation in the experiment. Biographical and anthropometric data were recorded before beginning the experiment. Each subject was then seated in a comfortable, high-backed chair facing an 18” TFT display and a thermal imaging camera (Figure 3). The repeatability and reliability of thermal imaging is an area of key concern in medicine and appropriate quality standards have been established to produce reliable and valid results (Ring et al., 2007). Due cognisance has been given to these recommendations for good practice in this research work. A period of ten minutes was allowed for briefing the subjects and application of scalp electrodes for EEG measurement; a further ten minute period was allowed for acclimatisation to the ambient conditions of the test environment and the experimental equipment.
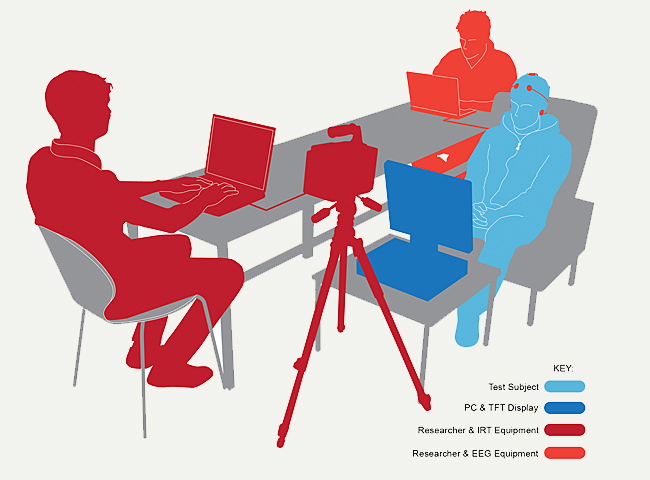
Figure 3. Experimental set-up.
Experimental Stimulus
A key issue in the development of the experimental method was the format for the experimental stimulus. A variety of techniques have been used in psychophysiological studies to elicit an emotional response; however, there is evidence to suggest that stronger affective responses are elicited when subjects are required to engage in personal recall tasks (Waldstein et al., 2000). Also, recently published models of user-product interaction refer to three types of interaction with products: Instrumental, Non-Instrumental, and Non-Physical (Desmet & Hekkert, 2007). They suggest that, at the non-physical level, thinking about or anticipating use may stimulate affective response. Due to the experimental limitations of EEG, specifically the interference created by physical movement of the subject, it was decided to restrict the variables that instrumental interaction may introduce and focus on the non-physical level of interaction by simulating ‘thinking about’ using products to perform a task.
The test stimulus consisted of a modified version of the ‘Zoo Map Test,’ which is part of a battery of psychological tests (BADS – Behavioural Assessment of the Dysexecutive Syndrome) (Wilson, Alderman, Burgess, Emslie, & Evans, 1996) designed to assess executive function. It was specifically selected because it has been shown to have good ecological validity in that the ability to perform well on the task was found to be correlated with not only subjective reporting of executive symptoms (Burgess Alderman, Evans, Emslie, & Wilson, 1998) but also a further test of executive function that is conducted in a real-life setting (Alderman, Burgess, Knight, & Henman, 2003). Subjects are required to formulate a route around a map of a fictitious zoo, without contravening a set of rules. A common everyday activity – making a hot drink – was selected to replace the zoo scenario to ensure there would be a high degree of familiarity for test subjects and to incorporate the simulation of using products. The variation designed for this experiment required the subject to read the instructions on-screen (see below), visualise using the depicted products to perform the activity, and formulate a route accordingly. Although certain rules were stipulated, subjects were able to formulate their plan independently. This was intended to create a higher demand condition and allow a degree of flexibility so each individual’s schema for the task was influential. Subjects were asked not to verbalise their thoughts and to trace out their route on the map in their mind as it was presented on screen (Figure 4). This ‘map’ was designed to prompt a higher degree of engagement than simply presenting a collection of images of objects which had been explored in earlier trials. It was hypothesised that the map stimulus would stimulate a cognitive activity by demanding the subject’s active consideration of their interactions with the products presented on the map. Based on the theory proposed by Damasio (2000), discussed earlier, it was expected that such a task would elicit a change in the affective state of the subjects. The test comprised a two-minute rest period, followed by a two-minute period of stimulus presentation, followed by a further two-minute recovery period. The on-screen instructions were as follows:
Tea or Coffee? Imagine you are going to make a hot drink for yourself…
- Look carefully at all the objects below and plan a route on the map from start to finish.
- Think carefully about the order you would use the objects to make either a cup of tea or coffee.
- Visualise how you would use them to make your chosen drink.
You may decide which drink you would prefer but you must obey the following rules:
- If you choose to make a cup of tea you must use the teapot only. If you choose to make a cup of coffee you must use the coffee pot only. You must use all the other objects.
- You must add milk and sugar. You may use the spoon as many times as you like.
- Take your time. If you finish and the image is still on screen, choose the other drink and repeat the task.
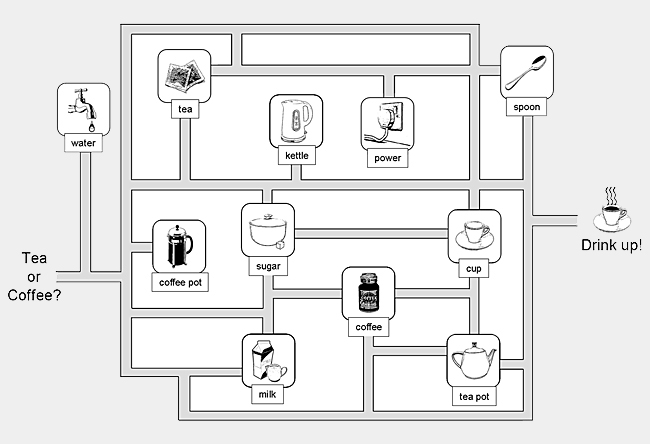
Figure 4. ‘Map’ test stimulus.
Affective Self Report (ASR)
The complications of trying to elicit and identify distinct emotions have already been stated and the compatibility of core affect theory and the mechanism of homeostasis has been identified; it was therefore considered to be a more appropriate strategy to focus on general changes in affective state during this experiment, as the primary concern is to establish if there is a correlation between IRT and the more established methods of EEG and ASR.
Several studies of emotion combining physiological and self-reporting methods (Vianna & Tranel, 2005; Christie & Friedman, 2004; Neumann & Waldstein, 2001) were considered in the design of the Affective Self Report (ASR) measures for this experiment. A number of approaches have been used in these studies including discrete emotions and dimensional models of affect. Furthermore, Desmet and Hekkert (2007) describe a hybrid model combining product specific emotions and the dimensions of arousal and valence.
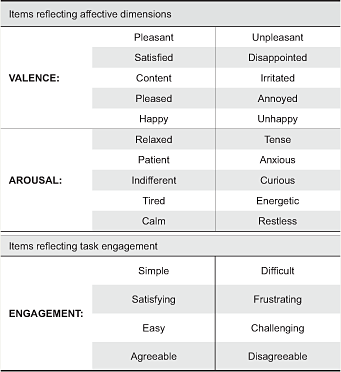
The ASR measures of the Arousal and Valence dimensions were recorded using two five-item scales. Waldstein et al. (2000) have used an additional measure of Task Engagement when comparing EEG and other physiological measures with emotional recall tasks. Therefore, an additional four-item scale for the level of Engagement with the task was incorporated into the post-test questionnaire. Table 1 lists each item which comprised a bi-polar pair of adjectives selected from the previously mentioned literature. Subjects were asked to place a mark on a 10 cm line indicating how they felt at that time, the position of each mark was measured to provide a raw score (e.g., 6.3 cm = score of 63). A baseline measure was recorded after acclimatisation and immediately before the test conditions were implemented. A second measure was recorded immediately after the test was complete. Mean scores for each scale were calculated. Baseline scores were subtracted from the post-test scores to provide a measure of each individual’s perceived affective state change for Arousal (∆A) and Valence (∆V).
Table 1. ASR Scales. Items were counterbalanced and randomized.
EEG Equipment and Protocols
Frontal EEG data was recorded from specific locations according to the International 10-20 electrode placement system. The locations for the scalp electrodes were F3 and F4; the reference electrodes were placed on each ipsilateral earlobe, A1 and A2; and a ground electrode was placed at Cz (Figure 5). Impedances were below 5kΩ. The hardware used to record the EEG was a NeuroAmp, with a data acquisition rate of 1000 samples per second and a sampling rate of 250Hz.
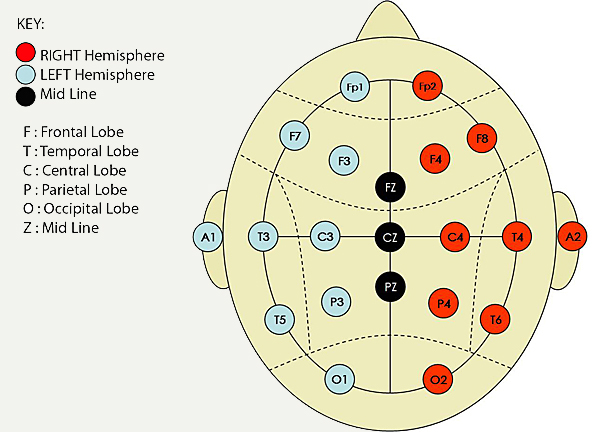
Figure 5. International 10-20 electrode placement system.
IRT Equipment and Protocols
An internally cooled Cedip Infrared Systems Titanium 560M camera with a 25mm (FOV 21°) optical lens was used in the experiment. The camera has a 640x512 pixel / 14 bit detector focal plane array and is capable of capturing images at a maximum full frame rate of up to 380Hz. The camera’s Indium Antimonide (InSb) sensor is highly sensitive to the medium wave infrared spectral band (3.4 – 5 µm) with a thermal sensitivity of 25mK (0.025°C) at 25°C and spatial resolution 1.1mRad. The camera was connected to a laptop via a Camlink interface for digital video capture at a rate of two frames per second at 320x256 pixels. Research has suggested that reactions to extreme stimuli inducing stress or fear can produce amplitudes of temperature change from 0.1°C to several degrees on the face with a velocity of 0.05°C -2°C/minute (Markov and Zakharov, 1995). Previously cited experimental work conducted by the authors confirms that the selected sampling rate provides adequate temporal resolution for recording trends in facial temperature change induced by a cognitive task. The images were directly acquired and subsequently analysed using Cedip’s Altair v5.8 software. Motion compensation was undertaken in a post processing module. The thermal imaging camera was situated at eye level directly in front of the subjects at a fixed distance of 1.5m.
A flexible plastic template with a grid of holes at 5mm intervals was used together with a metallic ink pen to ‘mark-up’ the subject’s forehead. The metallic ink would be visible in the thermal images due to its different emissivity properties. Eight reference points were marked to provide targets for post-process motion compensation and ensure accurate and consistent positioning of measurement tools defining Regions of Interest (ROI) in subsequent thermal image analysis. To accommodate the anthropometric variation in forehead dimensions the same method was used for each subject: the centreline of the forehead was defined with two points, one positioned just above the nasion - a recessed point between the forehead and nose – to a point below the hairline. The outer edges of the eyes were used to define a further set of three vertical reference points on each side of the forehead indicating the pronounced transition in surface plane direction of the forehead (frontal bone) along the temporal line. This demarcation ensured that the ROI’s were placed on anterior surfaces only during analysis. The mean temperature of the Right and Left ROI’s were used to produce timing graphs of temperature change over the 320-second (720 frames) sequence. Figure 6 below shows how the temperature scales of the thermal images were ‘squeezed’ to a 2° C span to highlight temperature distribution across the forehead.

Figure 6. Thermal images indicating ROI’s. Gray scale and ROYGBIV colour palettes were used.
Results and Discussion
The mean of the baseline signals was subtracted from the mean of the test signals for both IRT and EEG to provide a measure of state change for right (ΔTR and ∆ER) and left sides (∆TL and ∆EL). Correlations were calculated only for the same hemispheres; for example, ∆TR was correlated with ∆ER but not with ∆EL. Asymmetry was calculated by subtracting the left from right (ΔTR-∆TL and ∆ER-∆EL). The Pearson product-moment (r) correlation was used in the analysis of the data obtained from simultaneous measurements of IRT and EEG signals followed by ASR scores across the sample group in response to the same stimulus. Levels of significance for a two-tailed test were used as no assumptions were made about the direction of change in the test measures.
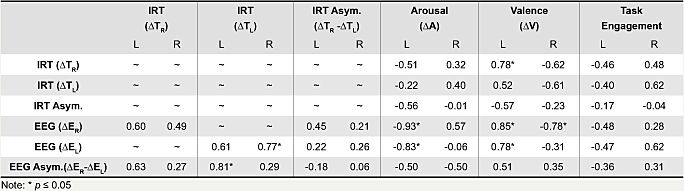
A summary of the correlations provided by the preliminary statistical analysis of the IRT, EEG, and ASR data for the sample group (N=16) is given below (Table 2).
Table 2. Summary of triangulation results
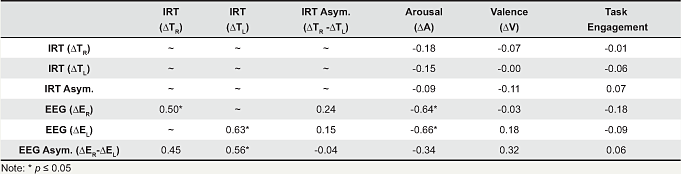
The results of the linear correlation carried out for IRT and EEG indicate a strong positive association between change in temperature (ΔT) and change in total EEG (∆E) activity from baseline to test condition. A significant positive correlation was observed for both the right and left sides (Right: r = 0.50, N=16, p ≤0.05; Left: r = 0.63, N=16, p ≤0.01). A positive relationship was observed between EEG Right/Left asymmetry and change in temperature which was significant for the left hemisphere (Left: r = 0.56, N=16, p ≤0.05). No correlation was observed between IRT Right/Left asymmetry and EEG signals for the sample. IRT shows no significant correlation with the individual dimensions of Arousal, Valence, or Task Engagement within the sample group.
The results also suggest a strong negative correlation exists between change in total EEG activity and the self-reported measure of change in Arousal (∆A) for both the right and left hemispheres (Right: r = -0.64, N=16, p ≤0.01; Left: r = -0.66, N=16, p ≤0.01). However, closer analysis of the data indicated that these correlation values may have been heavily influenced by a potential outlier whose ASR score for Arousal is more than two standard deviations away from the mean (Figure 7). The integrity of the data set has been retained. If the outlier had been excluded from the data set, this apparent negative relationship would no longer be significant. Interestingly, this would also have increased the level of significance of the previously observed relationship between IRT and EEG (Right: r = 0.55, N=16, p ≤0.01 Left: r = 0.82, N=16, p ≤0.001). There was also no apparent relationship between EEG (ΔER and ∆EL) and Valence (ΔV) or Task Engagement. EEG Right/Left asymmetry also shows no significant association with the self-reported measures.
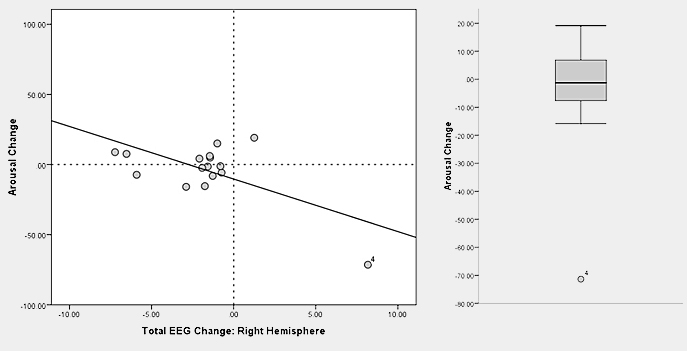
Figure 7. Scatter and box plots indicating a potential outlier and its effect on the relationship between ∆ER (µ) and ∆A.
These initial results indicate a lack of any significant correlation between IRT and EEG with the individual dimensions of Arousal, Valence, or Task Engagement. This shows that triangulation between the three modalities has been inconclusive for the sample group. However, continued exploration of the data indicated the existence of two distinct groups within the sample which were defined by their temperature asymmetry. Eight of the sample group displayed a higher temperature on the right side; seven displayed a higher temperature on the left side and one showed only a slightly higher temperature on the left side throughout the test. Arising from this observation of the makeup of the original sample group, further statistical analysis of the IRT, EEG, and ASR data for the Left and Right temperature dominant sub-groups (N=8) was undertaken and is summarised below (Table 3). For the purpose of the analysis, the subject exhibiting only slight left dominance was included with the left dominant group.
Table 3. Summary of triangulation results - LEFT and RIGHT temperature dominant sub-groups
The positive associations observed between IRT and EEG measures for the original sample of sixteen remain evident within the smaller sub-groups. Comparison of the correlations for IRT, EEG, and ASR scores between the original sample (Table 2) and the subgroups (Table 3) show a marked increase in size. The correlations for the sub-groups indicate a more complex relationship exists between IRT and EEG asymmetry and reported affective experience. To illustrate this effect, a comparison was made of the three scatter plots in Figure 8 depicting the relationship between change in temperature (∆TR) and change in Valence (∆V). No significant correlation was observed between these variables for the total sample group (r = -0.07, N=16). However, if the two groups are considered separately as in the smaller scatter plots, the Left Dominant Group exhibits a strong positive relationship between temperature change on the right hemisphere and Valence (Right: r = 0.78, N=8, p ≤0.05) and the Right Dominant Group exhibits a negative relationship (Right: r = -0.62, N=8, p ≤0.10). It appears that the two groups are counterbalanced and have essentially cancelled each other out in the original correlations.
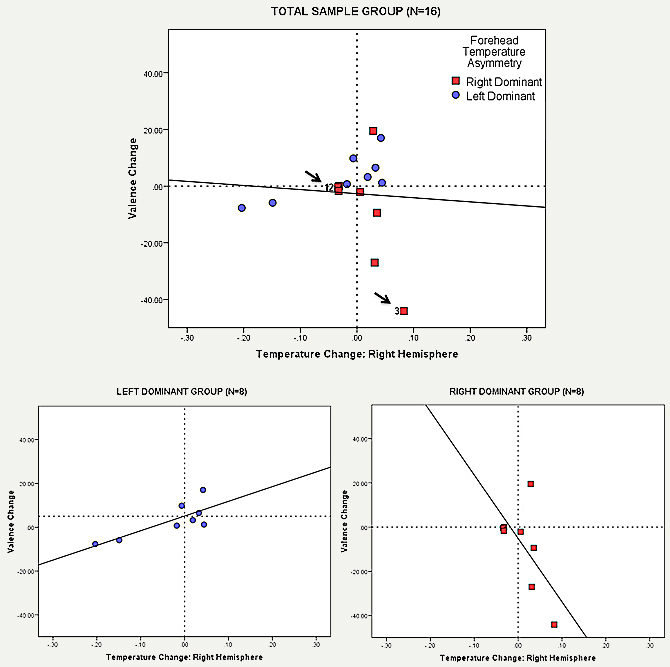
Figure 8. Relationship between ∆TR (°c) and ∆V for the Right and Left dominant sub-groups.
As previously stated, both IRT and EEG measurements showed no significant correlation with the ASR scores across the sample group as a whole. Comparison of the sub-groups (Table 3) indicates the relationship between IRT and Valence and EEG and Valence are the same. The data suggests that the Left Dominant Group exhibits strong positive associations and the Right Dominant Group exhibits strong negative associations. Previously discussed literature on EEG and emotion relates lateralised right/left hemisphere EEG activity to negative/positive experience. Therefore, the similarity in IRT correlations with those of EEG and Valence suggests that IRT is measuring similar effects. The strong negative association between right and left EEG and the Arousal measure for the Left Dominant group may be less reliable than the correlation coefficients suggest. Visual analysis of the data point spread on a scatter plot for these correlations indicates the possible outlier identified in the main sample is influencing the strength of the observed effect.
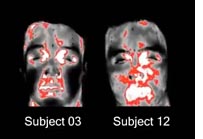
Analysis of the sample did indicate pronounced increase in temperature when subjects reported greater negative valence and increased arousal and task engagement. The timing graphs and self-reported scores below (Figure 9) are illustrative of this observation. Subject 03 and Subject 12, whose relative positions on the scatter plot are indicated in Figure 8 above, provide good exemplars of the comparative differences in temperature trends at the ROI and reported experience. In the case of subject 03, a marked increase in temperature was also paralleled by increased Arousal, negative Valence and a high degree of Task Engagement. Those subjects that exhibited more stable temperature profiles, such as subject 12, also demonstrated a greater degree of stability in ASR and EEG measures.
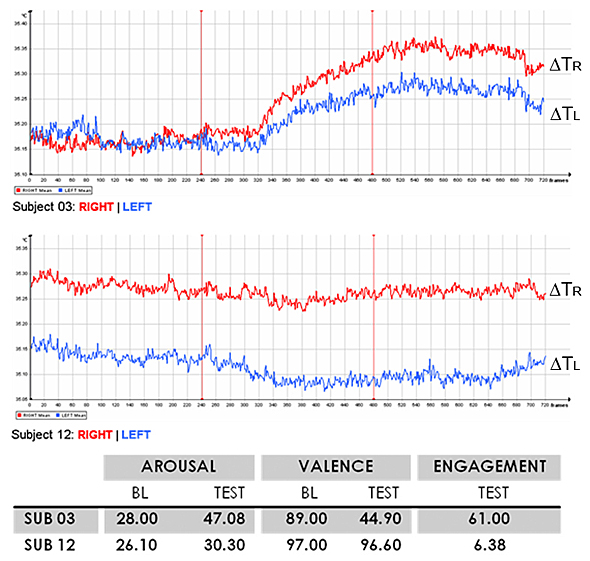
Figure 9. Comparison of temperature trends and raw ASR scores for subjects 03 and 12.
These examples demonstrate noticeable asymmetry in temperature and raw EEG signals, although no linear correlation was observed between these variables within the original sample. However, it is clear in the example of subject 03 that although both right and left temperatures follow the same trend, the right side shows a greater relative increase. This does parallel those previously identified traits in frontal cortex activity for negative affect. This comparison exemplifies the positive correlations between IRT and EEG measures established in the statistical analysis and also indicates a potential relationship between temperature dynamics and the nature and intensity of affective experiences.
Visual comparison of the changes in temperature distribution of the forehead for subjects 03 and 12 further exemplify that there is a relationship between temperature dynamics and change in affect. Figure 10 illustrates the differences in forehead temperature distribution between pre and post test conditions for the selected subjects and can also be viewed in the supplementary video file. Temperature scales in the images have been ‘squeezed’ to a 2°C span [34-36°C], with the red isotherms defining the 35.5 – 35.75°C range to highlight regions of change.
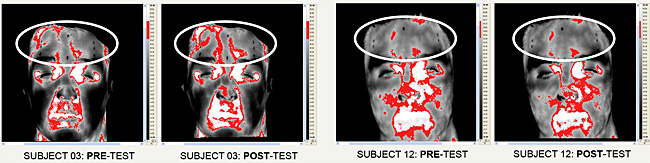
Figure 10. Visual comparison of changes in temperature distribution for subjects 03 and 12.
In light of the observations stated and with regard to the previously discussed proposal of Damasio’s that emotion is an integral part of cognition and homeostasis, it is possible to make several reasonable assumptions on which further research questions can be based.
- The strength of an individual’s response to a stimulus (positive or negative) may be reflected in the degree of measurable forehead temperature change; that is
- A neutral response to a stimulus may be characterised by a steady thermal state.
- A strong response to a stimulus may be characterised by a change in thermal state.
- Forehead temperature asymmetry may be strongly associated with underlying frontal EEG asymmetry in an individual. Since frontal EEG asymmetry is regarded as a mediator and/or moderator of emotional states/traits, it is likely that IRT measurements reflect this emotional status.
- ASR is subjective, dependent on an individual’s sensitivity to his/her own ‘feelings’ as well as their understanding of the constructs they are being asked to report on. The results show that where there is significant change in temperature, there is also significant change in reported affective state. This suggests that ASR may require strong physiological changes for conscious awareness and accurate report. Thus the degree of change in temperature measured by IRT could provide an objective measure of the intensity and duration of the evoked response.
The intention of future research is to try and substantiate the above points. To achieve this end the relationship between IRT and EEG asymmetry clearly requires more investigation. Raw EEG activity is a reflection of overall brain activity (in this case 2 – 38 Hz) and does not provide a detailed measure of emotional state. Further comparison is required between IRT signals and the different component frequencies of EEG activity to add depth to our understanding of this relationship. The experimental techniques reported in this paper have used anatomical sites identified in earlier work of Zajonc, which appear to be linked to the vascular activity of the Supraorbital and Supraochlear vessels at the forehead. Recent work of previously cited researchers, such as Puri et al. and Merla et al., suggests alternative facial ROI’s which may also warrant further investigation.
Conclusions
The objective of the experiment described in this paper was to establish if any relationship existed between IRT, EEG, and ASR measures during a cognitive task. This was intended to further investigate IRT’s potential as a measurement tool for design and emotion research. A task was selected for the experiment for its ecological validity, as well as to restrict variables and limit any artefact that may occur in the EEG measurements. The task was modified to enhance its relevance to design and to focus on the suggested ‘non-physical’ domain of user-product interaction. The underlying theories supporting this research posit the view that emotion is vital to our cognitive processes and a key component of our body’s mechanisms for maintaining homeostasis. The task was intended to simulate the cognitive processes that would occur while thinking about using products to perform an everyday activity; for example, the processes of planning, problem solving, recall, and visualisation. Based on the underlying theories, it was hypothesised that the task would also stimulate an affective state change in the subjects, which could be measurable by self-report and would provide a further test of the sensitivity and validity of IRT.
The results presented demonstrate that there are strong positive correlations between changes in forehead temperature and changes in total EEG activity for the total sample group. On first analysis, no significant associations were observed between IRT, EEG and ASR measures for the sample; however, it became apparent that the sample was complex in its composition. Noticeable differences in temperature asymmetry traits were observed, indicating the apparent existence of two dominant ‘types’ within the sample. Subsequent analysis of these two sub-groups demonstrated correlations between IRT, EEG and some ASR measures that had previously been obscured or ‘cancelled out’ by the contradictory responses of the sub-groups. An interesting conclusion that can be drawn from this is that it may be possible to define a scale of response based on extremes of Right/Left temperature asymmetry for categorising user/product interactions. The current study is limited by the size of the sample groups resulting from this division, so further experimental work is required with larger sample groups. In this way, increased confidence in the conclusions being drawn will be obtained and the effect of apparent anomalous responses will be reduced.
The literature suggests that a strong relationship exists between frontal EEG asymmetry and emotion. The results indicate that IRT measurements are reflective of total EEG activity, and it is noticeable that in those cases where the task triggered a significant affective change there was a pronounced change in temperature. This supports the hypothesis that forehead temperature dynamics may reflect changes in the internal status of the individual, and as such these changes may be used by design researchers as a measure of a user’s affective experience during product interaction.
It is also important to note that EEG’s sensitivity to movement limited the experimental stimulus to the non-physical level of interaction. Physical levels of user/product interaction bring additional somatosensory systems into play which, on the basis of current theories in neuroscience, can be assumed would add to the intensity of the individual’s experiences. The confirmation of the relationship between IRT and EEG measurements would allow future work to concentrate on non-contact measurements made solely by IRT.
The work presented adds further momentum to establishing the viability of IRT as a tool for studying user-product interactions. This experiment and the earlier trial reported by the authors demonstrates the viability of using IRT to study interactions with types of products and systems where the user adopts a moderately static position. For example, such scenarios may include driving a car, playing a video game, using a mobile phone, or browsing the web using a desktop computer or hand-held device. One of the key benefits IRT offers design researchers is the technique facilitates continuous real-time measurement enabling the dynamic nature of user-product interactions to be captured and analysed in detail. At the moment there are limitations to the degree which current hardware and software can compensate for motion or track the target subject and specific regions of interest; therefore it may not be possible to use these continuous measurement methods with certain types of products that demand gross degrees of movement during interactions. However, the experimental method could easily be modified to accommodate this by using pre/post event sampling techniques rather than continuously monitoring changes in state. Examples of this method of utilising IRT for ergonomic studies on the physical effects of product design on users have already been cited and are proven to be effective. The link established with EEG activity clearly demonstrates IRT’s potential for use in design usability research. Future work is intended to explore the causal relationships between facial temperature dynamics, cognitive demand and affective experiences.
Acknowledgements
The thermal imaging system used in this experiment is a facility of Swansea Metropolitan University’s Non Destructive Testing Research Centre, which is supported by the Knowledge Exploitation Fund.
References
- Adelmann, P. K., & Zajonc, R. B. (1989). Facial efference and the experience of emotion. Annual Review of Psychology, 40, 249-280.
- Alderman, N., Burgess, P. W., Knight, C., & Henman, C. (2003). Ecological validity of a simplified version of the multiple errands test. Journal of the International Neuropsychological Society, 9(1), 31-44.
- Allen, J. J., & Nazarian, M. (2004). Issues and assumptions on the road from raw signals to metrics of frontal EEG asymmetry in emotion. Biological Psychology, 67(1-2), 183-218.
- Bechara, A., & Damasio, A. R. (2005). The somatic marker hypothesis: A neural theory of economic decision. Games and Economic Behaviour, 52(2), 336-372.
- Benedicic, M., Dolenc, V. V., Stefanovska, A., & Bosnjak, R. (2006). Left-right asymmetry of the facial microvascular control. Clinical Autonomic Research, 16(1), 58-60.
- Burgess, P. W., Alderman, N., Evans, J. J., Emslie, H., & Wilson, B. A. (1998). The ecological validity of tests of executive function. Journal of the International Neuropsychological Society, 4(6), 547-558.
- Cacioppo, J. T. (2004). Feelings and emotions: Roles for electrophysiological markers. Biological Psychology, 67(1-2), 235-243.
- Christie, I. C., & Friedman, H. (2004). Autonomic specificity of discrete emotion and dimensions of affective space: A multivariate approach. International Journal of Psychophysiology, 51(2), 143-153.
- Coan, J. A., & Allen, J. J. (2004). Frontal EEG asymmetry as a moderator and mediator of emotion. Biological Psychology, 67(1-2), 7-49.
- Damasio, A. R. (2000). The feeling of what happens. Body, emotion and the making of conciousness. London: Vintage.
- Davidson, R. J. (2004). What does the prefrontal cortex "do" in affect: Perspectives on frontal EEG asymmetry in research. Biological Psychology, 67(1-2), 219-233.
- Desmet, P., & Hekkert, P. (2007). Framework of product experience. International Journal of Design, 1(1), 57-66.
- ENGAGE Consortium. (2005). Designing for emotion: Report on the state of the art. Retrieved December 13, 2006, from http://www.designandemotion.org/society/knowledge_base/?root=36
- Fisch, B. J. (1999). Fisch and Spehlmann’s EEG primer: Basic principles of digital and analogue EEG (3rd ed.). New York: Elsivier.
- Healy, J. A., & Picard, R. W. (2005). Detecting stress during real-world driving tasks using physiological sensors. IEEE Transactions on Intelligent Transportation Systems, 6 (2), 156-166.
- Jenkins, S. D., Brown, R. D., & Donne, K. E. (2007). Infrared thermography in design research: The application of thermal imaging as a measurement tool in the design process. In P. Stebbing, G. Burden & L. Anusionwu (Eds.), Cumulus working papers: Schwäbisch Gmünd 18/07 (pp. 41-47). Helsinki: University of Art & Design Helsinki.
- Love, T. (2004). Beyond emotions in design and designing: epistemological and practical issues. In D. McDonagh, P. Hekkert, J. van Erp, & D. Gyi (Eds.), Design and emotion: The experience of everyday things (pp. 387-391). London: Taylor and Francis.
- Markov, A. G., & Zakharov, P. V. (1995). A speedy all-pupose system for dynamic IR-Thermography. In K. Ammer & E. F. Ring (Eds.), The thermal image in medicine and biology (pp. 47-49). Uhlen-Verlag: Wien.
- McIntosh, D. N., Zajonc, R. B., Vig, P. S., & Emerick, S. W. (1997). Facial movement, breathing, temperature and affect: Implications of the Vascular Theory of Emotional Efference. Cognition & Emotion, 11(2), 171-195.
- McLoone, H., Jacobson, M., Adams, E., & Johnson, P. (2000). Infrared thermography to qualify and quantify interaction between hand and computer mouse and its relationship to comfort. In Proceedings of the 44th Human Factors and Ergonomics Society Congress (pp. 47-50). Santa Monica, CA: Human Factors and Ergonomics Society.
- Merla, A., & Romani, G. L. (2007). Thermal signatures of emotional arousal: A functional infrared imaging study. In Proceedings of the 29th Annual International Conference of the IEEE (pp. 247-249). Piscataway, NJ: IEEE Engineering in Medicine and Biology Society.
- Neumann, S. A., & Waldstein, S. R. (2001). Similar patterns of cardiovascular response during emotional activation as a function of affective valence and arousal and gender. Journal of Psychosomatic Research, 50(5), 245-253.
- Plutchick, R. (1980). A general psychoevolutionary theory of emotion. In R. Plutchik & H. Kellerman (Eds.), Emotion: Theory, research and experience. Vol. 1: Theories of emotion (pp. 3-33). New York: Academic.
- Puri, C., Olson, L., Pavlidis, I., Levine, J., & Starren, J. (2005). StressCam: Non-contact measurement of users' emotional states through thermal imaging. In Proceedings of the ACM Conference on Human Factors in Computing Systems (pp. 1725-1728). New York: ACM.
- Ring, E. F., & Ammer, K. (2000). The technique of infra red imaging in medicine. Thermology International, 10(1), 7-14.
- Ring, E. F., Ammer, K., Wiecek, B., Plassmann, P., Jones, C. D., Jung, A. (2007). Quality assurance for thermal imaging systems in medicine. Thermology International, 17(3), 103-106.
- Ring, E. F., Hawkes, R., Elvins, D. M., & Jones, M. (1995). Evaluation of the effects of plastic and metal-studded football boots on the plantar foot. In K. Ammer & E. F. Ring (Eds.), The thermal image in medicine and biology (pp. 220-224). Uhlen-Verlag: Wien.
- Russell, J. A. (1980). A circumplex model of affect. Journal of Personality and Social Psychology, 39(6), 1161-1178.
- Vianna, E. P., & Tranel, D. (2006). Gastric myoelectrical activity as an index of emotional arousal. International Journal of Psychophysiology, 61(1), 70-76.
- Waldstein, S. R., Kop, W. J., Schmidt, L. A., Haufler, A. J., Krantz, D. S., & Fox, N. A. (2000). Frontal electrocortical and cardiovascular reactivity during happiness and anger. Biological Psychology, 55(1), 3-23.
- Wilson, B. A., Alderman, N., Burgess, P. W., Emslie, H., & Evans, J. J. (1996). Behavioural assessment of dysexecutive syndrome. Bury St Edmunds, UK: Thames Valley Test Company.
- Zajonc, R. B. (1985). Emotion and facial efference: A theory reclaimed. Science, 228(4695), 15-21.
- Zajonc, R. B., Murphy, S. T., & Inglehart, M. (1989). Feeling and facial efference: Implications of the Vascular Theory of Emotion. Psychological Review, 96(3), 395-416.
Appendix
|
||||||||||