
Influence of Cultural Background on Non-verbal Communication in a Usability Testing Situation
Department of Design, IIT Guwahati, Guwahati , India
Department of Informatics, CBS, Copenhagen, Denmark
Designers are continuously engaged in elicitation of user data, prior to new product conceptualisation, as well as during the testing of prototypes. When such user data collection happens across different cultures, data is often collected and analysed ignoring the rich qualitative cues embedded in non-verbal communications such as gestures. In cross-cultural situations, gestures can yield additional information from the user. This paper analyses non-verbal kinesthetic cues of users engaged in a verbal protocol-based testing situation. To understand the extent of the influence of cultural background on the nature of non-verbal communications, such as gestures of the head and hands, and to find out if there is an increase of gestures in the vicinity of usability problems, gestures in videos of usability Think-Aloud sessions were analysed using a content analysis software tool. The experiment revealed that there is a rich non-verbal component of communication in the form of gesture-clusters and body movements that happen in an interactive cross-cultural situation. While some gesture types are culture specific, cultural background itself seems not to influence the rate or pattern of the gestures’ occurrence. Non-verbal communication, such as gestures, does hold potential as a source of additional user behavior data in a cross-cultural testing situation.
Keywords – Culture, Gestures, Non-Verbal Communication, Usability Test, User’s Data.
Relevance to Design Practice – There is a large amount of rich non-verbal communication that occurs during a predominantly verbal user data collection and testing situation that has not been, so far, tapped by design researchers. The study indicates that non-verbal communication can be relied upon by design researchers for additional interpretation in cross-cultural situations that have issues like language accents and cultural unfamiliarity and newness for a designer or usability tester. There are optimistic reasons for further probing and studying users’ non- verbal communication during interviews and testing and data collection events.
Citation: Yammiyavar, P., Clemmensen, T., & Kumar, J. (2008). Influence of cultural background on non-verbal communication in a usability testing situation. International Journal of Design, 2(2), 31-40.
Received March 17, 2008; Accepted July 25, 2008; Published August 31, 2008
Copyright: © 2008 Yammiyavar, Clemmensen, and Kumar. Copyright for this article is retained by the authors, with first publication rights granted to the International Journal of Design. All journal content, except where otherwise noted, is licensed under a Creative Commons Attribution-Non Commercial-No Derivs 2.5 License. By virtue of their appearance in this open access journal, articles are free to use, with proper attribution, in educational and other non-commercial settings.
*Corresponding Author:pradeep@iitg.ernet.in
Introduction
A number of techniques that extract data or study user needs and requirements, such as questionnaires, interviews, focus group discussions, and heuristic observations, have been widely adopted by designers and are mentioned in consumer study, marketing research, and product design literature (Hayes, 1992; Urban & Hauser, 1993; Nielsen, 1993). Understanding and interpreting the user’s unexpressed needs has been the central issue in the User Centered Design (UCD) methodology adopted for designing information technology products (Kramer, Noronha, & Vergo, 2000; Vredenburg, Mao, Smith, & Carey, 2002).
Designers are engaged in elicitation of not only data ‘from’ the user but also ‘of’ the user and more importantly from ‘within’ the user. This happens at all stages of a product’s design methodology - prior to as well as during conceptualisation and finally during testing and feedback after introduction of the product into the market. Interface Design researchers have incorporated UCD along with Usability testing in studying web site designs (De Troyer & Leune, 1998), software interface designs (Bodker, 2000), and more recently products, such as learning management systems in educational technology (Corry, Frick, & Hansen, 2006).
However, there is sparse mention in Usability and Design research literature of the effects and nature of the non-verbal components of the communication and interaction with users. The potential of non-verbal components to act as clarifiers and/or additional sources of deeper cognitive level data from within the user has not found adequate attention or mention in designing processes centered on the users.
User Data Collection in Usability Testing
Apart from techniques like interviews and questionnaires that form part of the standard methods of user data elicitation, Usability research techniques, such as ‘Think Aloud’ (Ericsson & Simon, 1993), are also employed extensively, especially while developing and testing interactive interfaces of software products with complex architecture.
In Usability Engineering practice (Nielsen, 1993), the aim of usability testing is to interview and/or observe people using the product in as realistic a situation as possible and to uncover errors and areas of design improvement. Usability testing usually involves a controlled experiment to determine how well people can use the product. Hence, it requires a method to study users’ cognitive processes while performing the task. Ericsson and Simon’s ‘think aloud’ technique - popularly called the TA technique - allows probing the user’s cognitive process through the act of encouraging the user to verbalize loudly whatever is being thought while engaged in the task of using the product.
In a typical TA session performed within the classical Ericsson-Simon theoretical frame work, the user under testing is encouraged to give a concurrent account of his/her thoughts and to avoid interpretation, explanation, and description of what he is doing. He has to concentrate on the task but simultaneously has to continue to verbalize in the manner akin to speaking to oneself of what he/she is thinking. These verbalisations are modeled into three levels by Ericsson and Simon (1993):
Level 1: Vocalisation of thoughts that are already encoded in the verbal form, e.g., mathematical symbols (talk aloud).
Level 2: Verbalisation of a sequence of thoughts that are held in memory in some other form, e.g., visually (think aloud)
Level 3: Other verbalisations (retrospective reports on thoughts not held in memory but collected after the TA session is over, usually in the form of interviews.)
A typical TA session involves interactions between the user under test and the evaluator (also called the tester) who tests the user on design variables, such as usability, while performing a well defined task. The evaluator also simultaneously notes the user’s verbal responses and continuously reminds the user to think aloud. Design researchers studying the TA technique from a distance observe both the user and the evaluator.
It is to be observed here that in the TA testing protocol, which is the most widely used in Usability testing and research the world over (Boren & Ramey, 2000), there is no mention of observing or noting any behavioral data other than verbal protocols of the user. The Ericsson and Simon model values “hard” (level 1 and level 2) data and uses these to validate hypothesized cognitive models of the user buried deep inside the cognitive realm of the user. In the Ericsson-Simon model, verbalisations are usually valued for their explicit spoken content. This eliminates the possibility of collecting and utilising subjective data that is ‘unsaid,’ such as feelings, emotions, and other non-verbal communications that the user consciously or unconsciously indulges in during testing. It is posited in this paper that such data, which is within the user at a deep cognitive level, needs to be tapped in along with the verbal data. The non-verbal component of communication, such as body language and gestures, can aid significantly in understanding the user.
Researchers like Albert Mehrabian (1981) have held that transmission of message is effective only when all three aspects of communication – the verbal (words - 7% impact), the vocal (intonation, pitch, volume - 38% impact), and the visual (gestures, postures 55% impact) are in tandem with one another. It is posited in this paper that some of the non-verbal behavior that accompany verbalisation can act as additional validates of the verbal communication in any standard user data elicitation or usability testing situation. Understanding and incorporating non-verbal communication, as a vital additional source for better understanding of the user can be useful in cross cultural user data collection and testing situations for a designer.
Influence of Cultural Diversity in Usability Testing
Consideration of cultural diversity of users and evaluators has been emphasised by Usability researchers, such as Khaslavsky (1998), Marcus and Gould (2000), Hertzum and Jacobsen (2001); Nielsen (1990); and many others. This has become all the more important as increasingly Usability evaluation and assessment processes involve experts, evaluators, and users unfamiliar with each other’s cultural backgrounds (Hertzum & Jacobsen, 2001).
Researchers have also reported observations of difference in behaviors of users and the evaluators when they belong to different cultures. They have observed such behaviors to be specific to the culture from which they belong (Yeo, 1998, 2001; Clemmensen & Goyal, 2005; Vatrapu & Pérez-Quiñones, 2006). For instance, Vatarapu and Perez-Quinones found that when the interviewers’ and users’ cultural background was the same (in this case, Indian) more usability problems and issues were communicated as compared with when the interviewer was from a different culture (Anglo-American). Such research studies indicate that the cultural background of the participants does seem to have an influence on the quality and richness of the communication in a Usability testing situation. For example, Chavan (2004, 2005) has suggested an alternative testing method that is culturally sensitive for Indians called Bollywood method. Indians have high power-distance index according to Hofstede (1991), which indicates that cultural factors, such as hierarchy, authority, and age (elders), play a definitive role in human interactive communications. These factors also play a role in cross-cultural usability testing or data collection sessions involving participants from different cultural backgrounds (Dray & Mrazek, 1996).
It follows from literature that in multicultural situations, as in India, verbal and non-verbal communications are governed by cultural factors specific to those cultures. In a cross cultural usability testing situation, evaluations of verbal output may have to be supplemented by also evaluating non-verbal cues, such as gestures, that may be specific to a culture. Non-verbal cues may even take precedence over verbal expressions in difficult cross cultural situations wherein language, mannerisms, and cultural unfamiliarity play a role.
In order to investigate the role of non-verbal components of communications, such as gestures in usability tests, and also to find out the extent of the culture’s influence on the very nature and occurrence of the gestures, content analysis of prerecorded visual content captured during cross cultural usability testing sessions was undertaken with the results reported in this paper.
Nature of Non-Verbal Communications in Usability Testing
Ever since Charles Darwin published his scientific study – Expressions of the Emotions in Man and Animals in 1872, researchers in disciplines ranging from anthropology to ethnography have probed body language as an outward reflection of a person’s emotional condition. Non-verbal refers to all stimuli except meaningful words (excluding interjections, such as Oh!) generated for purposes of communication. Such communication may be intentional or unintentional. Body movements such as gestures, facial expressions, eye communication, tactile communication and paralanguage have been identified by researchers as principle non-verbal cues (DeVito, 1989; Leathers, 1989; Kendon, 1983).
In usability testing or user data collection sessions, much of the non-verbal communication that is exchanged using body movements and having up to 55% impact according to Mehrabian (1981) can also be gathered along with verbal output. Certain behaviors can be better understood only through the interpretation of non-verbal cues with body movements being the only way of their communication. A few examples are given below:
a) Readiness and enthusiasm: When people are ready to take action, they will often sit forward in their seats or stand with their hands on their hips. They are anxious to get going. They will stand or sit in an erect position. They are alert, with wide, bright eyes. Their body motions are alive and animated. If the evaluator fails to take notice and initiate rapport during this enthusiasm stage, the user is likely to become either restive or defensive.
b) Frustration: People are often observed exhibiting gestures, such as hand-wringing, running fingers through their hair, clenching hands or jaw, an exasperated sigh, or touching and stroking themselves. Such gestures are called ‘adapters,’ because the user unconsciously tries to adapt by lowering frustration levels through rhythmic actions. If the evaluator were to verbally ask the user about their discomfort, the answer would most probably be a denial of their discomfort while the gestures indicate otherwise.
c) Nervousness: Nervous people cover their mouths when they speak. Their voices are often high and may even break. Their speech is hesitant, and they use “ums” and “ahs” incessantly. They may clear their throats and wring their hands while looking down at their feet. One may also see their facial muscles twitching. Asking them to continue speaking aloud or responding to a questionnaire despite their nervousness may result in non-valid data. Designers need to know about and recognize gesture signs of nervousness. Thus, it can be said that non-verbal cues are a rich source of information on the state and behavior of the users in addition to the verbal content that the users communicate.
Some typical interpretations of non-verbal cues, especially those involving arms and hand gestures, as found in the literatures (e.g., Pease, 2001; Mahl, 1968) are listed below:
- Arms across the chest indicate that we are protecting ourselves or we are cold. However, in usability testing situations, crossing of the arms could indicate fear of participating or hesitancy. It would be a signal for the tester to ask the participant to relax or give reassuring cues to the participant.
- Open hands and arms, especially extended, could indicate a receptive participant in a usability testing situation.
- Similarly, a sloppy posture could indicate disinterest in the usability testing process. If asked to state verbally about the above personal states or their feelings, participants are more likely to deny or hesitate to express them openly especially if they belong to eastern cultures and if the testers or evaluators are from an unfamiliar culture for the fear of showing disrespect to the evaluator.
It is for this reason that non-verbal cues need to be not only documented but also analyzed in conjugation with verbal data in any usability testing or user data collection experiment.
Types of Non-verbal Cues
Highlen and Hill (1984), working in the area of counseling psychology, have identified areas of study in non-verbal behavior as paralinguistics, kinesics, facial expressions, visual behavior, proximics, and touch. Later day researchers from cultural anthropology and linguistics have added occulesics, artifactics, and chronemics to the list.
Paralinguistics deals with vocal cues, such as pitch, tone, intonation, and modulation, that accompany speech. These also include sounds from the throat, such as humming or filling silence with sounds like ‘ummmm’ or’ aaaa.’
Proxemics deals with the study of space elements, such as distance between people and objects. Edward Hall, an American anthropologist who coined the term, defines proxemics in terms of four zones, namely: (a) Intimate - which extends from 0 to 0.5 m (b) Personal – 0.5 to 1.2m ; (c) Social – 1.2 to 3m; (d) Public – 3m.
Artifactics has been associated with the study of non-verbal messages sent out by personal accessories, such as dress and fashion accessories, worn / used by a person.
Chronemics is related to the study of time and its relative understanding by the persons involved. Pauses, silences, and response lag during an interaction are some of the issues.
Kinesics or kinesthetic (both occur in published literature) deals with postures, gestures, head-nods and leg movements. In this paper, we concentrate mainly on kinesthetic gestures.
Ekman and Friesen (1969) have further sub-categorised gestures into four types namely Emblems, Illustrators, Regulators, and Adapters. Emblems are direct translation of culture specific signs like nods of head for ‘yes’ or a V sign to indicate victory. Illustrators emphasize actions, such as banging the table, cutting the air sharply, or sketching in the air a circle to emphasize a round geometric shape. Adapters are unconscious actions of the body like snapping knuckles, shaking a leg rhythmically, touching oneself - stroking hair or chin while in deep contemplation, and shifting the orientation of one’s body to get relief from imagined pressure or discomfort. Regulators are used to control the flow of conversation such as nodding the head up and down to indicate agreement and as though signaling the other to continue the conversation. As seen above, the number and type of non-verbal cues that a researcher can observe is large and requires micro level observations of each frame of a video. Most cues occur simultaneously and in clusters necessitating repeated frame rewinding of the tapes during coding. From the pilot analysis done using software, we estimated that each minute of video requires at least 10 minutes of micro framed observations.
Issues Regarding the Nature and Occurrence of Non-verbal Cues
As much as there are differences in various cultures, there are commonalities too in terms of the nature of processing information cognitively. Ribbens and Thompson (2000) have stated that people from western hemispheric cultures are inclined to cognate information primarily in terms of pictures, sounds and feelings. In the case of people from the east based cultures, in addition to the above, smell and taste also matter. Roughly, 45% of the population has primary preference during cognation in terms of feelings (kinesthetic) compared to 35% in terms of visual image and 20% in auditory form. For a design researcher conducting usability tests in a multicultural situation, non-verbal cues, when analysed for either commonalties or differences, can yield valuable insights that supplement verbal reports. In other words, it is posited here that the subtleties of the cognitive processes in usability testing or any user data elicitation technique can be interpreted through the analysis patterns of accompanying kinesthetic cues in addition to the verbal data. To explore the role and nature of non-verbal communication in a usability testing situation involving cross-cultural teams we posed ourselves the following questions and stated them in the form of posits.
Q1. Do users from different cultures exhibit similar patterns of non-verbal cues or are there differences in the type, frequency, and usage of non-verbal cues, such as gestures?
For example, is it appropriate to assume that users from eastern cultures (India and China) exhibit more non-verbal cues than users from western cultures (Danish)? Gestures have been part and parcel of the performing arts in India. Traditional Indian texts on the performing arts (Coomaraswamy, 1928; Devi, 1954) have detailed explanations on the language of hands and fingers, which are called mudras. Similarly, head movements to express various states of emotions and feelings have been classified in Indian literature. Visitors from other cultures to India often state that they are confused while interpreting the subtle Indian head gestures especially between the left–right movement indicating ‘No’ and the arch swing (chin swinging in the vertical plane) to mean agreement or OK. While gestures are found universally, we wanted to know if and how they differed in users belonging to a specific cultural background.
Q2. Are gestures used as substitutes for words to express views and opinions in specific situations, such as in the presence of a usability problem within a usability testing context?
In other words, we wanted to know if an increase in the frequency count of gestures indicates the presence of a usability related problem when a series of tasks are performed. We are interested in exploring if gestures could become reliable indicators of usability problems. For example can we assume that the number of gestures would increase in the vicinity of a problematic task, thereby allowing us to state that a sudden increase in the frequency of gestures during a usability testing process could be indicative of the existence of a usability problem? Gestures are always interpreted in clusters. Increase in such clusters could become either an identifier of problems in design under test or as signals of user satisfaction.
Q3. Do users use gestures in the initial part of a testing session mainly to establish a rapport with the tester? Would the assumption that non-verbal cues are used more during the initial part of a testing situation and become less frequent as the session proceeds hold true?
Q4. Does the presence of an evaluator from a different cultural background affect the type, nature, and quantity of the non-verbal cues made by the user of another cultural background? In other words, can we assume that in the presence of an evaluator from a different cultural background, the use of gestures increase so as to enable the users to better express themselves? For example, do Indians use more gestures either as a need to impress a foreigner or as a need to express themselves more explicitly, assuming that the person from a different culture may not be able to understand their verbalisation? In short, does the cultural background of the participants – both users and testers influence the nature, type, and frequency of gestures? To seek answers and explore the phenomenon of non-verbal cues, such as gestures, we analysed contents of videos recorded earlier during a Usability Think Aloud (TA) test wherein data was being elicited from users in three different cultures – India, China, and Denmark. A standardized design task using word processing software was developed and administered in three different countries under a standardized format. For the TA test, the users had been given the task of designing a wedding invitation using common word processing software and a collection of cultural clipart embedded in its clip organizer. This TA session was part of an experiment to explore the effects of culture on the interaction between evaluators and test users in a usability test, when the culture of the evaluator is different from that of the user. Phase one of the TA experiment involved a questionnaire; phase two involved composing the wedding invitation clipart by the user as they were thinking aloud. Phase three involved the evaluator interviewing the user during which the researchers studied the interaction between the evaluator and test user. The entire TA session was video recorded in a standard testing room. It is these videos that were used for content analysis and coding of non-verbal cues reported in this paper.
A total of 120 minutes of videos (12 different videos -10 minutes duration each) were selected randomly from video recordings of Think Aloud Usability sessions conducted earlier in Denmark, India, and China. Gestures from a total of 12 users, 4 each from Denmark, China, and India, formed the sample base.
Keeping in view the total number of gestures per minute a user makes and multiplying them with ten minutes of tape for each user, it was logistically possible to accommodate only four users from each of the three cultures.
The language used in all videos was English. Of the two participants featured in the TA video – the user and the tester – only the user’s gestures were analysed for this paper.
Method
Three independent coders carried out content analysis by visual coding of the occurrences and type of hand, as well as head, gestures. The coders were male graduate students, 21 years of age, well versed with usability techniques, which they had studied for two years. They were knowledgeable about usability testing and behavioural coding, and they received additional training on the visual coding and analysis software - Noldus observer version 5.
The unit of analysis was the user’s non-verbal communication behaviour, namely hand and head gestures. The coding was done on the user’s behaviour and from the user’s point of view of the interaction happening in the video. Hand and head gestures of the user under test were observed and logged every time they occurred in the video. Head gestures were logged as Up-Down; Left-Right, and Arch Swing sideways (like when the ears are made to touch the shoulders). The coders classified them according to types, namely Regulators, Emblems, Illustrators, and Adapters. The coders also keyed in notes, comments, and observations against each gesture on the basis of their judgement. The coders also made a note of the presence, if any, of a usability problem in the assigned task along with accompanying spoken words.
Procedure
The procedure for coding the 12 videos was divided into three phases. Phase one was a training phase for the coders to become familiar with the coding software and coding scheme. During phase two, coders were asked to individually code the same set of three videos so as to enable the calculation of the inter-coder reliability. In phase three, each coder worked on a different subset of the remaining nine videos. During phase-one training, the coders received feedback on their coding quality twice. The feedback given by the three authors to the three coders focused on clarifying any interpretation differences between them, especially in understanding the type of gestures and eliminating timing errors that crept in due to lag in pausing the videos while moving back and forth between frames. We emphasized in our instruction to the coders that coding should focus on the user’s behaviour and be done from the user’s point of view. The rules for distinguishing between categories of behaviour were repeated. Several breaks were incorporated into the coding schedule to minimise bias due to fatigue from prolonged minute observations that the analyses warranted. In phase two, in order to provide evidence that the coders were not drifting from their consensus as they continued coding more videos, we built in a 25% overlap between coders, by having all three coders code the same 3 of the 12 videos and then calculated the inter-rater reliability shown in Table 1.
Table 1. Inter-rater reliability
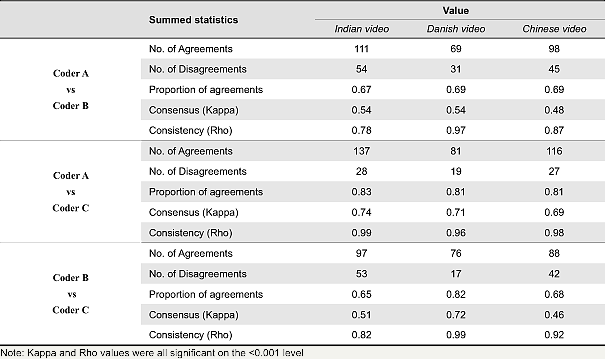
It is observed from Table 1, which shows pair-wise frequency sequence based comparisons of coding of non-verbal behaviors in each of the three videos in phase two, that the inter-rater reliability was significant. Across different pairs of video observations, the three coders showed moderate to substantial consensus (Landis & Koch, 1977) with Kappa values varying from 0.48 to 0.74, and acceptable consistency (Barrett, 2001; Stemler, 2004) with Pearson’s Rho values of above 0.70. This means that there was high agreement between coders about when and what type of non-verbal behavior they observed. It also indicates that they kept their concentration at uniform levels even as they continued coding more videos. Variations between coders did not introduce systematic bias in the observational data. In phase three, each coder was assigned randomly to code a subset of three of the remaining 9 videos. A total of 120 minutes of usability test session video recording was prepared for analysis requiring 36 hours of coding, making the ratio between analysis time and observation time 18:1. Compared to the 2:1 ratio usability professionals normally achieve and the 10:1 ratio common in research-oriented video coding (Fisher & Sanderson, 1996; Burr, 2006), our coders spent considerable quality time for coding. This effort has yielded high-quality observational data for further analysis.
Analysis and Results
The observed and coded data is analysed in view of the questions we raised earlier. For Q1 wherein we were determining if users from different cultures exhibit different gesture patterns in terms of their frequency and type, we did not find overall differences to be significant. This is seen in Figure 1 showing frequency averages for users having cultural backgrounds of Indian, Chinese, and Denmark. Figure 2 shows Head and hand gestures for the three nationalities, and Figure 3 shows each type of gesture (emblem, indicator etc) for each nationality. Our posit that subjects from eastern cultures (Indians & Chinese) use more hand and head gestures - was not tenable. On the contrary - of the three, the Danish, which we label as western culture, had a slightly higher frequency as compared to Indian and Chinese. This is in contrast to popular assumptions in India that Indians tend to use more body actions while communicating than their western counterparts. However, a larger sample size will be needed to come to conclusions.
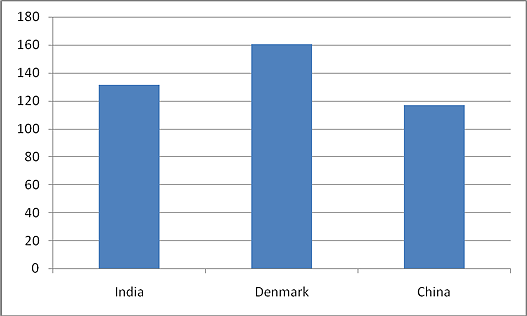
Figure 1. Average of non-verbal gestures used by subjects from three different cultures in usability tests.
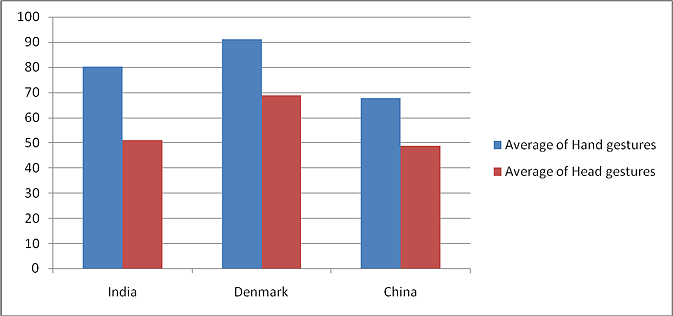
Figure 2. Average of head and hand gestures used by subjects from three different cultures in usability tests.
On the other hand, occurrence patterns of specific types of gestures indicate differences between the three groups. Illustrators were used more in China, whereas Regulators were used the least. However, the differences are not significant. As can be seen from Figure 3, only in the case of the ‘adapter’ type of gestures was the difference significant for the three cultures. (F=4.256, df=2, p<0.05).
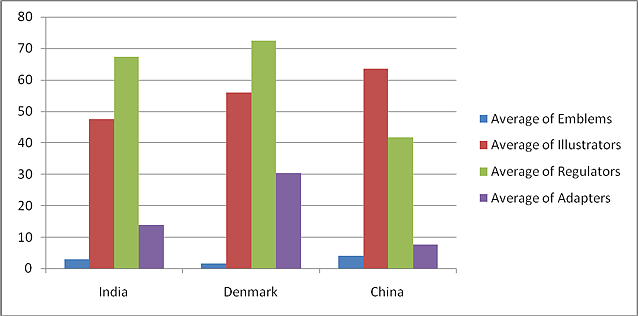
Figure 3. Average of the four types of non-verbal gestures for the three different cultural groups.
Further qualitative analysis of the patterns and types of gestures on the basis of their occurrence in each video, regardless of cultural background, wherein the dialogues and interactions noted by the coders were also taken into consideration, Figure 4 yields the following observations. Though the gestures were spread almost uniformly over the entire recorded TA session videos (see Figure 7), the frequency and count of these gestures reveal a pattern of importance of each gesture. As seen in Figure 4, Regulators, which communicate the users’ regulation of interaction and activities (turn taking, conversing) (Ekman & Freisen, 1969), were the most prominently observed gestures. These regulator gestures become significant in understanding the users’ behavior as it speaks of the users’ need to regulate one’s verbalisations. These gestures also communicated the need for the person to focus on the task. The next prominent gesture type - Illustrators - was found to assist the user in verbalizing (help seek the exact word or emphasise a word) and therefore become additional data to understand the users. Often these illustrators were used to depict the quantity (“very small in size”), quality (“attractive looking”), or an online action (“I am writing”). These illustrators become very profuse at instances of user groping for a word to express his/her actions. The emblem gestures, which are culture specific signals as they replace a word by a symbolic gesture, were least in count per video. Adapter gestures were found to be fewer in frequency as compared to the other types suggesting that the users were mostly comfortable in the testing environment. The adapter gesture could thus speak about the comfort level of the user in the testing situations.
No significant results were found to the question on whether the cultural background of the evaluator being different from that of the user influences patterns of gestures. The difference in cultural backgrounds did not seem to matter to the participants. However, more gestures occurred when both the user and the tester belonged to the same culture (Figure 5).
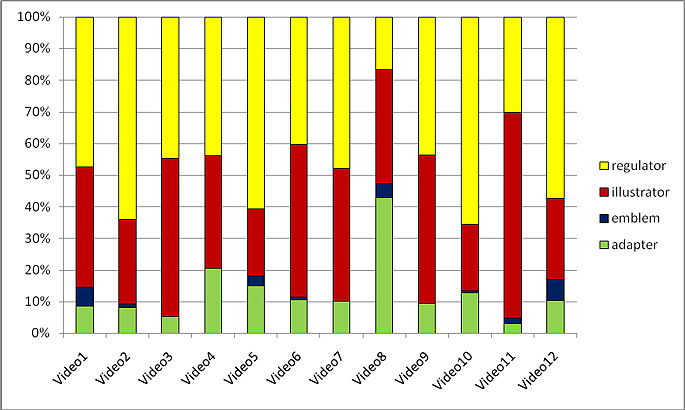
Figure 4. Distribution of gesture types across all videos.
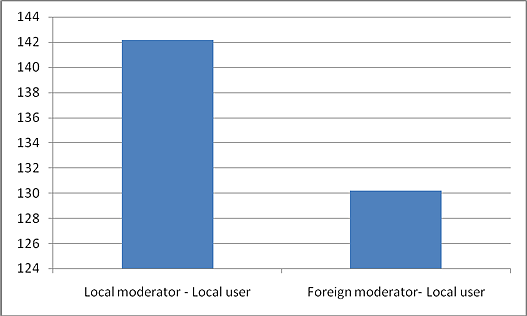
Figure 5. Average of non-verbal gestures for testers & users of different background.
As to the question of whether the frequency of gestures increases in the vicinity of usability problems, we found that the occurrence and frequency of gestures was uniform throughout the 10 minutes of recorded interactions, and the presence of usability problems did not influence this spread. Increased frequency of gestures at a point would therefore not necessarily be indicators of the presence of specific usability task problems at that point. However, when we analysed the type of gestures in the vicinity of a usability problem, we observed that the head arch movement and the hand illustrator gesture preceded usability problems in the videos. We did find a significant correlation between the user’s use of a head arch swing to illustrate what he or she was saying and the identification of usability problems (N=12, Pearson correlation=0.555, p<0.05; 1-tailed). Furthermore, a lag sequential analysis showed that of the different types of gestures, the illustrator gesture is the most frequent predecessor or ‘indicator’ of a usability problem (see Figure 6).
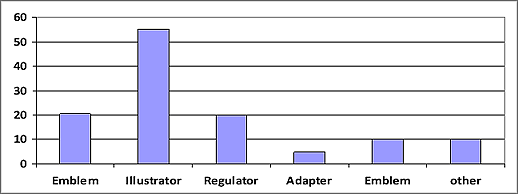
Figure 6. Percentage of gestures occurring just before a usability problem is found.
The question postulating that gestures increase in frequency in the initial part of the interaction as an aid to establish rapport is also answered in the negative. As seen in Figure 7, the spread of gestures is uniform throughout the length of the interactive testing session starting at the beginning of the task and ending at the completion of the ten-minute session.
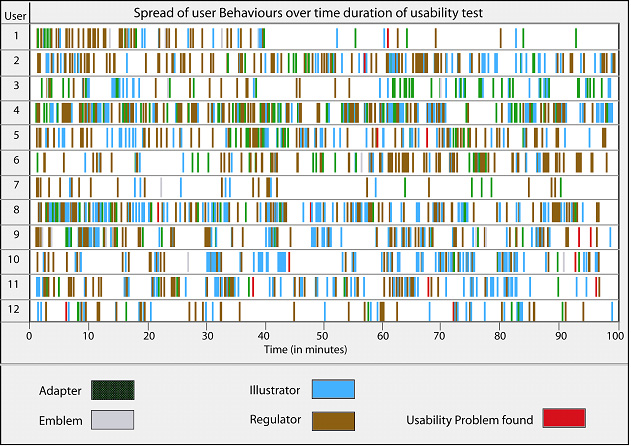
Figure 7. Spread of gesture occurrences for each user in the 10 minutes of the video.
Conclusions
Our analysis of non-verbal cues, such as gestures, showed that there is indeed a rich amount of non-verbal behavioral data that a designer can collect and analyse in conjugation with the verbal data from the user. Non-verbal communication cues, such as hand and head gestures, occur throughout the interactions with an even spread. Their frequency of occurrence is not influenced by the cultural background of either the user or the evaluator.
The ‘type’ of gesture may, however, be specific to usability testing situations in different cultures. The user’s communication with ‘adapters’ was significantly different in the three countries. This indicates that ‘adapters’ could be culture sensitive in usability testing situations. Furthermore, gestures of the type ‘emblem’ and some ‘illustrators’ could also be specific to usability testing in a particular culture. On the other hand, ‘regulators’ seem to be used in similar ways across cultures. In addition, it was observed in lag sequential analysis that the ‘illustrator’ gesture is the most frequent predecessor or ‘indicator’ of a usability problem. Further studies on this can yield non-verbal behavior indicators that can increase a design researcher’s sensitivity to the presence of usability problems in a cross-cultural user testing or data collection situation. A deeper study of gesture types and cultures involving a larger cultural sample base is likely to yield more useful data for design researchers.
The study was restricted to the occurrence and type of gestures using a small sample from participants belonging to different cultures. The symbolic, iconic, and metaphoric content of the gestures were not analysed in relation to the accompanying verbal output. A much larger sample base representative of the different cultures need to be studied.
Acknowledgements
This study was co-funded by the Danish Council for Independent Research (DCIR) through its support of the Cultural Usability Project of the Copenhagen Business School with participation from the Indian Institute of Technology Guwahati, India. We would like to acknowledge the contributions of the following students: Shivam, Meera, Rama, Shreeyas, and Vamshi.
References
- Barret, P. (2001). Assessing the reliability of rating data. Retrieved March 15, 2008, from http://www.pbarrett.net/techpapers/rater.pdf
- Bodker, S. (2000). Scenarios in user centered design– Setting the stage for reflection and action. Interacting with Computers, 13(1), 61-65.
- Boren, M. T., & Ramey, J. (2000). Thinking aloud: Reconciling theory and practice. IEEE Transactions on Professional Communication, 43(3), 261-278.
- Burr, B. (2006). VACA: A tool for qualitative video analysis. In Proceedings of the Conference on Human Factors in Computing Systems (pp. 622-627). New York: ACM.
- Chavan, A. (2004). The Bollywood method. In E. Schaffer (Ed.), Institutionalization of usability: A step-by-step guide (pp. 129-130). New York: Addison-Wesley.
- Chavan, A. L. (2005). Another culture, another method. In Proceedings of the 11th International Conference on Human-Computer Interaction [CD-ROM]. Hillsdale, NJ: Lawrence Erlbaum Associates.
- Clemmensen, T., & Goyal, S. (2005). Cross cultural usability testing. Copenhagen: Copenhagen Business School. Retrieved November 15, 2007, from >http://ideas.repec.org/p/hhs/cbsinf/2005_006.html
- Coomaraswamy, A. K. (1928). Mudra mudda. Journal of the American Oriental Society, 48, 279-281.
- Corry, M. D., Frick, T. W., & Hansen, L. (2006). User centered design and usability testing of a web site: An illustrative case study. Educational Technology Research and Development, 45(4), 65-76.
- DeVito, J. (1989). The non-verbal communication workbook. Prospects Heights, IL: Waveland.
- Devi, R. (1954). Dance dialects of India. Delhi: Motilal Banarisida.
- Dray, S., & Mrazek, D. (1996). A day in the life: Studying context across cultures. In J. Nielsen & E. del Galdo (Eds.), International user interfaces (pp. 242-256). New York: John Wiley & Sons.
- Ekman, P., & Friesen, W. V. (1969). The repertoire of nonverbal behavior: Categories, origins, usage, and coding. Semiotica, 1, 49-98.
- Ericsson, K. A., & Simon, H. A. (1993). Protocol analysis – Verbal reports as data. London: MIT Press.
- Fisher, C., & Sanderson, P. (1996). Exploratory sequential data analysis: Exploring continuous observational data. Interactions, 3(2), 25-34.
- Hayes, B. (1992). Measuring customer satisfaction: Development and use of questioners. Milwaukee, WI: ASQC Quality Press.
- Hertzum, M., & Jacobsen, N. E. (2001). The evaluator effect: A chilling fact about usability evaluation methods. International Journal of Human-Computer Interaction, 13(4), 421-443.
- Highlen, P. S, & Hill, C. E. (1984). Factors affecting client change in individual counseling; Current status and theoretical speculation. In S. Brown & R. Lent (Eds.), Handbook of counseling psychology (pp. 334-396). New York: Wiley.
- Hofsted, E. G. (1991). Cultures and organizations: Software of the mind. New York: McGraw Hill.
- Kendon, A. (1983). Gestures and speech how they interact. In J. M. Wiemann & R. P. Harrison (Eds.), Non-verbal interaction (pp. 13-45). Beverly Hills, CA: Sage.
- Khaslavsky, J. (1998). Integrating culture into interface design. In CHI 98 Conference Summary on Human Factors in Computing Systems (pp. 365-366). New York: ACM.
- Kramer, J., Noronha, S., & Vergo, J. (2000). A user centered design approach to personalization. Communications of the ACM, 43(8), 44-48.
- Landis, J. R., & Koch, G. G. (1977). The measurement of observer agreement for categorical data. Biometrics, 33(1), 159-174.
- Leathers, D. (1989). Successful non-verbal communication. New York: Macmillan.
- Mahl, G. F. (1968). Gestures and body movements in interviews. In J. M. Shlien (Ed.), Research in psychotherapy (Vol. 3, pp. 295-346). Washington DC: American Psychology Association.
- Marcus, A., & Gould, E.W. (2000, June). Cultural dimensions and global web user interface design: What? So what? What now? Paper presented at the 6th Conference on Human Factors and the Web, Austin, TX.
- Mehrabian, A. (1981). Silent messages: Implicit communication of emotions and attributes (2nd ed.). Belmont, CA: Wadsworth.
- Nielsen, J. (1990). Designing for international use. In Proceedings of the SIGCHI Conference on Human Factors in Computing Systems: Empowering People (pp. 291-294). New York: ACM.
- Nielsen, J. (1993). Usability engineering. Boston, MA: Academic Press.
- Pease, A. (2001). Body language – How to read others’ thoughts by their gestures. New Delhi: Sudha Publications.
- Ribbens, G., & Thompson, R. (2000). Body language in a week. London: Hodder & Stoughton.
- Stemler, S. E. (2004). A comparison of consensus, consistency, and measurement approaches to estimating interrater reliability. Practical Assessment, Research & Evaluation, 9(4). Retrieved January 29, 2008, from >http://PAREonline.net/getvn.asp?v=9&n=4
- De Troyer, O. M. F., & Leune, C. J. (1998). WSDM: A user centered design method for web sites. In Proceedings of the 7th International Conference on World Wide Web (pp. 85-94). Amsterdam: Elsevier Science Publishers.
- Urban, G., & Hauser, J. (1993). Design and marketing of new products (2nd ed.). New York: Prentice-Hall.
- Vatrapu, R., & Pérez-Quiñones, M. A. (2006). Culture and usability evaluation: The effects of culture in structured interviews. Journal of Usability Studies, 1(4), 156-170.
- Vredenburg, K., Mao, J. Y., Smith, P. W., & Carey, T. (2002). A survey of user centered design practice. CHI Letters, 40(1), 471-478.
- Yeo, A. W. (1998). Cultural effects in usability assessment. In CHI 98 Conference Summary on Human Factors in Computing Systems (pp. 74-75). New York: ACM.
- Yeo, A. W. (2001). Global-software development lifecycle: An exploratory study. In Proceedings of the SIGCHI Conference on Human Factors in Computing Systems (pp. 104-111). New York: ACM.
