
What Drivers Really Want: Investigating Dimensions in Automobile User Needs
Dimitrios Gkouskos 1,*, Carl Jörgen Normark 2,*, and Sus Lundgren 1
Division of Interaction Design, Chalmers University, Gothenburg, Sweden
Division of Innovation and Design, Luleå University of Technology, Luleå, Sweden
Understanding what users need, as opposed to what they say they need, can be a challenge. In order to better address users’ true needs, two consecutive methods were used in this study: Future Workshops and Repertory Grid Technique. The Future Workshops—where 21 participants designed for two different future scenarios—opened up for inscribing need expressions and possibilities into five futuristic automobile concepts. These concepts were used as a basis for the Repertory Grid, a technique where users compare objects, describing properties that they find to be important or significant. In this study, 78 participants provided 390 constructs of properties, which were refined to 19 dimensions relevant to user needs. Two study measures, Evaluative Ability and Descriptive Richness, indicate which methods to use when exploring the need dimensions further. Finally, the analysis of the constructs and dimensions point towards how three aspects of vehicles and driving are emerging: how novel technology should, or should not, support driving; how the automobile can be seen as something else than just a means of transportation, and how an automobile could be a part of a greater collective of vehicles.
Keywords – User Needs, User Experience, Automotive, Repertory Grid, Future Workshop.
Relevance to Design Practice – The need dimensions can be used as a means to create more positive and customized user experiences, since they inform designers of the different needs users might have regarding vehicle interactions. Moreover, the measures for Evaluative Ability and Descriptive Richness indicate which methods to use to further explore the dimensions.
Citation: Gkouskos, D. Normark, C. J., & Lundgren, S. (2014). What drivers really want: Investigating dimensions in automobile user needs. International Journal of Design, 8(1), 59-71.
Received October 10, 2012; Accepted October 13, 2013; Published April 30, 2014.
Copyright: © 2014 Gkouskos, Normark & Lundgren. Copyright for this article is retained by the authors, with first publication rights granted to the International Journal of Design. All journal content, except where otherwise noted, is licensed under a Creative Commons Attribution-NonCommercial-NoDerivs 2.5 License. By virtue of their appearance in this open-access journal, articles are free to use, with proper attribution, in educational and other non-commercial settings.
*Corresponding Author: dimitrios.gkouskos@chalmers.se, jorgen.normark@ltu.se (The authors contributed equally to this article)
Dimitrios Gkouskos is a PhD candidate at the Interaction Design Division in the department of Applied IT at Chalmers University of Technology. His major research interests include applied user experience in different contexts of use, designing for emotions, and creativity research. He is currently working for the EFESOS project, with the aim to improve in-vehicle interactions by gearing the design of such systems towards positive user experience.
Carl Jörgen Normark is a PhD student within Industrial Design at the division of Innovation and Design at Luleå University of Technology. His major research interests include human centered design, user experience, and various usability issues. He is currently working for the EFESOS project with personalizable vehicle interfaces, and was a part of the OPTIVe project.
Dr. Sus Lundgren is Senior Lecturer and Director of Studies at the Interaction Design division in the department for Applied IT at Chalmers University of Technology. Her major research interests are: new ways to interact with digital content on mobile devices; design methods; and gameplay design, preferably in combination.
Introduction
During the last decades digital artifacts have changed our ways of living and interacting with products. Computers and smartphones support numerous frequent activities, and are now an inherent part of everyday life. Similarly, the technology in cars is now taking over certain aspects of driving for increased safety, efficiency, and enjoyment (Walker, Stanton, & Young, 2001), which in turn changes what driving a car is all about. In comparison to traditional interfaces, today’s vehicles allow for many more functions and provide more information (Figure 1), and as a result vehicle interfaces face similar user experience issues as computers and mobile phones.
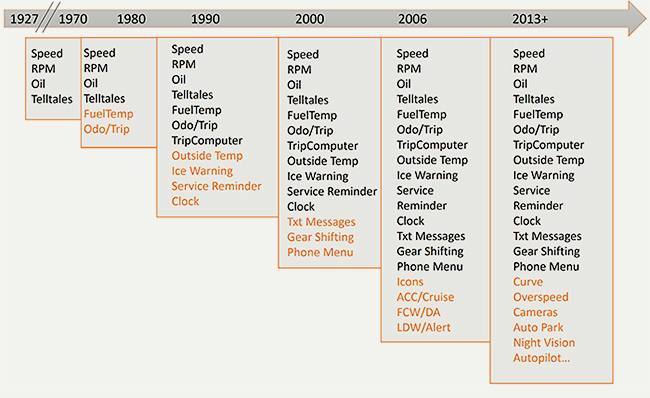
Figure 1. Increase of driver information.
One of the key challenges is thus the presentation and management of all the added functions and their related information, while still maintaining a simple, efficient and natural interaction and conveying a safe interaction and offering good overall user experience. Now, more than ever, there are great opportunities to offer a tailored, customized user experience for different types of drivers, for example by using digital displays instead of mechanical dials for the user interface (Walker et. al., 2001). However, in order to offer an improved user experience, it is crucial to be aware of the driver’s salient needs and wants from the vehicle. An example is given by Don Norman (2010) in his book “Living with complexity,” where Norman stated that “The philosophy underlying human-centered, sociable design is that it (human centered design) is for the benefit of the people who use it, taking into account their true needs and wants” (p. 130). Similarly, Krippendorff (1989) highlighted the importance of understanding meaning, i.e., how people make sense of things, in order to understand user experience and user perception, if one is to design something that is meaningful to the user.
As a result, designers need to have a thorough understanding of the target users and their needs in order to be successful. However, currently used or presumed needs may be influenced by technological possibilities, social pressure, and/or marketing campaigns, and may thus not reflect the users’ true needs. It is also generally known that most users cannot directly express their needs regarding a product, service, or experience (Patnaik & Becker, 1999; Laurel, 2003), especially with today’s rapid technological development. Another reason why finding needs is challenging is that while a need can be relevant to a function or feature that is present, a need can also exist when a function or feature is lacking. (Van Elslande & Foquet, 2008). As a result, a need can be difficult to identify in advance, as it is not visible, however becoming obvious once it’s addressed. Needs are also very personal. It is not likely that a person that has no relation at all to something will find a need related to this something (Faste, 1987).
Evidently, there is a need (sic!) for methods that can elicit expressions of salient user needs, primarily targeted towards the user’s interaction with the vehicle. Commonly used methods are market research-oriented, e.g., surveys and focus groups, but these are more suitable for mapping preferences for readily existing choices and may miss the needs that the user cannot articulate (Patnaik & Becker, 1999); they are also not specifically targeted towards interaction. Another approach is to see how individuals perceive and evaluate products or prototypes, but again, missing needs may be overlooked (Hassenzahl & Wessler, 2000). Another approach to finding needs and other relevant designer information is to explore the design space that a certain product conveys, i.e., all possible information that can influence the design decisions being made.
Purpose
The purpose of this paper is to identify and present prominent dimensions of driver needs by exploring the design space of five future vehicle concepts, using future workshops in combination with a repertory grid technique.
Methodological Approach
One of the primary goals of this study was to minimize experimenter influences that could dilute the user’s answers into something other than their innate beliefs and opinions, while still allowing them to focus on issues of interest. Two methods were utilized for the purpose of eliciting the user’s needs with respect to vehicle interaction. The first method was an adaptation of the future workshop method (Jungk & Müllert, 1987). Here, the participants populated two pre-designed futures that focus on technology and trust, and then used them as inspiration to design future vehicles while inscribing desired needs and features into them. The resulting features were then consolidated into textual descriptions of five futuristic vehicles. The second method was the repertory grid technique (RGT) (Fransella, Bell & Bannister, 2004), where the textual prototypes from the future workshops were used as input elements. Here, participants compared the vehicles, and their comments (called constructs in RGT) were then semantically analyzed and categorized with the purpose of consolidating the results into dimensions of user needs. These dimensions can be used in the design process in the field of automotive design. The proposed method had already been tested by the authors with positive results, as presented in Normark & Gkouskos (2012). The sequence of the approach is illustrated below (Figure 2):
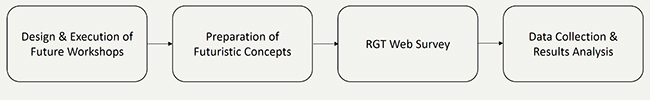
Figure 2. Methodological Approach. The experiment sequence briefly outlined.
Future Workshops
The Future Workshop method (Jungk & Müllert, 1987) can be used to transform a current, or a problematic situation, into a preferred one. It can also aid in shifting the participant’s focus from current problems to imagining alternative solutions by using creative thinking. This can be valuable when the goal is to generate ideas for new technology instead of incremental problem solving. Jungk and Müllert’s method comprises the steps of: addressing a problem and reflecting over own experiences; then imagining that the participants are situated in an exaggerated perfect world where everything is possible (Apel, 2004; Drewes Nielsen, 2006), getting away from inherent boundaries and restrictions; finding a solution based upon the ideas in the previous phase that is translated to this world; and finally, making an action plan to realize these solutions (Apel, 2004; Jungk and Müllert, 1987). The futures can also be enhanced by scenarios (Drewes Nielsen, 2006) that visualize fictional but typical user activities that can be discussed and addressed in design. Scenarios provide a way to understand how the inhabitants of the future will act, as well as what they will experience and what their goals are (Carroll, 2000). They can also serve in disconnecting the participants from former experiences of technology and the contexts in which it is commonly used, or help in finding new areas for technology to be used in.
Workshop Procedure
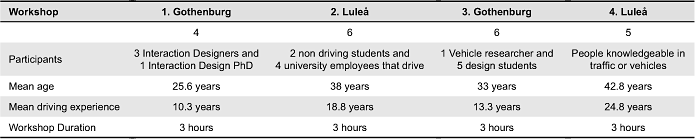
The purpose of the workshops was to enable the participants to suggest future vehicles and characteristics of future vehicles. Two workshops were conducted in Gothenburg, Sweden, and two in Luleå, Sweden. The participants were a mixture that included both M.Sc. design students with none or little driving experience and professionals with many years of experience in both driving and in design related research. (Table 1).
Table 1. Workshop information.
The workshops adopted the Future Scenario Workshop agenda (Drewes Nielsen, 2006), but focused mainly on the first two steps, i.e., reflection on the driving task followed by imagining how vehicles would be like in the future. The researchers constructed two different future scenarios in an iterative cycle featuring a pilot study and an expert evaluation. The futures were designed with a focus on issues relevant to trust and technology, as these topics have been identified as important in previous research (Muir, 1994; Muir & Moray, 1996; Walker et. al., 2001). The utopian/dystopian view presented in Wikberg Nilsson and Fältholm (2011) was also employed. The future scenarios were presented to the participants of the workshops in a randomized order:
- Dystopian Future: 25 years have passed since 2011. In this time, the automotive industry has evolved in a pace similar to that of computers in the first decade of the new millennium. The vehicle users of 2036 have really adopted the technological advancements in the vehicles, especially the autonomous driving and automatic trip planning where a minimum of effort is put into transportation issues. Everything was fine until the great system crash in the worldwide traffic controlling system that caused massive damage and uncountable accidents. During the investigation of the crash, the system is shut down. People lost trust in the system. A movement for independence from automation and the system has started among people when they realize that they can’t go anywhere without the system. Public transport is reserved only for emergencies. Most people could not operate vehicles, and so they have started to learn how to do so again. They look back on pictures of their parents’ vehicles parked in their driveways and wish that they could use their vehicles just like they did.
- Utopian Future: 25 years have passed since 2011. In this time, the automotive industry has evolved in a pace similar to that of computers in the first decade of the new millennium. The coalition founded by dominant political forces around the world has promoted great technological advancements in order to minimize pollution and greatly improve the efficiency and functionality of vehicles. This new breed of vehicles is viewed as more than just a means of travelling to places. Individual transportation and being eco-friendly is very popular and is also seen as a sign of personal financial success, and public transport does not exist anymore.
The scenarios were different enough to allow for very diverse designs, which aimed to benefit the Repertory Grid. In one of the workshops, the presentation of the futures was enough to stimulate discussion. In three of the workshops a subsequent task—a light version of a scenario—was used in order to further encourage discussion among the participants. The task consisted of: driving to a nearby shopping mall and buying a large wedding gift; and transporting the gift to the wedding, which was situated in a town 300 km away. All workshops followed the same steps:
- Introduction Phase: Here, the future was presented to the participants.
- Critique Phase: Discussion and critique concerning the future world took place, to get the participants on equal footing and ensure that they all were discussing the same issues. Possible problems and critique on elements of the presented future were elicited here. The future was populated and one major topic—how are vehicles used in this future?—enriched the rather short description.
- Phantasy phase: In this step, the creation of vehicles that would be suitable for this future took place. The subsequent task was presented in this phase only if the participants were stuck and needed more inspiration. This phase involved creative methods such as a brain-writing pool exercise, where the workshop participants spent a few minutes writing ideas or desired features for vehicles that would fit the presented future scenario. The participants were allowed to work freely and express themselves in whatever way they wanted. The workshops resulted in a number of ideas for vehicle concepts that were written down on templates (Figure 3). The researchers finalized the concepts as text based future vehicle concepts after the workshops, so they would be comparable to each other.
- Debriefing: A laddering interview (Reynolds & Gutman, 1988) with the group was conducted in order to elicit information about the participants’ rationale for including particular functionality in the vehicle concepts. The participants were asked about the functions and attributes they had chosen for the concepts. To dig deeper into the reasons for including these specific attributes, follow-up questions were raised with the participants concerning their answers. This gave insights into underlying needs that were fulfilled by the functions or attributes that the participants proposed. This part helped to ensure that the researchers had understood the workshop participants’ intentions, and was used when finalizing the concepts.
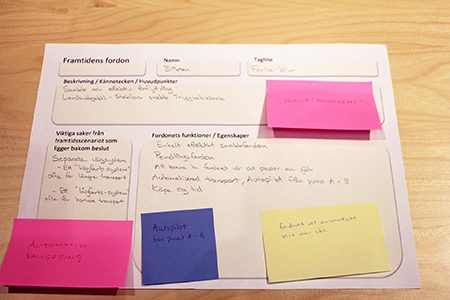
Figure 3. Workshop and workshop results.
Workshop Analysis and Outcomes
Since some workshop groups produced more than one vehicle concept per future, there were a total of ten templates that described features and characteristics of future vehicles designed by the participants (Figure 3). However, some of the characteristics were very similar across different templates. Since one of the prerequisites for a successful use of the Repertory Grid Technique is that the input elements need to be as dissimilar as possible (Hassenzahl & Wessler, 2000), features and characteristics from the templates were consolidated into five clearly distinguishable concepts by the research team (Figure 4). The concepts were then formatted in the same way and adjusted so that they had comparable lengths and a comparable amount of detail. A short narrative was also written for each concept in order to summarize the main idea behind the concept.
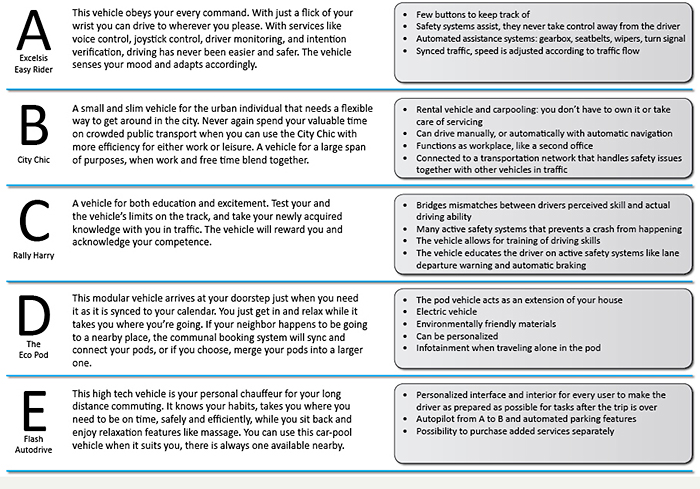
Figure 4. The final concepts for input in the RGT survey.
The Repertory Grid Technique
The repertory grid technique (RGT) originates from the personal construct theory (Kelly, 1955), which is a theory of human cognition. The main assumption is that an individual’s understanding of the world consists of dimensions of similarities and differences called personal constructs. These are created through the comparison of objects (Kelly, 1955) and form bi-polar scales.
In association with this, the RGT has been used for eliciting user experiences associated with technological artifacts. In short, RGT builds on Kelly’s (1955) idea that for all objects each person has their own set of notions that is relevant for them. For example, when it comes to a dishwasher, Robin may be very interested in aspects related to noisiness and economy, whereas Kim is more interested in environmental aspects. Some constructs are easy to foresee and find, whereas others may be subtler, e.g., how fast the machine works, or that it is self-cleaning. These internalized expressions of needs can be discovered when making comparisons, by having to motivate how one artifact is different from the other, since this shifts the focus on evaluating and comparing properties. Within RGT, a common way to conduct comparisons is the triadic approach, where the participant compares three artifacts called elements (a triad) at a time and is asked to describe a property shared by two of them but not the third element. Then, the participant is also asked to state the opposite of this property. The resulting properties become a bi-polar scale called a construct (Fällman & Waterworth, 2010; Heine, 2009) and represent notions that matter to the participant. For example, if the characteristics used are “hot” and “cold,” then the construct can be called Temperature.
The RGT has proven to be useful for knowledge acquisition (Normark & Gkouskos, 2012; Shaw, 1980; Shaw & Gaines, 1995). It is especially useful when considering the user’s perceptions, needs, beliefs, and attitudes in the design of a product, and can also be used to map differences between artifacts, as well as similarities and differences within individuals or groups of participants (Hassenzahl & Wessler, 2000). The RGT is also useful in several contexts for eliciting individual experiences and meanings in various fields of research, including interaction design and human computer interaction (Fällman & Waterworth, 2010). Moreover, the RGT can be used both as a tool for inspiration, and as a tool to acquire a valid and reliable representation of the user experience both in finished products and in prototypes early in the design process (Karapanos & Martens 2008). The method takes a holistic view of investigating user experience rather than experimenting on isolated parameters (Fällman, 2006). In conclusion, the RGT is a suitable and tested technique for exploring artifacts from a user perspective.
The RGT produces data that reflect the participants’ own views, and it can do this with different levels of researcher involvement, ranging from the researcher deciding both which elements to put into the method (what to compare) and which constructs should relate to them, to allowing the participant to decide both of these aspects and, thus, minimizing researcher bias (Alexander, Van Loggerenberg, Lotriet, & Phahlamohlaka, 2008; Fällman & Waterworth, 2010).
The repertory grid consists of columns of elements and rows with a repertoire of the participant’s personal constructs, which represent the meaning and experience the participant sees in the artifact (Fransella et al., 2004). Therefore, the grid represents a personal construct system that forms a map of how people think, perceive, and learn (Jerrard, 1998). In order to better understand the RGT data, researchers can conduct qualitative semantic analyses based on the participants’ descriptions of the constructs, or quantitative statistical analyses to find similarities between constructs and elements. By comparing and classifying constructs, one can form groups of constructs or artifacts that seem to share the same meaning. As a result, a generalized view of meaning can be mapped (Tomico, 2009) which can form a basis to aid designers in their work.
RGT Procedure
The purpose of this step of the study was to find expressions of user needs related to vehicle driving in the form of constructs, and to compare and group these needs into a more generalizable set of user need dimensions, which can be used by designers in a user centered design process.
The study used the conceptual vehicles from the workshops as input to the RGT. However, construct creation was user-driven in order to elicit the most important aspects regarding these conceptual vehicles and also driving in general. A web survey format was chosen in order to get a large number and a broad variety of respondents in an efficient way. The survey could be completed within 20 minutes, according to pilot testing, and the web format allowed participants to choose their own time for completing the survey. The criterion for participating in the survey was to possess a valid driver’s license. Google Ad Words was used to advertise the survey in order to reach out to respondents in Sweden, and e-mail invitations were also sent out to the researchers’ universities. 78 participants completed the survey correctly. Twenty six of the participants were females (33%) and 52 were males (67%). The mean age of the participants was 42.6 years, with an average driving experience of 22.5 years, and a reported estimate of computer usage of more than 20 hours per week.
The web survey procedure was executed using the triadic construct elicitation and rating: (Fransella et al., 2004) and featured:
- General demographic questions.
- For five iterations the participant viewed a random set of three out of five vehicle concepts (Figure 5). For each iteration, the participant was asked to find some similarity or characteristic that was shared between two of the concepts and, thus, differentiating them from the third concept. They then marked these two concepts and described the similarity with a word or short sentence. The participant was also asked to describe what he or she believed to be the opposite of this similarity.
- In the next step, the participant was asked to rate each of the five vehicle concepts according to how much they corresponded to the constructs that the participant had recently created. This was done by choosing the number of stars that would correspond to a certain rating in the construct matrix (Figure 6).
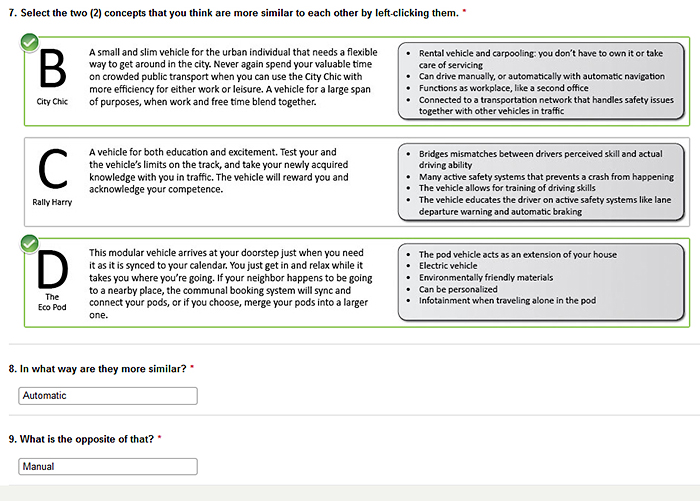
Figure 5. Construct elicitation process.
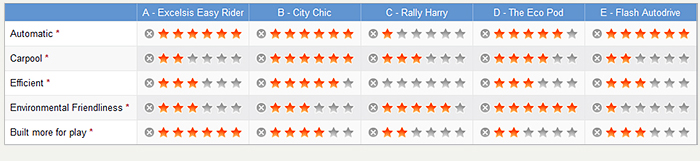
Figure 6. Element rating process. No stars: vehicle does not at all correspond to construct. 6 stars: vehicle fully corresponds.
Analysis and Results
The aim of the analysis was to organize the data elicited from the participants in a way that could be used to aid the design of automobiles. Once the 390 constructs were collected, they were consolidated into fewer groups and analyzed in terms of their frequency, how original they were, and how easy they were to evaluate.
Merging Constructs into Construct Dimensions
The aim of the initial analysis of the grid data was to lift the constructs from the individual and idiosyncratic levels to a more generalized view comprised of underlying patterns that emerge when all constructs are compared together (Hassenzahl & Wessler, 2000).
This initial grid analysis was done semantically to find dimensions of constructs that share similar meanings within and between participants, and to group and structure these meanings in a comprehensive way. Conventional content analysis (Hsieh & Shannon, 2005) was used to transform the data from single idiosyncratic constructs to dimensions of related meanings. All 390 constructs elicited from the 78 participants were coded and categorized in this step. Several similar bi-polar construct scales, such as “autopilot-drive yourself” and “automatic-manual,” were identified among the participants’ responses and merged into the same dimension, in this case, Automation. Having let each participant describe both poles of a construct was of great use when ruling out constructs that seemingly have the same meaning, but where the opposite pole may indicate otherwise. Two researchers did this categorization independently and the results were compared. The researchers reached an inter-rater reliability (Fleiss, 1971) of k = 0.756, which was found to be satisfactory. The constructs that were not categorized in the same group by the researchers were regrouped upon agreement. In total, 19 need dimensions were found.
Further data analysis
When interpreting the need dimensions, several different measures were used. In order to minimize the influence of the words used in the concept description, the data was also analyzed to see whether the resulting constructs could be considered to be original in the sense that they reflect the participants’ own view or if the constructs were chosen to represent the most salient features of the future vehicle concepts. Moreover, Tomico’s (2009) measures of dominance, importance, and descriptive richness were used as well as Hassenzahl and Wessler’s (2000) types of evaluative or descriptive constructs. The use of such taxonomies allowed for merging information from individual grids into dimensions with the idiosyncratic views still preserved. By expressing the information in several dimensions it was easier to understand how the participants had perceived the elements, and subsequently to understand which attributes were most valued by the participants (Figure 7).
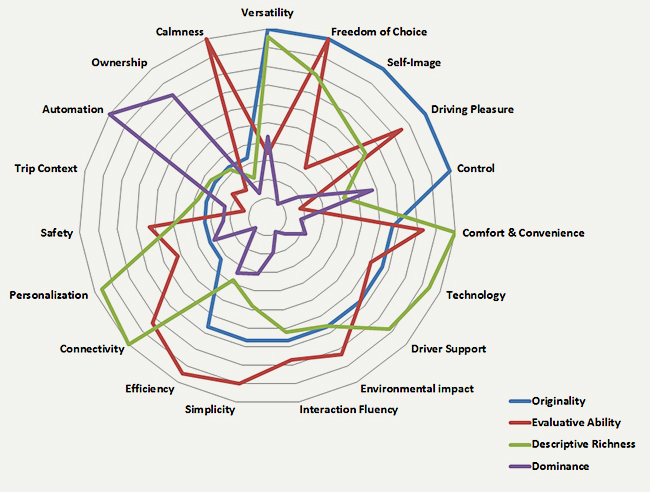
Figure 7. Dimensions Sorted by Originality.
Construct originality
Since the future vehicle concepts were described textually, it was convenient for some participants to scan the concepts looking for the same word occurring in two of the concepts and choosing this highly salient feature as the characteristic that unifies the concepts. In order to check for this practice, an analysis was conducted. The purpose was to test whether constructs were directly transferred from the concept descriptions or if the constructs reflected some other information not explicitly described in the concept description, i.e., having a high degree of originality. Since the scope of this study was to elicit information from automobile drivers reflecting their own personal view, the dimensions with original information was the focus of attention.
Dominance
Dominance reflects the number of constructs belonging to a dimension over the total sample of 390 constructs (Tomico, 2009). It indicates that participants find this particular characteristic to be more salient than other characteristics.
Evaluative ability
The data was analyzed in order to investigate whether the constructs are suitable for direct input during the design process. Hassenzahl and Wessler (2000) distinguished between three types of constructs: Descriptive; Evaluative and useful for artifact selection; and Evaluative and useful for artifact redesign without the need for further analysis. In the present study the constructs could however be described as being either Descriptive or Evaluative, since there were no constructs that could directly inform detail design. Descriptive identifies an indifferent design feature, e.g., blue–green, whereas an evaluative construct can tell whether a feature is desirable or not, e.g., good–bad, or delightful–miserable. A feature with a high score in the desirable pole is then a candidate for inclusion in the development process. Highly evaluative constructs can be used to inform design decisions. In this study 45.9% of the constructs were found to be evaluative, whereas 54.1% of the constructs were found to be descriptive in nature.
Descriptive richness
Descriptive richness describes whether all the constructs that make up a dimension present a rich description of its inherent meaning. Tomico (2009) considered dimensions containing many unexpected or dissimilar constructs as having high descriptive richness. In this study, however, a slightly different view, based on Lyons, was used. Lyons (1977) identified three different types of constructs; negations (“Efficient–Inefficient”), opposites (“Automatic–Manual”), and non-contiguous constructs, where the construct poles do not explicitly represent each other’s opposite (“Efficiency–Driving for fun”). Karapanos and Martens (2008) consequently argued that if the scope of the study is to inspire design, rather than to evaluate the perceived user experience stemming from a product, a high percentage of non-contiguous constructs is desired, since they are believed to give more insight into design qualities connected to product attributes. The current study displays a ratio of about 63% opposite constructs, 28% non-contiguous constructs, and 9% negations. Since the non-contiguous constructs are considered having a high descriptive richness in relation to the other constructs, the percentage of non-contiguous constructs in a dimension makes up the Descriptive Richness measure for that dimension.
A combination of measures
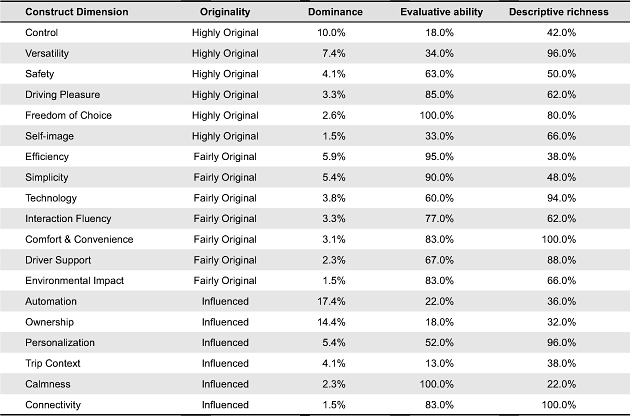
The evaluative ability and descriptive richness measures that are present in Table 2 indicate types of user research that are suitable for exploring a need dimension. This can be especially valuable in industrial applications when identifying needs and desires of a target group is of importance. Need dimensions with high descriptive richness can be explored with user research methods that produce narratives, such as open-ended interviews and focus groups, in order to capture the personal meanings behind the rich concepts that are being explored. Dimensions with low evaluative ability are also best explored with narrative in order to understand the reasoning behind the existence of these types of dimensions, whereas dimensions with high evaluative ability can be explored with surveys, questionnaires, or other Likert type methods. The figure below presents the dimensions organized by descriptive richness, and then by evaluative ability.
Table 2. Dimensions of constructs and their distribution among measures.
Summary of results and description of dimensions
The identified dimensions of personal constructs, that share a similar meaning, are presented below. They are categorized by originality, e.g., dimensions are “original” in the sense that they are so strongly present in users’ minds that they appear despite not being hinted towards rather than in the sense of being new and unexpected. Each dimension’s evaluative ability is also briefly presented in the descriptions.
Highly Original Dimensions
These are need dimensions that were found highly original, i.e., consisting of constructs made up of words that were not directly taken from the concept descriptions.
Control
This dimension is in close proximity to Automation. The included constructs raise concerns regarding who is in control and who has the responsibility in traffic—the driver or the vehicle itself. Even though most constructs in this dimension are more descriptive than evaluative, the dimension still signifies the fact that there was a concern regarding who is controlling the vehicle among many participants, as opposed to the Automation dimension, which merely states that a concept contained automatic features. The data does not show whether most drivers strive for increased control over the vehicle or if they happily hand the control over to something they feel can handle the task better. However, control is an issue that should be dealt with carefully in design.
Versatility
Versatility refers to whether the vehicle was characterized solely as a means of transportation or whether the vehicle had the capacity to be used for other reasons. Examples of such reasons were joyriding, driving in order to improve one’s driving skill, or working while driving. This dimension is fairly evaluative and has a high descriptive richness, which would imply that vehicles and travelling have different meaning to different drivers, and that people use their vehicles for different purposes.
Safety
This dimension relates to the vehicle’s level of safety and is clearly evaluative since few would choose an unsafe car over a safer alternative.
Driving pleasure
This need dimension relates to whether the vehicle is fun to drive, or not, and is evaluative in its nature. Most constructs in this dimension suggest that several participants would rather drive a vehicle that is fun to drive as opposed to one that creates discomfort. This dimension also highlights that a vehicle might evoke emotions, and can be viewed as something more than just a means of transportation.
Freedom of choice
This dimension relates to the driver’s freedom of choice. Example constructs are “Spur of the moment - Strictly follow the protocol” and also “Freedom of choice–Public transport.” This dimension is clearly evaluative, and implies that the participants strive for a high degree of freedom in their transportation.
Self-image
This dimension describes viewing the vehicle as a status symbol, which could be one important aspect of the personal automobile. This is a descriptive dimension.
Fairly Original Dimensions
These construct dimensions contain words that might be taken directly from one concept and constructs that represent an element that one of the concepts strongly implied.
Efficiency
Efficiency is a highly evaluative and fairly original dimension. It is not highly descriptive since efficiency is in most cases related to time efficiency, such as “Saves time–Wastes time.” This dimension, however, outlines one important aspect that the participants would like to see addressed in future vehicles; namely that the driver (or passenger) values his or her time highly and would not easily trade it for time stuck on public transportation or a traffic jam without any possibility to do something more productive.
Simplicity
This construct dimension relates to the vehicle’s ease of use, but can also relate to technological parsimony. This dimension is highly evaluative when ease of use is discussed and, thus, infers that people prefer simple options to complex ones that might be more confusing.
Technology
This construct dimension relates to the vehicle’s level of technological solutions. Constructs within this dimension can be both descriptive and evaluative, since it is hard to tell if the participant readily embraces technology or is reluctant to use it. However, the constructs clearly describe low technology as something of the past as can be seen in the example “Focusing on technology–Old fashioned” and “Technology dense–Technology poor,” which would hint that the functions technology provides, such as active safety systems, are considered positive.
Interaction fluency
The constructs in this dimension highlight what many users referred to as “smooth–clumsy or complicated.” This is both a descriptive dimension as it describes a smooth, seamless, and intuitive interaction with the vehicle and an evaluative dimension, since users would prefer a smooth interaction to a complicated one.
Comfort & convenience
This dimension contains constructs that convey whether the vehicle concept conveys a comfortable ride with convenient features as opposed to a less comfortable, more rigid experience. The dimension has an evaluative nature and suggests that people do not want any unnecessary trouble during their trips. Example constructs are comfortable–uncomfortable, and convenience–complexity.
Driver support
This construct dimension includes constructs related to support systems that help the driver, such as “Caretaking–Independent” and “Degrades the driver–Inspires and raises the driver.” The descriptive content of this dimension makes it hard to draw any conclusions as to whether driving support is sought after or not, but the fairly original nature would imply that safety systems are of interest to the participants.
Environmental impact
This construct dimension describes the level of environmental friendliness the vehicle conveys. “Environment friendly–Energy wasting” is an example construct. This is an evaluative dimension with high descriptive richness, which conveys a broad spectrum of factors that make a vehicle harmful to the environment.
Influenced Dimensions
These dimensions might be mentioned in the concept descriptions, but still raise important issues for vehicle design.
Automation
This construct dimension relates to how the participants perceive the vehicle’s level of automation. This dimension has a descriptive nature, with the most common construct being the “Automatic–Manual” construct. This is the most dominant dimension with a total of 17.4% of all the constructs. The constructs are mostly influenced by the future vehicle concept descriptions, where most of them turned out as highly automated vehicles in different levels. Automation is of course related to the concepts of control and time efficiency.
Ownership
This construct dimension includes constructs that are relevant to vehicle ownership by individuals as opposed to being communal. Carpools, public transports, rental services, or the possibility to purchase services to use a vehicle all belong to this group. This construct dimension is mostly descriptive.
Personalization
This dimension relates to the vehicle’s ability to be customized to the driver’s needs, but also to how flexible the vehicle is. The constructs included have a descriptive nature and high descriptive richness. Example constructs are personal–impersonal, individually adapted–standard, and adaptabl–locked.
Trip context
This dimension includes constructs that discuss the context of a trip. Examples are road type, i.e., rural vs. city, or driving distance, and city traffic as opposed to long distance commuting. This is a descriptive dimension.
Calmness
This dimension mostly contains constructs related to stress and relaxation, which would imply that the participants seek a more relaxed automobile travelling experience. The dominant construct of this dimension is calm-stress. This is both a descriptive and an evaluative dimension.
Connectivity
This is a descriptive dimension that encompasses constructs regarding vehicles connected to each other or to a synchronized transportation network. Example constructs are “Connected to others–Individual solution” and “Synced–Out of Sync.”
Discussion
The discussion section consists firstly of a discussion of the methods used in the workshops and in the RGT, with the aim to highlight issues that affected the outcome, and secondly a discussion of user needs and how these need dimensions can be used.
Workshop Discussion
Designing in, or for, a future can be of help for providing novel features for vehicles. In turn, this meant that participants in the RGT were not biased by advertising campaigns, or other’s opinions, which would have been the case if existing cars had been used. In addition, this approach made users relate to features that do not yet exist, and helped in addressing larger issues regarding sustainability, automation, trust, etc. However, designing future workshops is a delicate process, where the workshop designers must be aware of how their futures affect the outcome. One possibility is to ask the participants to create the futures. This approach may minimize researcher influence further, with the disadvantage of making the participants responsible for determining areas of focus by themselves. Providing pre-made future scenarios is a way to steer participants towards issues of interest that may have been previously identified, as well as minimize the workshop time, but one must still set aside time for participants to discuss, debate, and ultimately customize these futures in order to have a shared understanding. In the present study, the future scenarios focused on issues of trust and technology, as these have been identified as important in previous research (Walker et. al., 2001; Muir, 1994; Muir & Moray, 1996).
The focus on technology and trust can be seen in how the vehicles designed for the utopian future were very automated and/or connected, or very high tech vehicles. Consecutively, this inscribed issues of control/automation into the vehicles. The vehicles designed for the dystopian future were self-contained due to lack of trust in technology as described in the future scenario. Only using a utopian future would leave the trust issues unexplored.
The choice of participants also affected the outcome. Using domain experts can be very valuable, since they may have a full overview of the design space. On the other hand, their extensive knowledge might limit them at the same time. Using “users” as participants can also be beneficial, because they can voice their needs and wants in a way that experts and designers sometimes cannot envision.
RGT Discussion
The effectiveness of the RGT has been thoroughly discussed in multiple studies, i.e., (Normark & Gkouskos, 2012; Fällman, 2010). Creating an online survey format had the advantages of collecting data from 78 participants from multiple locations, and ensuring that participants could complete the study from the convenience of their chosen location, without feeling pressure or being influenced by interviewers. On the other hand, there are aspects of the participant responses that may not have been documented by the web survey, but could have been documented in face-to-face interviews.
The vehicle concepts that were used in the RGT were described in text only in order to avoid constructs related to form, color, etc., since interaction and functionality was of interest rather than appearance. The aim was to encourage participants to envision their ideal versions of human-vehicle interaction for each of the concepts. However, written descriptions need to be short and focus on the most important properties, thus bringing a forced prominence of certain terms or words. Using words as both an input and output response can therefore be somewhat troublesome. Then again, the fact that certain vehicle features are prominent in the elements does not exclude them from being important dimensions in the RGT-participants’ minds, since they obviously were important to the participants that designed them. Moreover, when using words as input it is easy to track construct originality. The 78 participants are believed to have given a broad enough picture of the need dimensions. However, different populations in other cultures could find other aspects being important when considering needs in automobile driving, which would yield a slightly different set of user need dimensions. The analysis of the constructs was made semantically in this study, but in order to find patterns and similarities in participants’ construct ratings in relation to the elements, a statistical analysis can be made with software specifically made for RGT analysis, for example WebGrid. This was, however, not of interest in this study since the elements were not in focus.
Needs, Satisfiers, and Need Dimensions
Throughout the length of scientific discourse, the term “human need” has been used with varying meanings that reflect the diversity of need theories. Sheldon, Elliot, Kim, and Kasser (2001) have provided an excellent summary of prominent need theories. In short, needs are “particular qualities of experience that all people require to thrive” (p. 325). Max-Neef, Elizalde and Hopenhayn (1992) also defined the term ‘satisfiers;’ a satisfier being a tool that fulfills a need. Moreover, a satisfier can fulfill more than one need. While human needs are seen as universal, satisfiers are individualized ways with which needs are fulfilled. While needs are important in the understanding of people, they are abstract and can be hard to design for. In the present study we have uncovered need dimensions. These dimensions can better guide designers to pinpoint satisfiers that reside within the dimension so that they can target qualities of experience that people desire. Thus, the dimensions are a lens with which universal needs can become context specific so that they can more readily be used by design teams. To our knowledge there are no other studies that look at uncovering needs and satisfiers specifically in the human-vehicle interaction context.
Application of the Results
The evaluative ability and descriptive richness measures can inform user research by indicating the types of methods that are appropriate in order to investigate a dimension. Dimensions with high descriptive richness numbers represent a wide variety of terms and should be explored using narratives, such as open-ended interviews, in order to make sense of the fine nuances and diversity within these dimensions. Regarding the dimensions with high descriptive richness, the ones with high evaluative ability have a clear positive pole, whereas the ones with low evaluative ability do not have a clear preferred pole and thus are the most diverse between each user. As for the dimensions with low descriptive richness scores, the ones with low evaluative ability do not have a clear preferred pole but can be explored via surveys since their meaning is homogeneous among participants, while the ones with high evaluative ability can be considered as desirable and therefore should be designed for. The threshold for characterizing a dimension as having a high or low amount of these two measures must be decided by the design team, and also lends itself to becoming a research question for future research.
Another way to utilize the results of the study is to define themes of interest that can be the focus of future designs and research. To this end, the authors conducted conventional content analysis on the construct dimensions (Hsieh & Shannon, 2005). This produced three themes that were specialized and focused on vehicle-human relations. Each theme along with its constructs could be used in order to focus design teams on the issues raised by the corresponding theme.
The first theme is reflected in how novel technology should, or should not, support driving. Here we find dimensions like Technology, Driver Support, Simplicity, Automation, and, most interesting, Control, where participants clearly expressed considerations regarding who should be in control.
The second theme is related to the freedom of choice that people want to have with their vehicles as seen in the constructs Freedom of choice and Versatility. The vehicle can be seen as something else than just a means of transportation and include elements of work places, social spaces, recreational spaces, and so on. As such, Versatility is coupled to Comfort & Convenience, since they both focus on the ride being pleasant rather than edgy and intensely focused on driving. Personalization is also relevant to the freedom of choice, in the sense that the vehicle adapts to its user’s needs, but also in that the user can adapt the vehicle in relation to arising needs.
The third theme is related to the vehicle as being a part of a greater collective of vehicles, or not. This is reflected in the dimensions Ownership; should we own our vehicles or should there be a public pool? Connectivity is also relevant in the sense that we can imagine vehicles communicating with each other, avoiding crashes and forming caravans on highways, or with a larger system that provides public vehicles on demand.
In conclusion, The RGT produced a wealth of information in the form of 390 constructs. These constructs outline important aspects of human vehicle interaction that can be viewed as inspiration to the design of future vehicles. One approach is to explore the themes, aiming to find new design solutions within them – here, exploring automation and control issues in vehicles is particularly promising given the increased interest in diver-less cars. Some of the dimensions, as strong as they may be, are already considered in the design process, e.g., Driving pleasure, Self-image, Safety, Comfort & Convenience, Efficiency, etc. These are comparably “easy” to design for since users tend to agree on them: everyone wants a safe and efficient car. However, it can be very rewarding to explore dimensions with low evaluative ability where users are ambivalent, especially if taking the dimensions to their extremes. One example can be seen in the Ford SYNus concept car (Ford Motor Company, 2005), an ultra-safe city car inspired by safes and bank vaults, which could be turned into a social space, e.g., by turning front seats backwards and by having a built-in widescreen display instead of rear window allowing for pleasant conversation, watching movies, or playing games. As such it expresses extremes within the dimensions Safety, Versatility, and Personalization. Moreover, the need dimensions along with their measures of descriptive richness and evaluative ability can be used as a means to select appropriate methods of user research, and within design, they can be used as a checklist in the design process to see if all user need dimensions were taken into consideration.
Future Work
More work is necessary to improve and refine the need dimensions. The concepts from the workshops need to be compared to other vehicle concepts and to production cars in order to ensure that the same set of need dimensions emerge. The same goes for testing the procedure on differrent types of people. The threshold for characterizing a dimension as having a high or low amount of evaluative ability and descriptive richness also requires further research. Another important future step is to obtain insight into what might be different user clusters or dimensions with similar salient needs. These user clusters would allow designers to be able to fine-tune their requirements for specific need groups in order to better suit a specific user category.
On a different vein, in order to make the above findings applicable for vehicle designers in their everyday work, steps need to be taken in order to develop design methods that can work well with needs and need dimensions.
Conclusion
The combination of methods employed in this study provided a tool that allowed for a deeper understanding of the user’s needs and wants from a vehicle and into the user’s personal priorities and beliefs regarding transportation. Similarly, the combination of Future Workshops and RGT could be used to explore other domains.
Nineteen listed construct categories, i.e., need dimensions, have been discerned: Automation, Calmness, Comfort & convenience, Connectivity, Control, Driver support, Trip context, Driving pleasure, Efficiency, Environmental impact, Freedom of choice, Interaction fluency, Ownership, Personalization, Safety, Self-image, Simplicity, Technology, and Versatility. These suggest several important dimensions that need to be explored in design, and some of the measures also indicate how to explore them. They also point towards larger issues: e.g., how the control over driving should be distributed between the car, the driver, and/or a larger system; the car as a multi-tool instead of “just” a means of transportation; and, lastly, the car as being a connected part to a greater whole. Addressing these dimensions and the issues they point towards may be the difference between creating a one-size-fits-all vehicle into providing a more customized, personal, and potentially more positive user experience.
References
- Alexander, P., Van Loggerenberg, J., Lotriet, H., & Phahlamohlaka, J. (2008). The use of the repertory grid for collaboration and reflection in a research context. Group Decision and Negotiation, 19(5), 479-504.
- Apel, H. (2004, February). The future workshop. In Proceedings of the International Expert Meeting on Theory and Practice of Peace Education (pp. 9-11). Retrieved May 5, 2011, from http://www.die-bonn.de/esprid/dokumente/doc-2004/apel04_02.pdf
- Carroll, J. M. (2000). Five reasons for scenario-based design. Interacting with Computers, 13(1), 43-60.
- Drewes Nielsen, L. (2006). The method and implications of action research. In K. A. Nielsen & L. Svensson (Eds.), Action research and interactive research (pp. 89-116). Maastricht, The Netherlands: Shaker publishing.
- Faste, R, A. (1987). Perceiving needs. Warrendale, PA: Society of Automotive Engineers.
- Fleiss, J. L. (1971). Measuring nominal scale agreement among many raters. Psychological Bulletin, 76, 378-382.
- Ford Motor Company. (2005). SYNUS concept takes urban living to a new level. Retrieved January 5, 2012, from http://media.ford.com/article_display.cfm?article_id=19899
- Fransella, F., Bell, R., & Bannister, D. (2004). A manual for repertory grid technique (2nd Ed.). West Sussex, UK: Wiley.
- Fällman, D. (2006, January). Integrating user experience into the design process with the repertory grid technique: Some preliminary notes. Paper presented at the WP9 Workshop on Innovative Approaches for Evaluating Affective Systems, Stockholm, Sweden.
- Fällman, D., & Waterworth, J. A. (2010). Capturing user experiences of mobile information technology with the repertory grid technique. Human Technology: An Inte rdisciplinary Journal on Humans in ICT Environments, 6(2), 250-268.
- Hassenzahl, M., & Wessler, R. (2000). Capturing design space from a user perspective: The repertory grid technique revisited. International Journal of Human-Computer Interaction, 12(3/4), 441-459.
- Heine, K. (2009). Using personal and online repertory grid methods for the development of a luxury brand personality. The Electronic Journal of Business Research Methods, 7(1), 25-38.
- Hsieh, H. F., & Shannon, S. E. (2005). Three approaches to qualitative content analysis. Qualitative Health Research, 15(9), 1277-1288.
- Jerrard, R. (1998). Quantifying the unquantifiable: An inquiry into the design process. Design Issues, 14(1), 40-53.
- Jungk, R., & Müllert, N. (1987). Future workshops: How to create desirable futures. London, UK: Institute for Social Inventions.
- Karapanos, E. & Martens, J. (2008). The quantitative side of the repertory grid technique: Some concerns. In the workshop Now Let’s Do It in Practice: User Experience Evaluation Methods in Product Development, Human factors in computing systems, CHI’08. 2008: Florence. Retrieved from www.cs.tut.fi/ihte/CHI08_workshop/papers.shtml
- Kelly, G. A. (1955). The psychology of personal constructs, New York, NY: W. W. Norton.
- Krippendorff, K. (1989). On the essential contexts of artifacts or on the proposition that “design is making sense (of things)”. Design Issues, 5(2), 9-39.
- Laurel, B. (2003). Design research: Methods and perspectives. Cambridge, MA: The MIT Press.
- Lyons, J. (1977). Semantics. Cambridge, UK: Cambridge University Press.
- Max-Neef, M., Elizalde, A., & Hopenhayn, M. (1992). Development and human needs. In P. Ekins & M. A. Max-Neef (Eds.), Real-life economics: Understanding wealth creation (pp. 197-213). London, UK: Routledge.
- Muir, B. M. (1994). Trust in automation: Part I. Theoretical issues in the study of trust and human intervention in automated systems. Ergonomics, 37(11), 1905-1922.
- Muir, B. M., & Moray, N. (1996). Trust in automation: Part II. Experimental studies of trust and human intervention in a process control simulation. Ergonomics, 39(3), 429-460.
- Norman, D. (2010). Living with complexity. Cambridge, MA: The MIT Press.
- Normark, C.J., & Gkouskos, D. (2012). Exploring user needs in automobiles. In Proceedings of the 12th International Design Conference (pp. 1369-1376). Somerset, UK: the Design Society.
- Patnaik, D., & Becker, R. (1999). Needfinding: The why and how of uncovering people’s needs. Design management journal, 10(2), 37-43.
- Reynolds T. J., & Gutman, J. (1988). Laddering theory, method, analysis, and interpretation. Journal of Advertising Research, 28(1), 11-31.
- Shaw, M. L. G. (1980). On becoming a personal scientist: Interactive computer elicitation of personal models of the world. London, UK: Academic Press.
- Shaw, M. L. G., & Gaines, B. R. (1995). Comparing constructions through the web. In J. L. Schnase & E. L. Cunnius (Eds.), Proceedings of the 1st International Conference on Computer Support for Collaborative Learning (pp. 300-307). Hillsdale, NJ: Lawrence Erlbaum.
- Sheldon, K. M., Elliot, A. J., Kim, Y., & Kasser, T. (2001). What is satisfying about satisfying events? Testing 10 candidate psychological needs. Journal of Personality and Social Psychology, 80(2), 325-339.
- Tomico, O., Karapanos, E., Levy, P., Mizutani, N., & Yamanaka, T. (2009). The repertory grid technique as a method for the study of cultural differences. International Journal of Design, 3(3), 55-63.
- Van Elslande, P., & Fouquet, K. (2008). Drivers’ needs and safety systems. In J. Abascal, I. Fajardo, & I. Oakley (Eds.), Proceedings of the 15th European Conference on Cognitive Ergonomics: The Ergonomics of Cool Interaction (No. 8). New York, NY: ACM.
- Walker, G. H., Stanton, N. A., & Young, M. S. (2001). Where is computing driving cars? International Journal of Human Computer Interaction, 13(2), 203-229.
- Wikberg Nilsson, Å, & Fältholm, Y. (2011). The future gap: Exploring a critical reflective stakeholder approach. Journal of Management and Sustainability, 1(1), 18-31.
