
Effects of Novelty and Its Dimensions on Aesthetic Preference in Product Design
Wei-Ken Hung 1,* and Lin-Lin Chen 2
1 Department of Industrial Design, Ming-Chi University of Technology, Taipei, Taiwan
2 Department of Industrial and Commercial Design, National Taiwan University of Science and Technology, Taipei, Taiwan
Product designers seek to create novel designs that elicit aesthetic responses from consumers. In this paper, we re-visit the much investigated relationship between novelty and aesthetic preference, but with a new focus on what it is that constitutes novelty in product design. Based on prior research on consumer perception of product appearance, we included in our study three fundamental dimensions of product semantics – trendiness, complexity, and emotion – and investigated their influences on novelty and aesthetic preference. For the study, we selected as stimuli 88 chairs, all highly varied in shape but corresponding to a common prototype: a chair with back support and without arms. We then conducted a semantic differential study on the 88 chairs, in which we measured trendiness, complexity, and emotion by using three sets of bipolar adjectives (“traditional-modern,” “simple-complex,” and “rational-emotional,” respectively), and evaluated novelty and aesthetic preference with an additional set of bipolar adjectives (“typical-unique” and “beautiful-ugly,” respectively.) The results confirmed Berlyne’s hypothesis that the relationship between novelty and aesthetic preference resembles an inverted-U curve, in which the chairs perceived to be most beautiful were those with a moderate level of novelty. Each of the three dimensions – trendiness, complexity, and emotion – formed a positive linear relationship with novelty. These results show that the three fundamental dimensions of product semantics can be regarded as predictor variables for novelty; of the three dimensions, trendiness was shown to have the greatest influence, followed by complexity, and last by emotion. The three dimensions influenced aesthetic preference differently: Both complexity and emotion exhibited inverted-U relationships with aesthetic preference, while trendiness had a small positive linear relationship with aesthetic preference.
Keywords – Product Semantics, Novelty, Aesthetic Preference, Trendiness, Complexity, Emotion.
Relevance to Design Practice – Using photos of chairs as stimuli, we show that chairs with a moderate level of novelty can achieve higher aesthetic preference, in comparison to chairs that are very typical or very novel. In addition, by linking product appearance characteristics to perception of product novelty, we hope to provide information that designers can use in trying to achieve an optimal level of novelty in product design.
Citation: Hung, W. K., & Chen, L. L. (2012). Effects of novelty and its dimensions on aesthetic preference in product design. International Journal of Design, 6(2), 81-90.
Received January 26, 2012; Accepted August 27, 2012; Published August 31, 2012.
Copyright: © 2012 Hung & Chen. Copyright for this article is retained by the authors, with first publication rights granted to the International Journal of Design. All journal content, except where otherwise noted, is licensed under a Creative Commons Attribution-NonCommercial-NoDerivs 2.5 License. By virtue of their appearance in this open-access journal, articles are free to use, with proper attribution, in educational and other non-commercial settings.
*Corresponding Author:hwkm@mail.mcut.edu.tw
Wei-Ken Hung is a Ph.D. candidate in the Department of Industrial and Commercial Design at National Taiwan University of Science and Technology (NTUST) and a lecturer in the Department of Industrial Design at Ming-Chi University of Technology. Since 2006, he has been the project manager of the “ideastorming” initiative: Concept Design of Future Products Project (www.ideastorming.tw), which is funded by Taiwan’s National Science Council and aims to foster cross-disciplinary collaboration between design and engineering researchers. His research interests include product semantics and cross-disciplinary collaboration between design and technology. For his doctoral research, he is focusing on the measurement of contradictory semantics and investigating the relationship between contradictory semantics and aesthetic preference.
Lin-Lin Chen is a professor in the Department of Industrial and Commercial Design at National Taiwan University of Science and Technology (NTUST). She received her Ph.D. from the University of Michigan at Ann Arbor and taught briefly at Iowa State University before returning to Taiwan. Her research focuses on attractiveness of product appearance, computer-aided concept exploration and evaluation, interface design, and geometric algorithms. She was dean of the College of Design at NTUST from 2004 to 2010, president of the Chinese Institute of Design from 2007 to 2008, and convener for the arts (and design) area committee of Taiwan’s National Science Council from 2009 to 2011. She is editor-in-chief of the International Journal of Design, vice president of the International Association of Societies of Design Research (IASDR), and a fellow of the Design Research Society.
Introduction
An understanding of how to create beautiful objects, ones that elicit aesthetic responses such as “sensory pleasure and delight” (Hekkert & Leder, 2008), is fundamental to the profession of design. All design disciplines – including architecture, product design, visual communications design, interface design, animation – combine a knowledge of aesthetics with knowledge of the different embodying technologies of that discipline. In a more commercial context, product appearance has been recognized as an important factor in the success of a product (Bloch, 1995; Hertenstein, Platt, & Veryzer, 2005). By changing different aspects of product appearance, including form, material and color, designers try to communicate messages and elicit responses from consumers (Crilly, Moultrie, & Clarkson, 2004; Creusen & Schoormans, 2005; Hsiao & Chen, 2006). As pointed out by Raymond Loewy in his famous MAYA – “Most Advanced, Yet Acceptable” – principle, a successful design must be as innovative as possible, but not so much as to be considered unacceptable (Loewy, 1951). To achieve higher aesthetic preference among consumers, designers should aim for the best combination of typicality and novelty (Hekkert, Snelders, & van Wieringen, 2003; Hekkert & Leder, 2008).
Several studies in the past have investigated the relationship between novelty and aesthetic preference in product design (e.g., Whitfield, 1983; Hekkert et al., 2003; Blijlevens, Carbon, Mugge, & Schoormans, 2012). In this paper, we re-visit the relationship between novelty and aesthetic preference, but look further into what novelty means in product design. In particular, we employed three fundamental dimensions of product semantics – trendiness, complexity, and emotion – (Hsiao & Chen, 2006) and explored how changes in product semantics affect judgment of product novelty and, in turn, judgment of aesthetic preference. By linking product appearance characteristics to novelty, we hope to offer operational information to designers that can be used to achieve an optimal level of novelty in product design.
Typicality/Novelty and Aesthetic Preference
Prototypicality or typicality is usually defined as the degree to which an object represents a category (Loken & Ward, 1990; Veryzer & Hutchinson, 1998; Hekkert et al., 2003). Barsalou (1985) discussed three possible determinants of typicality: similarity to the ideal of the category, similarity to the central tendency of the category, and frequency of encounters with the object as a category member. To investigate the influences of typicality, some studies have employed the “prototype distortion” approach by systematically varying a given prototypical stimulus (e.g., Veryzer & Hutchinson, 1998; Blijlevens et al., 2012), while other studies have measured perceived typicality by “goodness of example” ratings (e.g., Barsalou, 1985; Hekkert et al., 2003). The concept of novelty, furthermore, is related to typicality. Berlyne (1971) classified two kinds of novelty: absolute novelty – an object that has never been experienced before – and relative novelty – an object that consists of a new combination of previously experienced elements.
Past studies, however, have obtained inconsistent results concerning the relationship between typicality/novelty and aesthetic preference. To examine this relationship, a preference for prototype theory was proposed by Whitfield (1983; Whitfield & Slatter, 1979). Using different styles of chairs as stimuli, Whitfield and his colleagues found a positive linear relationship between typicality and preference. By systematically distorting the stimuli, Veryzer and Hutchinson (1998) found a negative linear relationship between prototype distortion and aesthetic response. Other studies, using houses, paintings, and music performances, have also found a positive relationship between typicality and preference (Purcell, 1984; Hekkert & van Wieringen, 1990; Repp, 1997; Hekkert & Leder, 2008).
Ward and Loken (1988) set out to determine when preference for typicality might not hold. They proposed that when prestige, exclusiveness, or distinctiveness is important to the consumer, the relationship between typicality and preference could be negative rather than positive. In such cases, novel designs might be preferred. In a recent study, Radford and Bloch (2011) found that products with high levels of visual product “newness” elicited more affective reactions than those with lower levels of “newness.” When studying aesthetic appreciation of car interiors, Leder and Carbon (2005) found that participants changed from preferring a classical version to a more innovative version after repeated exposures to the different designs.
The classic research in experimental aesthetics by Berlyne (1974) suggests a third possible model: an inverted-U-shaped relationship between typicality/novelty and aesthetic preference. This model hypothesizes that objects with a moderate level of novelty are preferred over both extremely typical and extremely novel objects. A few studies (Meyers-Levy & Tybout, 1989; Schoormans & Robben, 1997) have confirmed this inverted-U-shaped relationship model.
Instead of treating typicality and novelty as two ends of a continuum, Hekkert and colleagues (2003) measured typicality and novelty separately and investigated their joint influences on aesthetic preference. The results showed that typicality and novelty have large negative correlations, with each tending to inhibit the effect of the other. As a result, in Hekkert’s study the correlations between typicality and aesthetic preference were not significant; nor were correlations between novelty and aesthetic preference. However, when the influence of one variable was taken out, the other variable showed a linear relationship to aesthetic preference, indicating partial independence of the two variables.
Why Such Divergent Results?
From the above review, it can be seen that different theories have been proposed for defining the relationship between novelty and aesthetic preference, including a preference for typicality, a preference for novelty, and a preference for a moderate level of novelty. Among these studies, we thought that the work of Hekkert and colleagues (2003) provides a possible explanation for these divergent results. By treating typicality and novelty as separate factors, they demonstrated partial independence of typicality and novelty. Their findings led us to suspect that there are two linear relations at work – preference for typicality and preference for novelty – and that the multiplication effect of these two linear functions would result in an inverted-U quadratic function, as predicted by Berlyne (1974). We therefore hypothesized that the relationship between the bipolar typicality/novelty dimension and aesthetic preference would be an inverted U-curve.
However, if this relationship is an inverted U-curve, why are there relatively few studies able to show such a relationship? Why have there been such divergent results, with some studies showing a preference for typicality, some a preference for novelty, some a preference for a moderate level of novelty, and others that even show no significant correlation? We thought that the selection of stimuli included in a study could be one of the key issues. Possibly, the selection might not have sufficiently covered the potential range of variations in typicality and novelty. As pointed out by Hekkert et al. (2003), the linear relationship between typicality and aesthetic preference often observed in past studies might be due to the very restrictive range of novelty covered by the set of stimuli.
On the other hand, it is also possible that the range of stimuli might have been too wide – considering that there might exist several, if not many, possible prototypes for a set of stimuli. When judging the degree of typicality/novelty of a stimulus, a participant might compare it to the “prototype” (e.g., a typical chair used as the baseline for comparison) that seems most appropriate to him or her. For example, when evaluating the novelty of a chair, the prototype chosen in a participant’s mind could be a stool, an armchair, a sofa, a bench, an office chair, or a number of other possibilities. Because different participants could be comparing the same chair to different prototypes, the resulting degrees of “novelty” could vary so widely and contain so much noise, so to speak, that the signal – the relationship between typicality/novelty and aesthetic preference – is masked and thus not easily detected.
To investigate the relationship between typicality/novelty and aesthetic preference, we therefore developed a strategy for selecting a suitable set of stimuli. Specifically, we first conducted a pilot study to define a common prototype for the selected product category, and then sought a wide variation of stimuli based on the given prototype. In this way, we tried to select a set of stimuli that were diverse, yet likely to be judged against the same prototype.
What Does Novelty Mean?
How is a stimulus perceived to be “novel”? In what aspects can a stimulus deviate from the “prototype” of a product category? Hsiao and Chen (2006) identified four fundamental factors of affective response to product appearance – trendiness, emotion, complexity, and potency – by conducting three parallel semantic differential studies on cars, armchairs, and kettles. In another study, Blijlevens, Creusen, and Schoormans (2009) found that consumer perception of the appearance of durable products focused on three main attributes – modernity, simplicity and playfulness. These factors summarize how a participant in a study such as ours might evaluate the appearance of a product, and thus they are plausible candidates for dimensions of novelty. In the present study, we adopted the first three factors discussed in Hsiao & Chen (2006): trendiness, emotion and complexity, as these accounted for about 80% of the variance in their three experiments. By including these three dimensions in our study, we aimed to estimate their relative influence on judgments of product novelty. Before discussing the methodology and results of the study, we will first present a review of past research relating to each of these three dimensions.
The trendiness dimension encompasses bipolar adjective pairs such as avant garde–conservative, innovative–imitative, contemporary–traditional,dazzling–ordinary,old–young, futuristic–nostalgic and excited–calm, while the corresponding modernity attribute (Blijlevens et al., 2009) corresponds to characteristics that include modern, old-fashioned, classical, oldish, sleek, futuristic, kitsch and retro. When studying the role played by product appearance in consumer choice, Creusen and Schoormans (2005) found that more than a quarter of the participants mentioned “a modern or contemporary look” as being important to them when choosing a product. Bloch (1995) also noted that “prevailing styles and fashion” can influence consumer preference for product designs. These past studies confirm the importance of trendiness/modernity as a factor in consumer perception of product appearance. By further analyzing appearance characteristics, Hsiao and Chen (2006) found that products with high trendiness values tend to be less prototypical, more symbolic, and more pleasurable, and to have a medium level of functionality, while products having low trendiness values had only one common characteristic – a perceived high functionality. Both Hsiao and Chen (2006) and Blijlevens et al. (2009) also made similar observations about how the definition of trendiness/modernity can change over time.
The emotion dimension corresponds to such bipolar adjective pairs as soft–hard, feminine–masculine, rational–emotional and cute–not cute (Hsiao & Chen, 2006). By further analyzing the appearance characteristics, Hsiao and Chen found that products with high emotion values tend to have curved lines, curved surfaces, and organic forms; whereas products with low emotion values tend to have straight lines, flat surfaces, and geometric forms. This dimension, therefore, could be closely related to the well-recognized curvature factor in aesthetic preference. For example, Leder and Carbon (2005) created three levels of curvature in car interior design to investigate the relationship between curvature and attractiveness ratings. Their studies indicated a preference for more curved versions of the interiors. Bar and Neta (2006) demonstrated people’s general preference for curved objects,by using pairs of real objects, such as watches or sofas, that had the same semantic meaning and general appearance except that one was angular and the other curved in form. By using abstract patterns, Silvia and Barona (2009) examined the effect of angularity on aesthetic preference while controlling for other possible influencing factors, such as symmetry and typicality. Their results also showed a preference for curved objects. On the other hand, Blijlevens et al. (2012) created a series of stimuli varying from angular to rounded shapes and found that aesthetic responses to this series of “angular-curved” variations exhibited an inverted-U-shaped relationship.
The complexity dimension corresponds to the bipolar adjective pair simple–complex, and it mainly relates to the number of design elements in a product (Hsiao & Chen, 2006). Simplicity was also identified by Blijlevens et al. (2009) as one of the main attributes in consumer perception of product appearance. In fact, simplicity/complexity has long been recognized in experimental aesthetics research as an important factor influencing aesthetic preference. Berlyne (1970, 1974) investigated the effect of complexity on aesthetic preference and proposed the existence of an inverted-U-shaped relationship between the two. He hypothesized that objects with a medium level of complexity are preferred over very complex or very simple objects. Hekkert and van Wieringen (1990) tested the influences of complexity and prototypicality on aesthetic appraisal of cubist paintings. For paintings with low and intermediate levels of categorizability, they found an inverted-U-shaped relation between perceptions of complexity and beauty. Some experiments, such as those conducted by Martindale, Moore, and Borkum (1990) and Frith and Nias (1974), however, failed to confirm Berlyne’s hypothesis.
Thus, the three dimensions of product semantics – trendiness, emotion and complexity – that influence consumer perceptions of product appearance are well recognized in the research on product design, consumer studies, and experimental psychology. In several previous studies on the relationship between typicality/novelty and aesthetic preference, each of the three dimensions was sometimes treated as a separate factor alongside novelty (e.g., Berlyne, 1970; Hekkert & van Wieringen, 1990) and sometimes treated as the main constituent of novelty. For example, in Blijlevens et al. (2012) and Veryzer and Huchinson (1998), levels of typicality were manipulated by changing the angularity or curvature of the stimuli. We think that these different treatments reflect how novelty is defined in each case. In this research, we view novelty as the result of an overall appraisal of the visual characteristics of a stimulus, including appraisals of how trendy, how curved, and how complex it is. The result of this overall appraisal is a judgment of the novelty of the stimulus: how different it is from a typical object of its category. For product designers, linking the definition of novelty to the different ways a designer can change the appearance of a product will provide useful information on how to achieve an optimal level of novelty.
Research Methodology
Product Category and Prototype
We selected chairs as the product category for this study because the chair is one of the most representative products in design history. Designers have long applied various techniques to create innovative chair designs, leading to a highly diverse pool of potential stimuli.
As discussed previously, we suspected that the inconsistent results found in studies on the relationship between novelty and aesthetic preference could be due to the selection of stimuli. We therefore began by conducting a pilot study to obtain an operational definition of the shape of a “typical chair.” We asked 34 sophomore students majoring in industrial design to draw sketches in response to the question, “What image comes first to your mind when you hear the word chair.?” The results are shown in Figure 1. An examination of the 34 sketches revealed that 25 of the chairs drawn, a majority, were similar in form: all had four legs, a flat seat, and a vertical back, and all but one had no arms. The other 9 chairs were diverse in their shapes. Based on this pilot study, we designated the shape most commonly illustrated (Figure 1, upper right) as a “typical chair” and used it as a reference for collecting the stimuli.
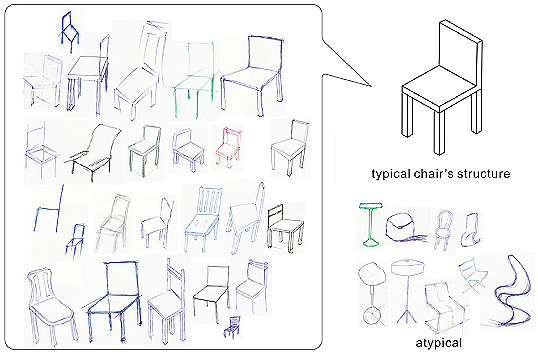
Figure 1. Sketches of a “typical chair.”
Stimuli
Using this “typical chair” (Figure 1, upper right) as a reference, 523 photos of chairs were collected,from the websites of furniture companies and from the book 1000 Chairs (Fiell & Fiell, 1997). Any chairs that seemed more easily perceived as a stool, an armchair, a sofa, a bench, an office chair, or any prototype other than the “typical chair” were then eliminated. Two experienced designers (each with more than 5 years of experience) examined the remaining chairs and eliminated those that were similar in shape, reducing further the total number to 213. Next, card sorting and hierarchical clustering methods were employed to produce the final set of representative chairs. We then asked 5 senior students with design backgrounds to independently sort these final chairs into groups according to similarity of shape. We then analyzed the sorting results by using the hierarchical clustering function of SPSS. Finally, we arrived at 88 representative chairs, of which 41 were from the book 1000 Chairs (produced between 1900 and 1997) and 47 from furniture company websites (produced within the last two decades). These 88 chairs each shared some resemblance to the common “typical chair,” but still covered a range, from highly typical to highly novel. We used high-resolution (7cm x 7cm, 300 dpi) photos of the chairs as stimuli for the experiments. Due to potential copyright issues, we are showing here only line drawings of these chairs, as can be seen in Figure 3 and Table 1.
Participants
The participants in the study, recruited from the student population of Ming-Chi University of Technology in Taiwan, consisted of 60 undergraduate students (39 male and 21 female; 18 to 22 years of age). Participants were paid a small compensation for participating in the experiment.
Measurements
We used the semantic differential method (Osgood, Suci, & Tannenbaum, 1957) for measuring aesthetic preference, novelty, complexity, emotion, and trendiness. Two adjective pairs were selected as the rating scales for aesthetic preference and novelty, as follows:
- Aesthetic preference: ugly – beautiful
- Novelty: typical – unique
Three additional sets of adjective pairs were selected for investigating the effects of the fundamental dimensions of product semantics (Hsiao & Chen, 2006) on aesthetic preference and novelty, as follows;
- Complexity: simple – complex
- Emotion: rational – emotional
- Trendiness: traditional – modern
Procedure
At the beginning of the task, a participant was first familiarized with the range of stimuli by viewing photos of the 88 chairs, which were spread out on a table. Next, the participant evaluated the chairs over the course of five sessions. In each session, the participant divided the 88 chairs, with respect to one of the pairs of adjectives, into 9 groups corresponding to a 9-point rating scale. To reduce cognitive loading, the participant was first asked to divide the chairs into three groups, representing low, medium and high levels, and then to further divide each of these groups into three subgroups, thus arriving at a total of 9 groups. The number of chairs was allowed to be uneven or void in any one group. Participants were also asked to review their groupings and to make any adjustments they thought necessary. Each participant performed the grouping tasks at his/her own pace, and each completed the five sessions in about one hour. Over the course of the five sessions, the participants thus covered all five of the adjective pairs. In general, the 88 chairs were perceived to cover a wide range of variations in product semantics, from simple to complex, from rational to emotional, and from traditional to modern.
Results
Effects of Novelty on Aesthetic Preference
For the 88 photos, we obtained means for each of the five pairs of adjectives. We then tested the hypothesis that preference is an inverted-U function of novelty, by performing fitting, using the SPSS curve estimation tool. The results showed a significant quadratic curve relationship between novelty and aesthetic preference (quadratic estimation: R² = 0.183, F = 9.54, p < 0.05; linear estimation: R² = 0.010, F = 0.84, p > 0.05), as illustrated in Figure 2. Thus, our findings confirm Berlyne’s hypothesis and indicate that a moderate level of novelty achieves the highest level of aesthetic preference.
Design Characteristics of Chairs
In addition to the fitted curve, shown in Figure 2, that relates novelty to aesthetic preference, designers might also like to see how various design characteristics of the chairs were perceived across the range from typical to unique, and how these related to the elicited responses across the range from being beautiful to being ugly. With this in mind, we provide next some preliminary observations on the design characteristics of 12 representative chairs.
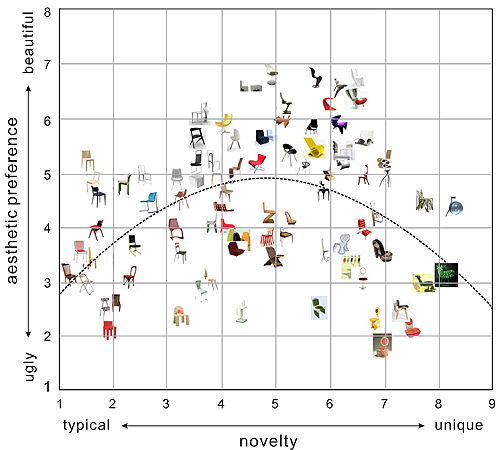
Figure 2. Scatter diagram of novelty vs. aesthetic preference.
Based on Figure 2, we first classified the stimuli into a 4 x 4 grid structure by k-means clustering, using 4 levels of novelty and 4 levels of aesthetic preference. We then selected 12 representative chairs from the cells of the 4 x 4 grid structure, placing 8 of these on the periphery (A, B, C, F, J, L, K, G) and 4 in the middle region (E, D, I, H), as shown in Figure 3(a). A larger image of the 12 representative chairs is shown in a 4 x 4 matrix in Figure 3(b), roughly corresponding to their respective locations in Figure 3(a). Reflecting the inverted U-relationship shown in Figure 2, there were no representative chairs for four of the cells on the 4 x 4 grid.
.png)
Figure 3(a). Relative grid placement of 12 representative chairs (circled).
.png)
Figure 3(b). 4 x 4 grid with 12 representative chairs.
The most typical chairs (A, B, C) are located, in Figure 3(b), in the far left column. These chairs all have the same structure as the “typical chair” in Figure 1: All have four legs, flat seats, and vertical backs. From this starting point, variations in texture, color, and form detail influence the perception of the chairs along the range from beautiful to ugly. Chairs (G-L) that are perceived to be more unique are located in the two columns on the right. These chairs significantly deviate from the “typical chair” in terms of overall form and structure. The unique but ugly chairs tend to feature concrete metaphors, such as a high-heel shoe (H), or other cultural totem (G), or a natural substance such as grass (K), while the unique and beautiful chairs have a relatively abstract and holistic design, for example, they are missing legs or have an unrecognizable seat (L), or consist of a one-piece integrated shape made of one consistent material (I, J).
Chairs in the same row (e.g., C, E, I, and L) have similar aesthetic ratings. Here the perceived novelty appears to increase as the shape of the chair becomes more integrated and deviates more from the “typical chair.” For example, the shape changes from a chair with four legs (C), to a chair with three legs (E), to a chair with integrated legs and back (I), and finally to a chair with no legs at all (L).
We note that these observations are only preliminary and are restricted to this particular set of chairs. Carefully planned experiments using a range of products are needed to test the influence of specific design characteristics on the novelty judgment of products.
Effects of Trendiness, Emotion and Complexity Dimensions on Novelty
To investigate what novelty means, we performed linear regression analysis on the effects of complexity, emotion, and trendiness on novelty. We found significant linear correlations in all cases (r = 0.830, r = 0.901, r = 0.910; p < 0.05), as shown in Figure 4, indicating that a typical chair is usually simple, rational, and traditional, while a novel chair is often complex, emotional, and modern.
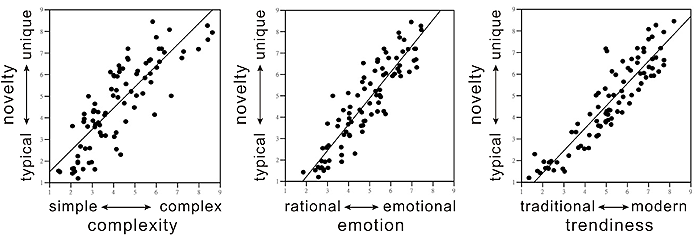
Figure 4. Scatter diagrams of complexity, emotion, and trendiness vs. novelty.
We further performed multiple linear regression analysis and obtained the following regression equation (R² = 0.937; F = 417.8; p < 0.05):
Novelty = –1.383 + 0.586* Trendiness + 0.412* Complexity + 0.270* Emotion
The three dimensions of product semantics account for 93.7% of the variance in novelty. Thus, they can all be regarded as predictor variables for novelty, with trendiness having the greatest influence, followed by complexity, and then emotion.
Effects of Trendiness, Emotion and Complexity Dimensions on Aesthetic Preference
Analyzing the relationship between the three semantic dimensions and aesthetic preference, we found significant inverted-U-curve relationships between complexity and aesthetic preference (quadratic estimation: R² = 0.184, F = 9.57, p < 0.05; linear estimation: R² = 0.019, F = 1.65, p > 0.05), as well as between emotion and aesthetic preference (quadratic estimation: R² = 0.088, F = 4.10, p < 0.05; linear estimation: R² = 0.022, F = 1.94, p > 0.05). For the trendiness dimension, both quadratic and linear relations reach significance (quadratic estimation: R² = 0.161, F = 8.13, p < 0.05; linear estimation: R² = 0.161, F = 16.44, p < 0.05), but the linear relation is more significant. The correlation coefficient between trendiness and aesthetic preference is: r = 0.401, p < 0.01. The scatter diagrams of complexity, emotion and trendiness versus aesthetics, respectively, are shown in Figures 5(b), 5(c), and 5(d). In each of the scattered diagrams, both the fitted quadratic curve and the fitted line are shown. For the trendiness dimension, because the fitted quadratic curve almost coincides with the fitted line, the two curves are indistinguishable, as seen in Figure 5(d). For easy comparison, we also included the scatter diagrams of novelty versus aesthetics, in Figure 5(a).
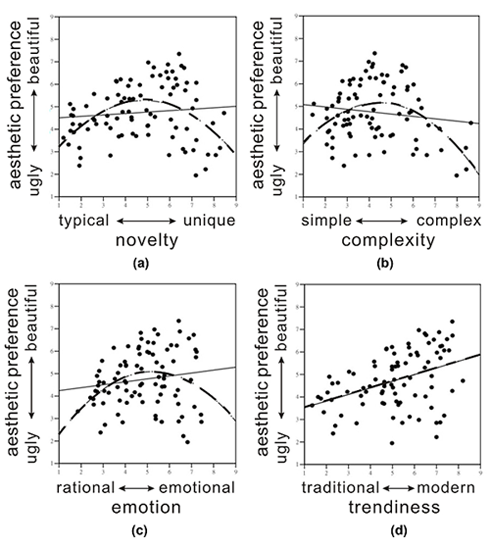
Figure 5. Scatter diagrams of novelty, complexity, emotion, and trendiness vs. aesthetic preference.
The results indicate that the inverted-U-curve relationship between novelty and aesthetic preference could be due to the influence of the complexity and emotion dimensions; whereas the trendiness dimension shows mainly a positive linear influence.
Conclusion and Discussion
In this paper, we have re-visited the much investigated relationship between novelty and aesthetic preference. Following the finding of a partial independence of typicality and novelty by Hekkert et al. (2003), we conjectured the existence of an inverted-U quadratic function between the bipolar qualities of typicality/novelty and aesthetic preference; this quadratic function is seen to result from the multiplication effects of the two linear functions, a preference for typicality and a preference for novelty. We found a significant quadratic curve relationship between novelty and aesthetic preference (R² = 0.183, F = 9.54, p < 0.05), as illustrated in Figure 2. Thus, our findings confirm Berlyne’s hypothesis that the relationship between novelty and aesthetic preference resembles an inverted-U curve. Our results also offer a possible explanation for the divergent findings regarding the relationship between novelty and aesthetic preference. As shown in Hekkert et al. (2003), typicality and novelty are separate factors that have a high negative correlation and thus tend to inhibit the effect of each other. A linear relationship between aesthetic preference and typicality is revealed by partialing out the influence of novelty, while a linear relationship between aesthetic preference and novelty is revealed by partialing out the influence of typicality. The high negative correlation between typicality and novelty means that, in many cases, typicality and novelty could be approximated as a bipolar variable. Since the product (through multiplication) of two linear functions is a quadratic function, the joint influence of preference-for-typicality and preference-for-novelty produce an inverted-U quadratic function for the relationship between bipolar typicality/novelty and aesthetic preference. The inconsistent results obtained in past studies could be a consequence of the selection of stimuli, i.e., whether the set of stimuli varied with regard to both typicality and novelty, or with regard to only one of these factors. The former case could result in an inverted-U curve, while the latter could result in either a preference for typicality or a preference for novelty. Thus, our results extend the findings by Hekkert et al. (2003) and offer a potential theory for explaining the relationship between novelty and aesthetic preference.
Although the quadratic curve relationship between novelty and aesthetic preference is statistically significant, the explanatory power of the model is somewhat limited, because it only accounts for 18.3% of the variance. As can be observed in Figure 2, the chairs perceived to be most beautiful are indeed those with a moderate level of novelty, but the converse statement is not true. Chairs with a moderate level of novelty can elicit a wide range of aesthetic preference, from beautiful to ugly. Why are there such wide variations? Table 1 shows the results of the statistical analysis of the bipolar typicality/novelty ratings for 9 chairs. The left column shows three chairs that were consistently rated as highly typical (and thus had small standard deviations), while the right column shows three chairs that were consistently rated as highly unique. The middle column shows three chairs whose typicality/novelty ratings have the largest standard deviations among the set of stimuli. These three chairs, which received favorable ratings for aesthetic preference, are located in the region that corresponds to a medium level of novelty and a high level of aesthetic preference, as shown in Figure 2. The visual characteristics of these three chairs were developed by adding novel details to prototypical forms, e.g. “chair + umbrella + plant,” “chair + walking cane,” and “chair + cat + birds.” Thus, these three chairs potentially deliver ambiguous messages in terms of typicality and novelty. Their relatively large standard deviations could be due to the ambiguity encountered by participants when trying to assign bipolar typicality/novelty ratings.
Table 1. Typicality/Novelty.
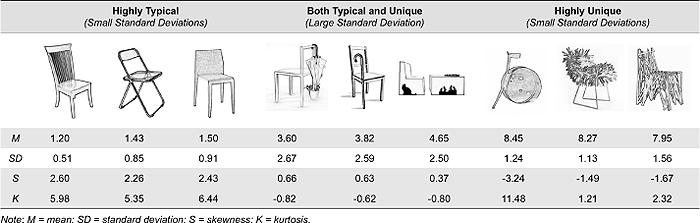
In this research, we approximated typicality/novelty as two ends of a continuum and used bipolar adjective pairs for measuring novelty. There were two reasons for doing so. As discussed above, we hypothesized that the multiplication of the two linear preference-for-typicality and preference-for-novelty functions would result in an inverted-U quadratic function between the bipolar qualities of typicality/novelty and aesthetic preference. To test this hypothesis, we adopted a bipolar typicality/novelty scale for measuring novelty. Another reason is that the semantic differential method (Osgood et al., 1957), which makes use of bipolar adjectives, has been widely applied in design research. A careful examination of the relationship between aesthetic preference and the bipolar qualities of typicality/novelty could offer useful information to design researchers, who might continue to apply semantic differential methods in their research.
This approximation of typicality/novelty as two ends of a continuum works most of the time – but not always. The bipolar scale assumes that high typicality implies low novelty, and vice versa. However, for stimuli successfully combining typicality and novelty, such as those shown in the middle column of Table 1, these assumptions do not hold. It is this failure of assumptions that leads to the relatively large standard deviations. In particular, the bipolar typicality/novelty scale might not be adequate for distinguishing between stimuli that are indeed of medium novelty, stimuli that are both typical and novel, and stimuli that are neither typical nor novel. To deal with such ambiguity, it is necessary to treat typicality and novelty as independent factors. We suspect that the kind of partial independence of typicality and novelty demonstrated by Hekkert et al. (2003) might be present not just for typicality/novelty, but also for other bipolar adjective pairs, such as simple/complex. Issues relating to semantic ambiguity in product design are explored in another study by the authors (Hung & Chen, 2011).
In the present study, we also aimed to examine what constitutes novelty in product design. We have included here three fundamental dimensions of product semantics – trendiness, complexity, and emotion – and investigated their influences on judgment of product novelty and, in turn, judgment of aesthetic preference. We found that each of the three fundamental dimensions in product semantics – complexity, emotion, and trendiness – forms a positive linear relationship (r = 0.830, r = 0.901, r = 0.910; p < .05) with novelty. Furthermore, a multiple linear regression analysis showed that the three dimensions of product semantics account for most of the variance in novelty (R² = 0.937; F = 417.8; p < 0.05). Thus, complexity, emotion, and trendiness can all be regarded as predictor variables for novelty, with trendiness having the greatest influence, followed by complexity, and then emotion.
How do these dimensions account for the effect of novelty on aesthetic preference? We found significant inverted-U-curve relationships between complexity and aesthetic preference (R² = .184, F = 9.57, p < 0.05), as well as between emotion and aesthetic preference (R² = 0.088, F = 4.10, p < 0.05). On the other hand, the relationship between trendiness and aesthetic preference follows a positive linear relationship (R² = 0.161, F = 16.44, p < 0.05). The results indicate that the inverted-U-curve relationship between novelty and aesthetic preference could be due to the influence of the complexity and emotion dimensions; whereas the influence of the trendiness dimension is mainly linear. A possible consequence of these findings is that, when studying the effects of novelty on aesthetics, if the complexity and emotion dimensions are treated as separate factors – and not as aspects of novelty – the relationship between novelty and aesthetic preference will likely be linear, because novelty would then be mainly determined by trendiness.
As discussed above, our results indicate that the trendiness dimension has the greatest influence on novelty, and its influence on aesthetic preference is linear with a correlation coefficient of 0.401 (p < 0.01). This is not surprising, as trendiness/modernity often show up as the most important factor affecting consumer perception of product appearance (Hsiao & Chen, 2006; Blijlevens et al., 2009). However, while the complexity dimension has been shown to relate to the number of elements seen in a product’s appearance, and the emotion dimension has been shown to relate to curves and curved surfaces (Hsiao & Chen, 2006), it is not easy to define “trendiness/modernity” in terms of specific visual characteristics of product appearance. Blijlevens et al. (2009) observed that “in the 1980’s angular products were modern, while now organic forms are more contemporary” (p. 33). Hsiao and Chen (2006) also observed that trendiness “varies with what is in vogue currently” (p. 561). A possible factor influencing the perception of trendiness might be familiarity resulting from repeated exposure, as discussed in Leder and Carbon (2005). Additional studies are needed to further understand the influence of trendiness on aesthetic preference.
Acknowledgements
The authors are extremely grateful to the two anonymous reviewers of this paper, whose insightful and constructive comments helped us to significantly improve the manuscript. The authors would also like to thank Taiwan’s National Science Council for providing financial support for this research, under grant number NSC 97-2410-H-011-021-MY3.
References
- Bar, M., & Neta, M. (2006). Humans prefer curved visual objects. Psychological Science, 17(8), 645-648.
- Barsalou, L. W. (1985). Ideals, central tendency, and frequency of instantiation as determinants of graded structure. Journal of Experimental Psychology: Learning, Memory, and Cognition, 11(4), 629-654.
- Berlyne, D. E. (1970). Novelty, complexity and hedonic value. Perception and Psychophysics, 8, 279-286.
- Berlyne, D. E. (1971). Aesthetics and psychobiology. New York, NY: Appleton-Century-Crofts.
- Berlyne, D. E. (1974). Studies in the new experimental aesthetics. New York, NY: Wiley.
- Blijlevens, J., Carbon, C. C., Mugge, R., & Schoormans, J. P. L. (2012). Aesthetic appraisal of product designs: Independent effects of typicality and arousal. British Journal of Psychology, 103(1), 44-57.
- Blijlevens, J., Creusen, M. E. H., & Schoormans, J. P. L. (2009). How consumers perceive product appearance: The identification of three product appearance attributes. International Journal of Design, 3(3), 27-35.
- Bloch, P. H. (1995). Seeking the ideal form: Product design and consumer response. Journal of Marketing, 59(3), 16-29.
- Creusen, M. E. H., & Schoormans, J. P. L. (2005). The different roles of product appearance in consumer choice. Journal of Product Innovation Management, 22(1), 63-81.
- Crilly, N., Moultrie, J., & Clarkson, J. P. (2004). Seeing things: Consumer response to the visual domain in product design. Design Studies, 25(6), 547-577.
- Fiell, C., & Fiell, P. (1997). 1000 chairs. New York, NY: Taschen.
- Frith, C. D., & Nias, D. K. B. (1974). What determines aesthetic preferences? Journal of General Psychology, 91(2), 163-173.
- Hekkert, P., & Leder, H. (2008). Product aesthetics. In H. N. J. Schifferstein & P. Hekkert (Eds.), Product experience (pp. 259-285). San Diego, CA: Elsevier.
- Hekkert, P., Snelders, D., & van Wieringen, P. C. W. (2003). Most advanced, yet acceptable: Typicality and novelty as joint predictors of aesthetic preference in industrial deign. British Journal of Psychology, 94(1), 111-124.
- Hekkert, P., & van Wieringen, P. C. W. (1990). Complexity and prototypicality as determinants of the appraisal of cubist paintings. British Journal of Psychology, 81(4), 483-495.
- Hertenstein, J. H., Platt, M. B., & Veryzer, R. W. (2005). The impact of design effectiveness on corporate financial performance. Journal of Product Innovation Management, 22(1), 3-21.
- Hsiao, K. A., & Chen, L. L. (2006). Fundamental dimensions of affective responses to product shapes. International Journal of Industrial Ergonomics, 36(6), 553-564.
- Hung, W. K. & Chen, L. L. (2009). Exploring relationships between product aesthetics, typicality and preference, In Proceedings of the 3rd IASDR Conference on Design Research [CD ROM]. Seoul, South Korea: Korean Society of Design Science.
- Hung, W. K. & Chen, L. L. (2011). Aesthetics and contradiction in product semantics. In Proceedings of the 4th IASDR Conference on Design Research [CD ROM]. Delft, the Netherlands: TU Delft.
- Leder, H., & Carbon, C. C. (2005). Dimensions in appreciation of car interior design. Applied Cognitive Psychology, 19(5), 603-618.
- Loewy, R. (1951). Never leave well enough alone. New York, NY: Simon and Schuster.
- Loken, B., & Ward, J. (1990). Alternative approaches to understanding the determinants of typicality. Journal of Consumer Research, 17(2), 111-126.
- Martindale, C., Moore, K., & Borkum, J. (1990). Aesthetic preference: Anomalous findings of Berlyne’s psychobiological theory. American Journal of Psychology, 103(1), 53-80.
- Meyers-Levy, J., & Tybout, A. (1989). Schema congruity as a basis for product evaluation. Journal of Consumer Research, 16(1), 39-54.
- Osgood, C. E., Suci, G. J., & Tannenbaum, P. H. (1957). The measurement of meaning. Urbana, IL: University of Illinois Press.
- Purcell, A. T. (1984). The aesthetics experience and mundane reality. In W. R. Crozier & A. J. Chapman (Eds.), Cognitive processes in the perception of art (pp. 189-210). Amsterdam, the Netherlands: North-Holland.
- Radford, S. K., & Bloch, P. H. (2011). Linking innovation to design: Consumer responses to visual product newness. Journal of Product Innovation Management, 28(1), 208-220.
- Repp, B. H. (1997). The aesthetic quality of a quantitatively average music performance: Two preliminary experiments. Music Perception, 14(4), 419-444.
- Schoormans, J. P. L., & Robben, H. S. J. (1997). The effect of new package design on product attention, categorization, and evaluation. Journal of Economic Psychology, 18(2-3), 271-287.
- Silvia, P. J., & Barona, C. M. (2009). Do people prefer curved objects? Angularity, expertise, and aesthetic preference. Empirical Studies of the Arts, 27(1), 25-42.
- Veryzer, R. W., & Hutchinson, J. W. (1998). The influence of unity and prototypicality on aesthetic responses to new product designs. Journal of Consumer Research, 24(4), 374-385.
- Ward, J., & Loken, B. (1988). The generality of typicality effects on preference and comparison: An exploratory test. In M. J. Houston (Ed.), Advances in consumer research (pp. 55-61). Provo, UT: Association for Consumer Research.
- Whitfield, T. W. A. (1983). Predicting preference for familiar, everyday objects: An experimental confrontation between two theories of aesthetic behavior. Journal of Environmental Psychology, 3(3), 221-237.
- Whitfield, T. W. A., & Slatter, P. E. (1979). The effects of categorization and prototypicality on aesthetic choice in a furniture selection task. British Journal of Psychology, 70(1), 65-75.
