
Beyond Surprise: A Longitudinal Study on the Experience of Visual-Tactual Incongruities in Products
Geke D. S. Ludden 1,*, Hendrik N. J. Schifferstein 2, and Paul Hekkert 2
1 Department of Industrial Design Engineering, University of Twente, Enschede, The Netherlands
2 Department of Industrial Design, Delft University of Technology, Delft, The Netherlands
When people encounter products with visual-tactual incongruities, they are likely to be surprised because the product feels different than expected. In this paper, we investigate (1) the relationship between surprise and the overall liking of the products, (2) the emotions associated with surprise, and (3) the long-term effects of surprise. We created products that were similar in visual appearance but that differed in their tactual characteristics. Participants evaluated the same products at three different points in time. Surprise was often followed by the emotions interest, fascination, amusement, confusion, indignation and irritation. We suggest that the liking for surprising products may be the composite effect of a decreased liking due to unfamiliar characteristics and increased liking due to positive emotions following surprise. Although the effect of surprise diminishes over time, it persists and can be demonstrated at multiple occasions.
Keywords – Surprise, Incongruity, Emotion, Multisensory, Design.
Relevance to Design Practice – Designers may benefit from designing surprising products, because surprising products attract attention, offer new experiences to users and trigger further exploration of the product. The present study is the first to investigate the effects of surprise on the longer term, during repeated encounters with the product.
Citation: Ludden, G. D. S., Schifferstein, H. N. J., & Hekkert, P. (2012). Beyond surprise: A longitudinal study on the experience of visual - tactual incongruities in products. International Journal of Design, 6(1), 1-10.
Received July 5, 2011; Accepted February 14, 2011; Published April 30, 2012.
Copyright: © 2012 Ludden, Schifferstein, & Hekkert. Copyright for this article is retained by the authors, with first publication rights granted to the International Journal of Design. All journal content, except where otherwise noted, is licensed under a Creative Commons Attribution-NonCommercial-NoDerivs 2.5 License. By virtue of their appearance in this open-access journal, articles are free to use, with proper attribution, in educational and other non-commercial settings.
*Corresponding Author: g.d.s.ludden@utwente.nl
Geke D. S. Ludden is an assistant professor at the Faculty of Engineering Technology (Product Design Chair) of the University of Twente. Her research topics include (but are not limited to) (multi)sensory design, surprise, and design for behaviour change. She is a member of the board of the Design & Emotion Society. Her research has been published in, among others, Design Issues, Empirical Studies of the Arts, and the International Journal of Design.
Hendrik N. J. (Rick) Schifferstein is an associate professor at the Faculty of Industrial Design Engineering of Delft University of Technology. His topics of interest include (multi)sensory perception, consumer experience, and experience-driven innovation. Among others, he has published in Acta Psychologica, Marketing Letters, Chemical Senses, International Journal of Design, and Journal of Experimental Psychology: Human Perception and Performance. He has also co-edited the books Food, People and Society (2001; Springer), Product Experience (2008; Elsevier), and From Floating Wheelchairs to Mobile Car Parks (2011; Eleven).
Paul Hekkert is a full professor of form theory and head of the department of Industrial Design at the Faculty of Industrial Design Engineering of Delft University of Technology. Paul is co-editor of the books The Experience of Everyday Things (2004) and Product Experience (2008), and author of Vision in Design: A Guidebook for Innovators (2011, BIS Publishers). He is co-founder and chairman of the Design & Emotion Society and serves as a member of the editorial boards for The Design Journal, Empirical Studies of the Arts, and International Journal of Design.
Introduction
During everyday activities people almost continuously use products, and while doing so they experience a variety of emotions (Desmet, 2008; Richins, 1997). Someone may, for example, experience anger because his or her computer is not functioning properly, or someone may experience joy while riding a new bicycle. To some extent, designers can influence the emotions people experience when they are using products. In this paper, we focus on how designers may deliberately create surprising products in order to attract attention to their products or to let users experience something new.
One of the strategies designers use to create surprising products is incorporating visual-tactual incongruities (Ludden, Schifferstein, & Hekkert, 2008). Upon seeing such an object, an expectation will be formed about how the product feels, based on the visual impression of the product, previous experiences with that product, or experiences with similar products. Eventually, upon touching the product, the expectation is disconfirmed, resulting in a surprise reaction. An example of such a product is a vase that looks like a familiar crystal vase, but that is made out of plastic and, therefore, feels much lighter than people expect. Previous studies have demonstrated that products with visual-tactual incongruities indeed surprise people (Ludden, Schifferstein, & Hekkert, 2009).
Degree of Incongruity
Presumably, designers who create surprising products by incorporating visual-tactual incongruities in their designs aim to create pleasant surprises. However, the degree of incongruity that people perceive may influence their overall evaluation of the product. Berlyne (1971) suggested that the relationship between incongruity and pleasantness follows an inverted U-curve: a moderate degree of incongruity will be perceived as more pleasant than no incongruity, while a high degree of incongruity will be perceived as less pleasant than moderate incongruity. Other researchers have found support for Berlyne’s theory (e.g., Hopkins, Zelazo, Jacobson, & Kagan, 1976). However, the stimuli used in their research were primarily simple visual patterns such as polygons.
Researchers studying stimuli that were more meaningful to people (such as consumer products) and that varied in the degrees of familiarity or prototypicality, found that these variables explained most variation in aesthetic preference. Whitfield (1983), for example, showed that furniture that was more representative (prototypical) for its category (e.g., chair or table) was preferred over furniture that was less representative. Furthermore, in a study on cubist paintings, Hekkert and van Wieringen (1990) demonstrated a linear relationship between beauty and prototypicality for representational (and therefore meaningful) works. In addition, Hekkert (1995) found that the preferred proportions of objects with a rectangular shape were mainly determined by their familiar proportions and not by some universal, aesthetic mathematical rule, such as the Golden section.
For consumer products, congruity typically contributes positively to prototypicality. After all, product attributes are perceived as congruent when they confirm the perceiver’s expectations, which is more often the case with prototypical products. This line of reasoning suggests that consumers prefer products that provide congruent information. Feeling something that is different from what was expected may startle someone, making the tactual aesthetic experience less pleasant. Therefore, a larger degree of visual-tactual incongruity in a product might have a negative effect on product appreciation. However, a previous study on products with visual-tactual incongruities (Ludden et al., 2009) suggested that these products were in most cases evaluated positively, where a surprise reaction was usually followed by a positive emotion such as amusement or interest. In some instances, though, the surprise reaction was followed by a negative emotion such as confusion.
We hypothesize, then, that the overall evaluation of products with visual-tactual incongruities is determined by a negative aesthetic reaction to the disconfirmed expectations and either a positive or a negative effect of the emotional reaction following the surprise (Hekkert & Leder, 2008). Whether a positive or a negative emotion follows the surprise reaction will ultimately determine the overall evaluation of the product. Experiencing a positive emotion may overcome the negative effect of perceiving an unexpected tactual characteristic, whereas a negative emotion enhances this effect. The next section discusses in more detail how surprise is related to other emotions.
Emotions Following Surprise
In a previous study, we found tentative evidence that surprise in products can be seen as the first stage in a process evoking different emotions (Ludden et al., 2009). An analysis of facial expressions of surprise showed that in 19% of the cases in which a facial expression of surprise was observed, the facial expression revealed two stages. The first stage comprised one of the subcomponents of a surprise expression (widened eyes, opened mouth or raised eyebrows) and the second stage consisted of either an expression of joy or amusement (raised mouth corners: smiling) or of puzzlement or interest (lowered eyebrows: frowning).
According to appraisal theory, emotions are the result of an individual’s evaluation and interpretation (appraisal) of events in the environment (Roseman & Evdokas, 2004; Scherer, 1987; Smith & Ellsworth, 1985). Lazarus and Smith (1988) see true appraisal as the assessment of the implications of events for an individual’s goal commitments. Most appraisal models suggest that combinations (sequences) of several different appraisal types eventually cause an emotion. In addition, if multiple appraisals are made in succession, multiple emotions may be experienced consecutively.
Several researchers (Meyer, Reisenzein, & Schutzwohl, 1997; Scherer, 1987) have argued that a sequence of appraisals that starts with an unexpected event usually elicits surprise, after which the surprising event is further evaluated and a second emotion is elicited. For instance, Silvia (2005) suggests that surprise usually precedes interest. In this case, the appraisal of novelty that elicits surprise is followed by an appraisal of coping potential, which evokes interest. Vanhamme and Snelders (2001) found that surprise can be followed by satisfaction, while Ludden, Hekkert, and Schifferstein (2006) reported that surprise reactions were followed by amusement, fascination, disappointment, indignation, and irritation.
Long-term Effect of Surprise
Because the phenomenon of surprise relies on the disconfirmation of expectations that were formed based on previous experience, one may expect that surprise is only felt when someone experiences a product for the first time. When a product with a visual-tactual incongruity is encountered for the first time, its visual appearance may be misleading. However, after touching the product, the perceiver of the product will update his or her knowledge. The “previous experience” of the perceiver has now changed. The second time someone encounters the same product, his or her expectations about the product probably matches the actual (tactual) experience and, therefore, he or she will not be surprised again upon touching the product. Participants in previous experiments indeed sometimes mentioned that a surprise was a one-time experience and that surprising products would become boring in the long-term (Ludden, et al., 2006). To our knowledge, the effects of surprise on people’s emotional reactions in the long-term have not been studied before.
Experiencing a surprising product is arousing and captures attention to the product, which leads to increased product recall and recognition, and to increased word-of-mouth (Derbaix & Vanhamme, 2003). Furthermore, surprise requires a more effortful, conscious, and deliberate analysis of the unexpected event (Meyer, Niepel, Rudolph, & Schutzwohl, 1991; Meyer, Reisenzein, & Schutzwohl, 1997; Stayman, Alden, & Smith, 1992). Therefore, we expect that products with visual-tactual incongruities are remembered better and that people are more interested in seeing/feeling surprising products again.
The Present Study
This study investigated people’s reactions to products with visual-tactual incongruities upon repeated presentation. To be able to study these issues in relation to product design, we created sets of products with visual - tactual incongruities as stimuli. The visual appearance of all three products in a set was kept as similar as possible, while the tactual characteristics of the three products differed. In order to investigate the long-term effects of surprise, the same product was presented to participants at three different points in time.
We hypothesize that perceiving visual-tactual incongruity will have a negative effect on the aesthetic appreciation of tactual characteristics. Because the overall evaluation of products with visual - tactual incongruities may be the composite of a negative aesthetic reaction to the disconfirmed expectations and either a positive or a negative effect of the emotional reaction following the surprise, we do not expect to find an effect of type of incongruity on overall liking.
Because several emotions have been found to be associated with surprise, we expect to find increased emotion ratings for products with visual-tactual incongruities. We are interested in finding out whether a surprise is only felt when someone experiences a product for the first time, or whether the surprise response persists after one or more presentations. We expect the emotional responses to continue to follow surprise responses at the second and third stimulus encounters. Because a surprise reaction is often associated with increased interest, we expect that products with visual - tactual incongruities are remembered better and that people will be more interested in seeing/feeling surprising products again.
Experiment
Method
Participants
A total of 62 participants (36 female and 26 male, aged 18-36, mean 22.6) participated in the first part of this study. Sixty participants continued with the second part of the study and 57 participants completed all three parts of the study. Analyses of data obtained in the first part of the study were carried out on the total of 62 participants. Longitudinal analyses were carried out on the 57 participants that completed all three parts of the study. Participants were students and were paid for their participation.
Stimuli
We created six product sets, each containing three variants of the same product (Table 1). The size of visual - tactual incongruity was manipulated within product sets. The visual appearance of all three products in a set was kept as similar as possible, while the tactual characteristics of the three products differed. The visual appearance of these products elicited an expectation about how the product would feel. The tactual properties of the products in each set were designed either to confirm this expectation (No Incongruity, NI), to be moderately incongruent (MI), or to be largely incongruent (LI) with the expected properties. During the creation of the various product sets, we tried to vary the product properties on as many tactual dimensions as possible, including heaviness, hardness, flexibility, roughness, and stickiness. The product sets either consisted of larger products typically placed on the floor, or of smaller products typically placed on a table. Table 1 lists the six product sets with detailed descriptions of the three variants per set, and Figure 1 shows two examples of sets of products. By including different product types and manipulating multiple tactual dimensions, we aimed to increase the generalizability of the results.
Table 1. Stimuli with detailed descriptions and tasks.
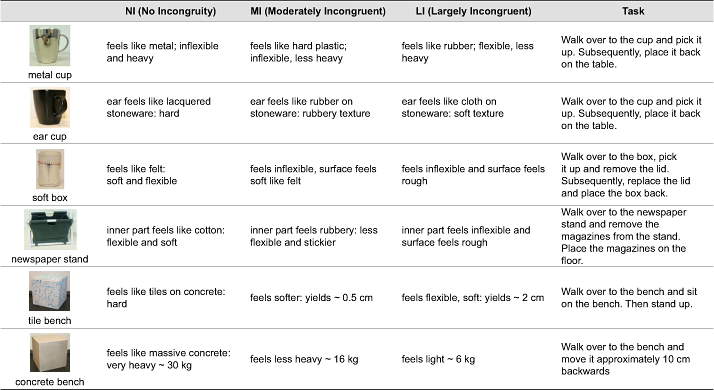
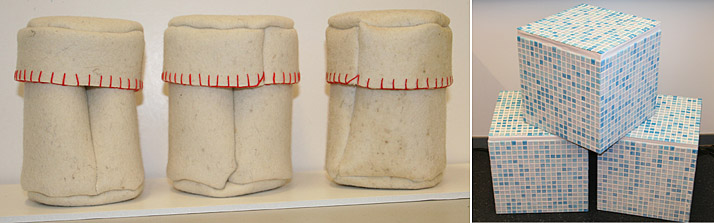
Figure 1. Two examples of product sets: Soft boxes (left) and tile benches (right).
Because all products were newly designed for the present experiment, we were unsure how our participants would perceive the degrees of incongruities. Therefore, the surprise scores at the first measurement were used as a manipulation check for all products in the test and, if necessary, product categorization was adapted.
Experimental Design
Participants were presented with six (out of 18) stimuli, one from each set. Two were expected to be NI products, two MI products, and two LI products. In this way, 19-21 participants evaluated each stimulus. The order in which participants evaluated the stimuli was randomized. Participants evaluated the same products at three different points in time; after the first evaluation (T = 1) the second evaluation took place 14 - 21 days later (T = 2), and the third evaluation took place 7-14 days after the second (T = 3).
Procedure for First Encounter
The stimuli were placed in a room, with the larger products placed on the floor and the smaller products placed on a table. All products were covered. A chair was placed in front of one of the stimuli at a distance of approximately 1.5m. A participant was instructed to sit on the chair and look at the product in front of him/her. Subsequently, the experimenter would uncover the first product and instruct the participant to perform a simple task with the product. The tasks were different for each product, because different tactual characteristics were manipulated for the different sets of products (see Table 1).
After performing the task, the participant was instructed to sit at a separate table and fill in a questionnaire. The questionnaire consisted of two main parts. Unless indicated otherwise, responses were given on 9-point scales with end points “do not agree at all” and “agree completely”. The first part of the questionnaire contained questions related to the size of the incongruity and the pleasantness of the stimuli. Three questions measured Surprise: The (product) felt exactly as I expected (when I saw it); I am surprised about how this (product) feels; and I am amazed about how this (product) feels (Ludden et al., 2009). Tactual-liking was measured by a single item: I like the way this (product) feels. Three items measured Overall-liking: I like this (product); This (product) is nice; and I like the way this (product) looks.
In the second part of the questionnaire, participants were asked to evaluate to what extent they felt eight different emotions: After I touched the (product) I was interested / fascinated / amused / disappointed / confused / indignant / satisfied / irritated on eight separate 5-point scales with end points “not at all” and “very much” and midpoint “a little.” This set includes the majority of emotions that have been associated with surprise reactions to products according to our literature review. Finally, to gain further insight into why the participants felt certain emotions, they were asked to write down why they felt the way they did.
Procedure for Second and Third Encounter
The procedures for the second and third encounters with the stimuli were largely the same as for the first encounter. However, before evaluating the products, in a separate room participants were instructed to give a short description of the products they remembered having evaluated on the previous occasion(s). Subsequently, participants were provided with an overview of the stimuli (shown 5×5 cm color photographs) and were asked to indicate which of the products they would like to see and feel again. After performing these tasks, participants entered the experimental room and were presented with the same six products they evaluated the previous time. Participants were instructed to answer the questions according to their current experience.
Data Analysis
All responses on scales were coded 1-9 or 1-5. Internal consistency of the proposed sum scales was evaluated using Cronbach’s α. As manipulation check, we tested whether NI, MI and LI versions of products differed on the level of surprise participants felt, using between-subjects analysis of variance (ANOVA) with Bonferroni adjustment for multiple comparisons.
Because the experience of emotions is specific for individuals, within-subjects analyses are more suitable for research questions considering the experience of emotions (Silvia, 2007). Our data set has a multilevel structure, in that responses on different variables and on three different points in time are nested within people. Therefore, we used multilevel modeling to investigate the relationship between surprise and other emotions (Kreft & de Leeuw, 1998; Silvia, 2007), as well as to examine the effect of time (Bijleveld & van der Kamp, 1998) within subjects. To perform the multilevel analyses, the SPSS MIXED procedure was used, employing restricted maximum likelihood estimation. The coefficients were modeled as random effects (Painter, 2003). Participants’ comments on why they felt certain emotions were used to illustrate the results.
To investigate effects of incongruity size on Tactual-liking, Overall-liking and the experience of emotions, we could not use multilevel modeling because every participant was presented with only one product from each set. Instead, we performed between-subjects ANOVA and analyzed our data as if each participant had evaluated only a single product. To test general effects of incongruity size on Tactual-liking, Overall-liking and the experience of emotions, we performed these analyses on the aggregated data of the four product sets for which our manipulations were successful. However, we report results for individual sets if they clearly disconfirm the aggregate analysis.
Finally, for the additional two questions participants answered before the second and third presentation of the stimuli regarding the products they remembered and wanted to see and feel again, frequencies of the products mentioned were counted and subjected to ANOVA with Type of stimulus (three levels, NI, MI, LI) as factor.
Results
Manipulation Check
Table 2 shows the results of separate ANOVAs per product set with Surprise (3 items, α = 0.92) as the dependent variable at first evaluation (T=1). Scores for NI, MI and LI products were evaluated in paired comparisons. In terms of surprise, a successful manipulation would mean that scores on Surprise for NI versions of products were low, MI versions scored intermediate, and the LI products received the largest scores.
Table 2. F-values and mean scores per product on Surprise at first evaluation (T = 1).
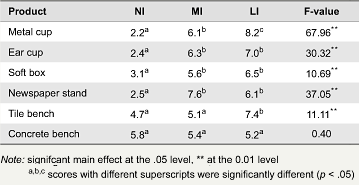
We found main effects on Surprise (all p < 0.01) for all but one product set. For the concrete benches, no significant differences were found between products. Possibly, our participants compared them to other familiar benches or did not have any experience in lifting concrete objects, and were surprised how heavy they all were. Although the tile benches showed a significant main effect and the means showed the expected pattern, the difference between NI and MI benches did not reach statistical significance. The NI tile bench obtained a relatively high Surprise score in comparison with other NI products. This suggests that participants did not expect the seat of the bench to be hard and completely inflexible. In addition, the Surprise score for the MI tile bench was relatively low, suggesting that its flexibility did not really surprise the participants. Because the concrete benches and the tile benches did not show the expected difference between NI and MI products and, thereby, deviated from the other product sets, we did not use them in any further analyses.
For the remaining four product sets (metal cups, ear cups, soft boxes and newspaper stands) we found a significant main effect performing ANOVA, and the scores for the NI version were significantly lower on Surprise than for the MI and LI versions. However, the differences between MI and LI means were only significant for the metal cups. In addition, and contrary to what was expected, for the newspaper stands the MI version tended to have a higher mean score on Surprise than the LI version. Possibly, participants were more surprised by the rubbery, sticky texture of the MI canvas newspaper stand than by the roughness of the LI stand. Therefore, in further analyses we treated the stimulus that was designed as the MI version of the newspaper stand as the LI version and vice versa.
All subsequent analyses were done at the aggregate level combining all data from the remaining four product sets. We performed an additional analysis to check whether the difference between the MI and LI variants, which was only significant for the metal cups in the analyses per product set, would be significant in the aggregate data analysis. This analysis indeed showed that the mean Surprise score was higher for LI than for MI products in the paired comparison (p < 0.05, Figure 2).
Effect of Degree of Incongruity on Product Evaluation
To test for the effects of degree of incongruity on the aesthetic appreciation of tactual characteristics and on overall product evaluation, we used the data obtained in the first evaluation of products (T = 1) and included Tactual-liking or Overall-liking (Three items, α = 0.89) as dependent variables in ANOVAs with Type of stimulus as factor. We found a significant main effect of Type of stimulus on Tactual-liking (F(2,245) = 18.2, p < 0.001). As expected, paired comparisons show that mean ratings were lower for the MI and LI versions of products than for the NI versions of products (Figure 2). However, there was no difference in mean scores between MI and LI products. We found no main effect of Type of stimulus on Overall-liking at the first evaluation.
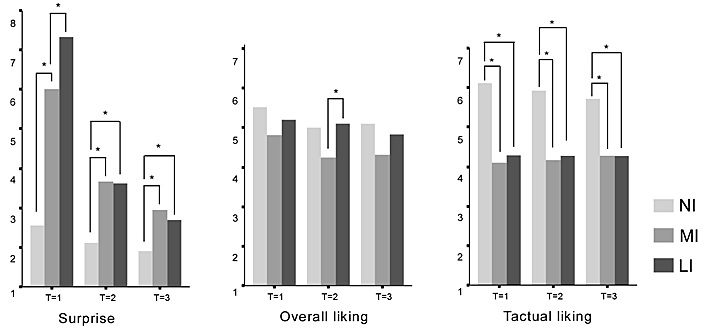
Figure 2. Ratings on surprise, tactual liking and overall liking at three different points in time for NI, MI and LI versions of products. [Note: * Significant difference in paired comparisons (p < 0.05)].
The same analyses at T = 2 and T = 3 showed a similar pattern for the appreciation of tactual characteristics, where mean scores on Tactual-liking were lower for MI and LI versions of products. Mean scores on Overall-liking were also similar to those at the first evaluation. However, we now found a main effect of Type of stimulus on Overall-liking at the second evaluation (F(2,237) = 3.67, p < 0.05). Paired comparisons showed that ratings were lowest for the MI versions of products (see Figure 2).
Long-term Effects of Surprise
To investigate if surprising products were remembered better, we calculated how often participants mentioned products in the three different types before their second or third evaluation of the products started. These numbers were subjected to between-subjects ANOVAs with Type of stimulus as explanatory variable. We expected that LI and MI versions of products would be mentioned more often than NI versions. However, for both T = 2 and T = 3, we found no main effect of Type of stimulus (F(2,237) < 1.0, p > 0.20). Means for all three types were between 0.7 and 1.0 suggesting that overall, products were remembered well. When similar analyses were performed per product, we found a main effect for the ear cups only at T = 3 (F(2,53) = 3.6, p < 0.05). However, paired comparisons showed no differences between the three types of products.
The frequencies with which participants mentioned products that they wanted to see/feel again can be regarded as a measure of interest. Again, we expected that LI and MI versions of products would be mentioned more often than NI versions, but we found no main effect of Type of stimulus (F(2,237) < 1.0, p > 0.20). Means for all three types were between 0.2 and 0.3 suggesting that in general, participants were not often interested in seeing and feeling the products again. Performing equivalent analyses per product showed a main effect of Type of stimulus for the ear cups both at T = 2 and T = 3 (F(2,57/53) > 3.6, p < 0.05). For this product set, the LI version was mentioned more often than the NI version at both T = 2 and T = 3. Furthermore, at T = 2 the MI version was also mentioned more often than the NI version. We also found a main effect of Type of stimulus for the newspaper stand product set at T = 2 (F(2,57) = 7.0, p < 0.01). Paired comparisons showed an unexpected difference: The NI version of this product was mentioned more often than the LI version. Therefore, we did not find a consistent increase in interest for the surprising products.
To show the general effect of time on the experience of surprise, Figure 2 presents mean Surprise ratings for the three different types of products at the three different time points. These ratings show that scores for surprise drop at the second evaluation of products and further decrease at the third evaluation. Although at T = 2 and at T = 3 Surprise ratings have dropped substantially, MI and LI products still have significantly higher ratings for Surprise than NI products. However, the difference in Surprise ratings between MI and LI products that was found at T = 1 was no longer present at T = 2 and T = 3.
These ratings only show between-subjects’ means. To test the within-person effect of Time on Surprise, we included the different responses participants gave at the three different time-points (which are nested within people) in multilevel analyses. As expected, we found a significant negative effect (t(56) = -15.33, p < 0.05) of Time on Surprise.
Emotions Following Surprise
To test our assumption that surprise is often followed by another emotion, we investigated the relationship between Surprise and the eight emotion scales at T = 1 using multilevel modeling. By using multilevel modeling, for each emotion we can test whether experiencing surprise affects the intensity of that emotion. To do so, a single participant’s surprise ratings are related to his or her emotion ratings over all products this participant was presented with. In multilevel modeling, the relationship thus obtained is called a slope. Subsequently, slopes were averaged over people to obtain a relationship between surprise and other emotions. The analyses showed significant positive relationships (3.79 < t(61) < 10.44, all p < 0.001) between Surprise and interest, fascination, amusement, confusion, indignation and irritation. Furthermore, we found a negative relationship between Surprise and satisfaction (t(61) = -2.33, p < 0.05). No significant relationship was found between Surprise and disappointment. Hence, these outcomes suggest that surprise increases the intensity of interest, fascination, amusement, confusion, indignation and irritation, whereas it decreases the degree of satisfaction.
The effect of degree of incongruity on the experience of emotions was investigated in a between-subjects analysis at T = 1. We included the eight emotion scales as dependent variables in eight separate ANOVAs, and we examined differences between NI, MI and LI versions of products in paired comparisons (Figure 3, T= 1). We found main effects (F(2,245) > 4.3, all p < 0.05) of Type of stimulus on all emotions. For interest, fascination, amusement and confusion, mean scores for NI versions of products were significantly lower (p < 0.05) than mean scores for MI versions, and mean scores for MI versions were significantly lower than mean scores for LI versions. For the emotions indignation and irritation, mean scores for NI were lower than for MI products, but scores for MI and LI versions of products were similar. For all these emotions, positive relationships with Surprise were found in the multilevel analysis.
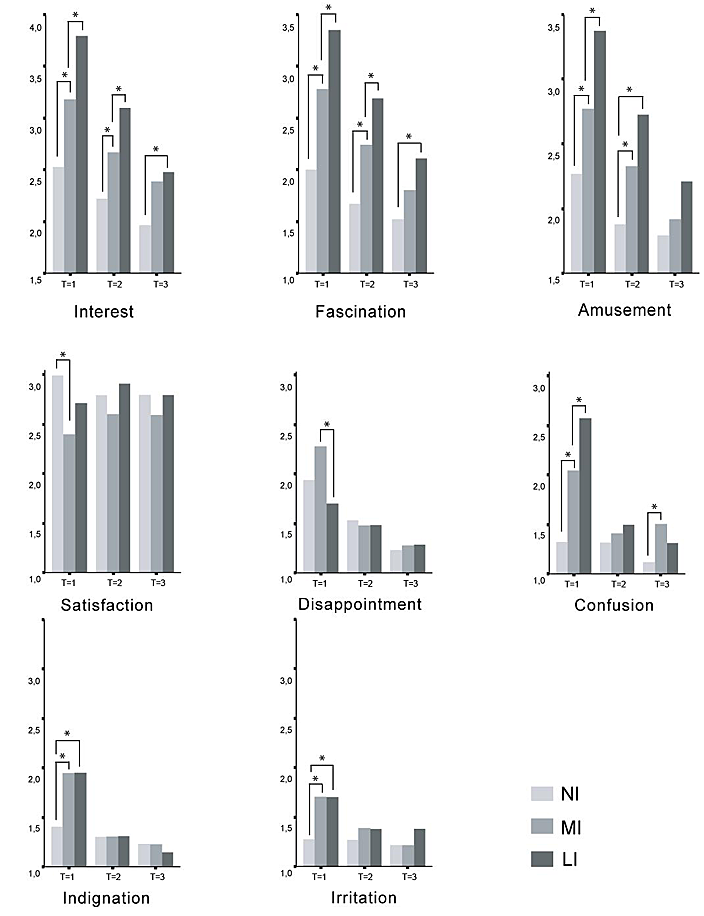
Figure 3. Experience of emotions at three different points in time for NI, MI and LI versions of products.
[Note: * Significant difference in paired comparisons (p < 0.05)].
For disappointment, the mean ratings for MI versions of products were higher than those for NI and LI versions at T = 1. Furthermore, for satisfaction, mean ratings for MI versions were lower than those for NI and LI versions. Although these differences did not always reach significance in the paired comparisons, they may reflect the pattern in means we found for Overall-liking.
To test the within-participant effect of Time on emotions, we included the different responses participants gave at the three different time-points (which were nested within people) in multilevel analyses. We found significant negative effects of Time on seven of the eight emotions (-4.8 < t(56) < -14.9; all p < 0.05). Only satisfaction had no significant effect from Time. Therefore, participants’ experience of all emotions except satisfaction decreased over time.
We also investigated differences between NI, MI and LI versions of products in between-subjects analyses (Figure 3, T = 2 and T = 3). These analyses show that at the second evaluation of products, we still find main effects of Type of stimulus on three emotions: interest, fascination and amusement. Differences between the different versions of products show the same pattern as during the first evaluation, i.e., mean scores for LI versions are highest, scores for MI versions are lower than for LI, and scores for NI versions are lowest. At the third evaluation, main effects of Type of stimulus are found for only two of these three emotions: interest and fascination. Differences between LI, MI and NI versions are smaller (and not always significant), but point in the same direction as at the first and second evaluation. We also found a main effect for confusion at T = 3; mean ratings for the MI versions were significantly higher than ratings for the NI versions.
Discussion
Effect of Degree of Incongruity on Product Evaluation
As expected, we found a negative effect of degree of incongruity on the aesthetic appreciation of unexpected tactual characteristics. Moderately incongruent (MI) and largely incongruent (LI) versions of products scored lower on Tactual-liking than products with no visual-tactual incongruity (NI). However, this effect did not increase with a larger degree of incongruity; mean scores for MI and LI products were similar. Possibly, the scores on Tactual-liking for the MI and LI versions of products were mainly determined by the fact that they contained unexpected characteristics and not so much by the degree of incongruity. The relationship between the variables Surprise and Tactual-liking (Pearson r = -0.39, p < 0.01), confirms that touching something different from expected may make the experience less pleasant. This finding is in line with a preference-for-typicality (familiarity) model.
Tactual-liking may also be affected by the tactual properties of the objects themselves. For instance, some of the products with visual-tactual incongruities (the LI soft box, and the MI and LI newspaper stands) may have scored relatively low on Tactual-liking because they felt rough or hard. Nevertheless, because the present study also included products with incongruities for which the tactual properties were probably quite pleasant (e.g., the soft texture of the MI and LI ear cups or the lightness of the MI and LI metal cups), these products may have compensated for any effects of the unpleasant properties.
Ratings on Overall-liking tended to be lower for MI versions of products than for NI and LI versions of products (Figure 2). Although the difference in ratings for MI and LI versions of products was only significant at T = 2, this seems to confirm our hypothesis that the negative effect of perceiving unexpected tactual characteristics may be overcome by a positive effect of experiencing positive emotions following the surprise reaction. Ratings on positive emotions were higher for LI versions of products than for MI versions of products. Therefore, the positive effect of experiencing positive emotions on the overall evaluation of products may have been larger for LI versions of products than for MI versions of products, leading to higher ratings on Overall-liking. Surprise was not correlated with any of the items in the Overall-liking scale (p > 0.10).
Emotions Following Surprise
The positive relationships we found between Surprise and six of the eight emotions we tested support our assumption that surprise can be seen as the first stage in a sequential process of appraisals that is followed by the experience of other emotions. Only between surprise and disappointment did we find no relationship.
Mean ratings on amusement (at T = 1) were particularly high for the metal cup LI (4.3) and the tile bench LI (3.8; all other means were below 3.5). In their comments on why they felt certain emotions, participants often mentioned the words “funny” or “amusing” for these products (4 and 5 times out of 20, respectively, compared to 0 or 1 time for other products). In both products, unexpected flexibility is the surprise-evoking aspect. Flexibility may be seen as a diminishing attribute in that it can make an object seem flimsy, of inferior quality. However, Wyer and Collins (1992) stated that perceiving a diminishing attribute that is not evaluated as conflicting with an individual’s goals can evoke amusement. Therefore, flexibility in products may be seen as amusing, as long as the flexibility does not diminish the functionality of the product. It would be unwise to conclude here that all products that are more flexible than expected evoke amusement; the complexity of the products used in our study does not permit such conclusions. However, it would be interesting to further study the relationship between surprises due to tactual properties and the specific emotions that can follow the surprise.
Comparing Figures 2 and 3, several emotions (interest, fascination, amusement) seem to follow a pattern of means that is quite similar to the one found for Surprise. At T = 1 the intensity of the emotions increases from NI to LI products, and this pattern seems to attenuate over time. This suggests that these emotions are mainly determined by the occurrence of unexpected events. The responses for indignation and irritation deviate from this pattern because these emotions show no difference between MI and LI products. This pattern bears more similarity to the pattern found for Tactual-liking. Possibly, the unpleasantness of unexpected tactual stimuli evokes irritation and indignation among participants.
For satisfaction, the pattern of mean responses is very different and resembles the pattern found for Overall-liking. In addition, the multilevel analysis for T = 1 showed a negative relationship between satisfaction and surprise. According to Vanhamme and Snelders (2001), surprise in combination with negative emotions may have a negative effect on satisfaction. However, our results give reason to believe that surprises evoked by visual-tactual incongruities generally evoke positive emotions. Although mean ratings for all emotions were relatively low (all < 4), mean ratings for negative emotions were somewhat lower than those for positive emotions. According to Oliver (1997), people experience a higher degree of satisfaction when a product performs according to their expectations or performs better than expected. Indeed, participants’ comments suggest that their ability to understand the products (“I am not satisfied, because I still do not know how this product was made”) or to perform a task in the experiment (“It gave me a feeling of satisfaction that I could move the bench, because I thought that I would not be able to do that”) had an effect on their judgements for satisfaction. It may also explain why we found no effect of time on satisfaction. At the second and third encounter with the products, participants often expressed that they were satisfied because they had remembered the products’ characteristics (“I remembered that this bench felt much lighter than it looked, and that it felt smooth. This made me feel satisfied”). Therefore, the responses for satisfaction seem to be mainly determined by how participants evaluated their task performance in relation to the products, and to a lesser extent by their momentary reactions to unexpected events.
Long-term Effect of Surprise
Contrary to what we expected, participants’ recollection of NI, MI and LI versions of products was about the same, and participants did not express a greater interest to experience the surprising products again. Although surprising products did not receive higher Overall-liking ratings, they received higher ratings on several positive emotions.
Our results show that a product can, to some extent, be surprising not only at the first, but also at the second and third encounters. In other words, the experience of surprise is not simply a one time only event, but one where the intensity of surprise decreases with the number of encounters. Participants sometimes expressed their disbelief about the surprise they felt when experiencing the products for the second time: “I thought I knew how this product felt now, but it felt different nevertheless.” This could imply that when people adjust their knowledge after the first encounter with a surprising product, the adjustment is not complete (e.g., Helson, 1964). Or, alternatively, after the first encounter the stored knowledge may have drifted away, so that the expectation on the second encounter again differs from the actual experience. The differences in ratings on interest, fascination and amusement between the different product variants at T = 2 and T = 3 may be related to this repeated experience of surprise.
Conclusion
Our results suggest that several emotions can accompany surprise reactions to industrial products. Although the effect of surprise diminishes over time, it persists and can be measured at multiple occasions. Possibly, the liking for surprising products may be the composite effect of a decreased liking due to unfamiliar characteristics and increased liking due to positive emotions following surprise. The effects that surprise can have on the long term make the experience of surprise and the resulting emotions particularly relevant to designers. Because surprising products offer new experiences to users and stimulate further exploration of the product, designers may benefit from designing surprising products. Hopefully, the findings of this study will stimulate other researchers to further pursue the question of how people’s emotional reactions to products develop over time.
Acknowledgements
This research was supported by MAGW VIDI grant 452-02-028 of the Netherlands Organization for Scientific Research (N.W.O.) awarded to H.N.J. Schifferstein. The authors would like to thank Paul Silvia for his thoughtful comments on the set-up of this experiment. The tile benches created for this experiment were inspired by Bisazza’s “Soft Mosaic Collection” designed by Jürgen Mayer; the ear cups were inspired by Kahla’s “Touch!” series.
References
- Berlyne, D. E. (1971). Aesthetics and psychobiology. New York, NY: Appleton-Century-Crofts.
- Bijleveld, C. C. J. H., & van der Kamp, L. J. T. (1998). Longitudinal data analysis. London, UK: Sage.
- Derbaix, C., & Vanhamme, J. (2003). Inducing word-of-mouth by eliciting surprise – A pilot investigation. Journal of Economic Psychology, 24(1), 99-116.
- Desmet, P. (2008). Product emotion. In H. N. J. Schifferstein & P. Hekkert (Eds.), Product experience (pp. 379-397). Amsterdam, The Netherlands: Elsevier.
- Hekkert, P. (1995). Artful judgements. Unpublished PhD dissertation, Delft University of Technology, Delft, the Netherlands.
- Hekkert, P., & Leder, H. (2008). Product aesthetics. In H. N. J. Schifferstein & P. Hekkert (Eds.), Product experience (pp. 259-285). Amsterdam, the Netherlands: Elsevier.
- Hekkert, P., & van Wieringen, P. C. W. (1990). Complexity and prototypicality as determinants of the appraisal of cubist paintings. British Journal of Psychology, 81(4), 483-495.
- Helson, H. (1964). Adaptation level theory. New York: Harper and Row.
- Hopkins, J. R., Zelazo, P. R., Jacobson, S. W., & Kagan, J. (1976). Infant reactivity to stimulus – schema discrepancy. Genetic Psychology Monographs, 93(1), 27-62.
- Kreft, I., & de Leeuw, J. (1998). Introducing multilevel modeling. London, UK: Sage.
- Lazarus, R. S., & Smith, C. A. (1988). Knowledge and appraisal in the cognition-emotion relationship. Cognition & Emotion, 2(4), 281-300.
- Ludden, G. D. S., Hekkert, P., & Schifferstein, H. N. J. (2006). Surprise & emotion. In P. Desmet, M. Karlsson, and J. van Erp (Eds), Proceedings of the 5th Conference on Design and Emotion Society. Gothenburg, Sweden: Chalmers University of Technology.
- Ludden, G. D. S., Schifferstein, H. N. J., & Hekkert, P. (2008). Surprise as a design strategy. Design Issues, 24(2), 28-38.
- Ludden, G. D. S., Schifferstein, H. N. J., & Hekkert, P. (2009). Visual-tactual incongruities in products as sources of surprise. Empirical Studies of the Arts, 27(1), 61-87.
- Meyer, W. U., Niepel, M., Rudolph, U., & Schutzwohl, A. (1991). An experimental-analysis of surprise. Cognition & Emotion, 5(4), 295-311.
- Meyer, W. U., Reisenzein, R., & Schutzwohl, A. (1997). Toward a process analysis of emotions: The case of surprise. Motivation and Emotion, 21(3), 251-274.
- Oliver, R. L. (1997). Satisfaction. New York, NY: McGraw-Hill.
- Painter, J. (2003). Designing multilevel models using SPSS 11.5 mixed model. Retrieved March 15, 2007, from http://www.unc.edu/~painter/SPSSMixed/SPSSMixedModels.PDF
- Richins, M. L. (1997). Measuring emotions in the consumption experience. Journal of Consumer Research, 24(2), 127-146.
- Roseman, I. J., & Evdokas, A. (2004). Appraisals cause experienced emotions: Experimental evidence. Cognition & Emotion, 18(1), 1-28.
- Scherer, K. R. (1987). Toward a dynamic theory of emotions: The component process model of affective states. Geneva Studies in Emotion and Communication, 1(1), 1-98.
- Silvia, P. J. (2005). What is interesting? Exploring the appraisal structure of interest. Emotion, 5(1), 89-102.
- Silvia, P. J. (2007). An introduction to multilevel modeling for research on the psychology of art and creativity. Empirical Studies of the Arts, 25(1), 1-20.
- Smith, C. A., & Ellsworth, P. C. (1985). Patterns of cognitive appraisal in emotions. Journal of Personality and Social Psychology, 48(4), 813-838.
- Stayman, D. M., Alden, D. L., & Smith, K. H. (1992). Some effects of schematic processing on consumer expectations and disconfirmation judgments. Journal of Consumer Research, 19(2), 240-255.
- Vanhamme, J., & Snelders, D. (2001). The role of surprise in satisfaction judgements. Journal of Consumer Satisfaction, Dissatisfaction and Complaining Behavior, 14, 27-44.
- Whitfield, T. W. A. (1983). Predicting preference for familiar everyday objects: An experimental confrontation between two theories of aesthetic behaviour. Journal of Environmental Psychology, 3(3), 221-237.
- Wyer, R. S., & Collins, J. E. (1992). A theory of humor elicitation. Psychological Review, 99(4), 663-688.
