
Should Mary Smell Like Biscuit?
Investigating Scents in Product Design
1Delft University of Technology, Delft, The Netherlands
2 Novay, Enschede, The Netherlands
In attempt to influence how a product is experienced, designers can manipulate all aspects of a product, including odor. The effect odor has on a consumer’s experience of the product is still not yet understood. Two experiments were conducted in order to shed more light on the influence odor has on consumers. In Experiment 1, differences in people’s reactions to congruent and incongruent odors for products that normally have an odor (e.g., lemons) and for products that normally do not have an odor (e.g., kitchen paper holder) were investigated. All scented products were found to be surprising, and were evaluated moderately positively. In Experiment 2, the effects of the degree of inappropriateness of odors on the evaluations of products that normally do not have an odor were investigated. Although ratings for degree of fit obtained in a pre-study showed that our manipulations were successful, no significant effects were found for the degree of inappropriateness on overall product evaluations in the main study. This may stem from the fact that because scent is a relatively unimportant attribute for the products used in our experiment, its contribution to the overall evaluation is difficult to measure on rating scales. However, participants’ comments suggest that odors do play a role in their evaluations. Therefore, this investigation sets forth that product designers should not ignore the potential effects of odors.
Keywords – Product Experience, Product Expression, Product Scent, Product Design, Odor Incongruity, Degree of Inappropriateness.
Relevance to Design Practice – Now that scented plastics are becoming more widely available, product designers can apply odors to products that normally do not have a discernable odor. However, knowledge of if, how and when odors actually contribute to a positive evaluation of products is inconclusive.
Citation: Ludden, G. D. S., & Schifferstein, H. N. J. (2009). Should Mary smell like biscuit? Investigating scents in product design. International Journal of Design, 3(3), 1-12.
Received June 30, 2008; Accepted September 11, 2009; Published December 28, 2009.
Copyright: © 2009 Ludden & Schifferstein. Copyright for this article is retained by the authors, with first publication rights granted to the International Journal of Design. All journal content, except where otherwise noted, is licensed under a Creative Commons Attribution-NonCommercial-NoDerivs 2.5 License. By virtue of their appearance in this open-access journal, articles are free to use, with proper attribution, in educational and other non-commercial settings.
*Corresponding Author: Geke.Ludden@Novay.nl.
Introduction
Designers can manipulate a product’s expression to influence how the product is experienced (van Rompay, Hekkert, Saakes, & Russo, 2005). To elicit the desired product experience, designers can manipulate the product information perceived through all the senses (Lindstrom, 2005; Schifferstein & Desmet, 2008). Along these lines, designers can also use odors to enhance a consumer’s experience of products. An example of such a product is Mary Biscuit. Mary Biscuit is a plastic storage box for biscuits designed by Stefano Giovannoni for Alessi (Figure 1). It was first produced in 1995 and has been a successful and well-known design product ever since its introduction (Fiell & Fiell, 2000). The lid of this storage box looks like a giant biscuit and has a vanilla scent. This scent, which complements the shape and functionality of the product, makes this biscuit box particularly original and appealing.
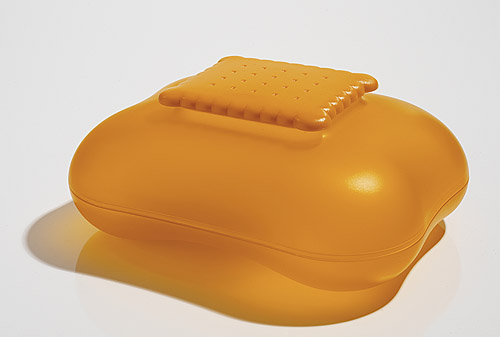
Figure 1. Mary Biscuit,biscuit box. Designed by Stefano Giovannoni, 1995; Producer: Alessi spa.
In addition to the Mary Biscuit, the use of scents to enhance products can be seen in many places. For example, to facilitate the implementation of odors in products, producers of plastics are now offering standard plastics with added odorants (van Kesteren & Ludden, 2006). This has led to the introduction of scented packaging (ScentSational Technologies, 2008) as well as to such products as MP3 players with a choice of seven different scents, including chocolate, roses and marijuana (Foster, 2006). Furthermore, odorants can be used to communicate the scent and taste of products prior to purchase. For instance, odorized (scratch-and-sniff) samples in magazines are commonly used to let consumers experience new fragrances. In 2003 the same technique was successfully used in the Netherlands to introduce a new flavor of jam (vanilla-strawberry) by the brand Hero (Janssen, 2004). Scratch-and-sniff samples of the scent of the new flavor were placed in magazines. In addition, the jar of the jam was also given a scratch-and-sniff sample so that consumers could experience the odor (and thus the flavor) of the jam in the store. Furthermore, odorants have been incorporated into the printing ink of stamps and telephone cards to enhance the experience of the themes of the cards; for example, an image of coffee on a stamp was combined with a coffee odor (Falck & Schaffelaars, 1999). These examples indicate that designers have more and more technical options at their disposal that enable them to apply an odor that matches the other characteristics of their design in order to enhance the experience they would like to evoke. It is still not completely understood, however, what effect the odors have.
Laird (1932) studied the effect of four different odors (original scent, narcissus, fruity and sachet type) on women’s evaluation of silk hosiery. He found that all scented hosiery scored better than the unscented hosiery. Because the natural scent of the hosiery was slightly unpleasant, the effect of odor could be attributed to odor pleasantness. In addition to odors in products themselves, ambient scent has also been reported to influence product evaluation. For example, a pair of Nike shoes appeared to be more highly rated in a room with a floral ambient scent than in a non-scented room (Miller, 1991). Spangenberg et al. (1996) studied the effect of the presence of an ambient scent (lavender, ginger, spearmint and orange) on consumers’ evaluations of a store and of the offered products (decor items, kitchen items, books, school supplies and outdoor athletic gear). They found that when a pleasant scent was present in the store, consumers’ evaluations of the store environment and of the merchandise in general were more positive. Furthermore, the quality of specific products was evaluated as higher when a scent was present in the environment. The character of the scent did not matter as much as the presence or absence of a scent.
Though odors have been shown to enhance a consumer’s experience with a product, they may also have an undesired effect. If designers do not carefully design the odor of a product, this may lead to a perceived mismatch between the visual and olfactory expression of a product. As a result, the total product experience may not be the one the designer tries to achieve. In addition, a scent that is not congruent with a product’s appearance may evoke a surprise reaction. Other researchers have argued that the congruency of the odor plays an important role in the evaluation of products. However, research on the congruency of odors has lead to mixed results. Ellen and Bone (1998) investigated the effects of scratch-and-sniff samples in magazines and found that a scent that was incongruent with an advertisement actually lowered consumer attitudes, whereas a congruent scent did not improve consumer attitude. Knasko (1995) studied the effects of congruent and incongruent odors on the viewing time of slides and a respondent’s mood and health, but found no effect of odor congruency. Bone and Jantrania (1992) let respondents use household cleanser with no odor, a congruent odor (lemon) or an incongruent odor (coconut) and found that products were evaluated more positively when presented with a congruent odor. However, another study on congruent and incongruent odors for food, household and personal care products (Schifferstein & Michaut, 2002) found no effects of odor congruency on overall product evaluation.
Knowledge, then, of if, how and when odors actually contribute to a positive evaluation of products is inconclusive. To assist product designers in their choices, this paper attempts to gather knowledge about how and when adding odors can lead to a more positive evaluation of a product. In particular we focus on understanding the effects of adding odorants to products that normally do not carry an odor.
Two Experiments on the Effects of Incongruent Odors on Product Experience
As discussed, research on the effect of odor on product evaluation has in some cases led to contradictory findings. Differences in the stimuli and procedures used in the different studies may account for some of the differences, and these differences make it difficult to extrapolate results to different situations and to other product categories. In particular, the effect of adding odorants to products that normally do no have an odor has not been studied extensively.
The present study is comprised of two experiments. For both experiments, a variety of everyday products was selected and presented to participants with or without added scents. For Experiment 1, the aim was to investigate whether or not people are surprised when they perceive a scent that they do not expect, and how this in turn affects their evaluation of products. In this experiment, a distinction was made between products that normally have a scent and products that normally do not carry a discernable scent. In Experiment 2, we used only products that normally do not carry a scent. This experiment was set up to discover how the degree of inappropriateness of a scent (the degree to which the scent does not fit the product) affects the degree to which participants liked a product.
Experiment 1
Previous studies have mainly investigated scent effects for products that normally always carry a scent. In contrast, in Experiment 1 the differential effects of incongruent scents on product experience are investigated for products with scents (WS) and for products that normally do not have a discernable scent (no scent, NS).
Previous research related to this experiment was conducted by the present researchers on products for which the tactual experiences deviated from what could be expected on the basis of the visual appearances of the products (Ludden, Schifferstein, & Hekkert, 2009). For example, participants were presented with a lamp that appeared as if it were made out of hard plastic (a familiar material for lamp shades), but upon touching the lamp the participant discovered that the shade was flexible and made out of silicone rubber. It was found that the participants’ familiarity with the product and their certainty of the expectations about the product’s tactual characteristics affected the degree of surprise evoked by the product. Analogously, differences in the certainty of participants’ expectations about the products’ olfactory characteristics are expected to occur in the certainty of participants’ expectations about the products’ olfactory characteristics between WS and NS products in the present study. People likely have a more certain expectation about odors for WS products than they have for NS products. Therefore, it is assumed that participants will be more surprised about the incongruent odors in the WS group, because their initial expectations about the odors are more certain (but disconfirmed). This can ultimately have an effect on overall product evaluation. The hypothesis for Experiment 1 is that incongruent odors for WS products will be appreciated less than incongruent odors for NS products.
Method
Participants
Forty participants (19 female and 21 male, aged 19-27, mean 23) participated in this experiment. All participants were students of Industrial Design Engineering of Delft University of Technology.
Stimuli
Because this experiment is rather exploratory and focused on different groups of products, there were many products and smells to choose from. Both products and odors were for the most part chosen for their availability. Also, smaller products were chosen that could be placed on a table and that everybody could easily recognize.
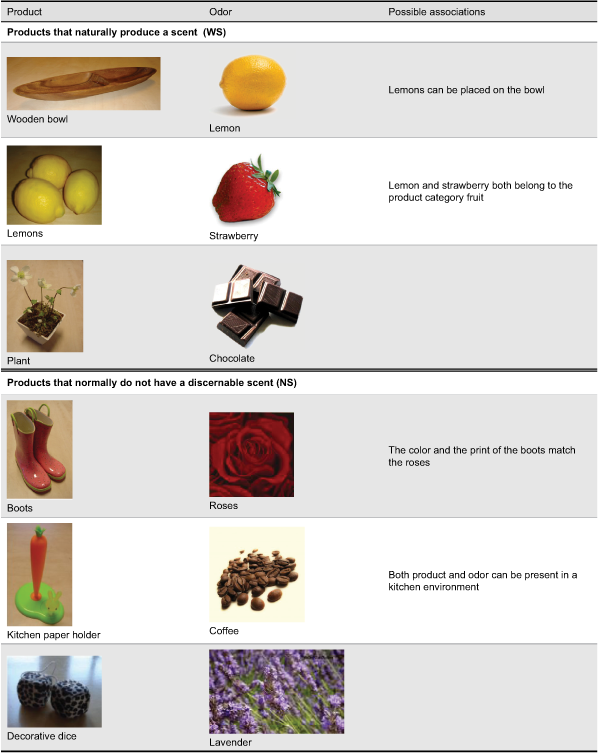
We selected six products in two categories as stimuli. The first category (WS) comprised products that naturally produce a scent: a wooden bowl, lemons and a plant with flowers. For the second category (NS) products were selected that do not naturally produce a discernable scent: plastic boots, a kitchen paper holder and decorative dice for a car interior. An incongruent scent was added to all products. The method and materials with which the scents were added differed according to the carrier of the scent. The materials used included a fluid (sprayed on the product); a powder (rubbed onto the product and placed inside the product); and 7×6 mm polyethylene fragrance pellets (placed inside the product). Scents were renewed every half day, so that every scent was always clearly discernable. Table 1 shows the products chosen as stimuli and the scents they were presented with. Although all odors were assumed to be incongruent, Table 1 also indicates possible associations between odor and product that respondents may have formed nevertheless.
Table 1. Product-odor combinations used in Experiment 1.
Procedure
Two groups of three products were created. Group A was comprised of two products in the WS category (lemons and wooden bowl) and one product in the NS category (boots). Group B was comprised of two products in the NS category (kitchen paper holder and decorative dice) and one product in the WS category (plant with flowers). The two groups of products were placed in separate rooms. The products were placed on tables, and plastic domes were placed over the products (Figure 2). By doing so, when participants entered the room they could see the products (visual information) but could not smell them (olfactory information) as the dome sealed in the odors. Rooms were ventilated thoroughly between trials.
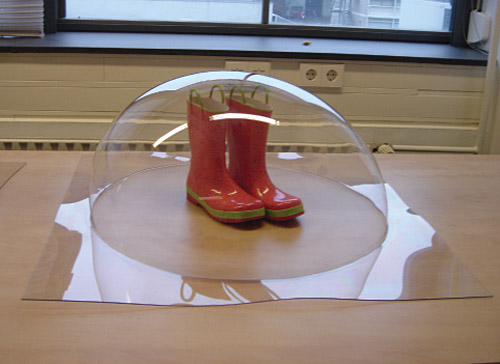
Figure 2. Stimulus presentation: products were placed under plastic domes.
Participants evaluated the two groups of products in two different conditions, a see-condition and a see-and-smell-condition. How these conditions were configured is discussed below. The see-condition was designed to investigate if people were familiar with the products presented, to find out what expectations people had about the smell of the products used, and if these expectations differed between products in the NS and WS categories. The see-and-smell-condition was designed to investigate whether or not people recognized the odors that were added and if their expectations about the smells differed from their actual perception. Furthermore, the see-and-smell-condition investigated if people were surprised about the incongruent smells and how they evaluated the products with incongruent smells. The difference between products in the WS and the NS categories was the main focus.
Half of the participants evaluated group A in the see-condition and group B in the see-and-smell-condition; the other half evaluated group B in the see-condition and group A in the see-and-smell-condition. The order in which the products were evaluated was randomized between participants. Participants always evaluated three products in the see-condition first and three products in the see-and-smell-condition second. Unless indicated otherwise, all responses were recorded on 7-point scales, with following scale end points: do not agree at all — agree completely. The questionnaire was partly based on our previous study investigating visual – tactual incongruity (Ludden et al., 2009).
In the see-condition, participants were instructed to look at the product only, and were not allowed to remove the plastic domes. The plastic domes allowed almost full viewing of the product. Therefore, using these plastic coverings instead of, for example, photographs of the products ensured that participants could obtain the same visual information in the two conditions. After looking at the first product ad libitum, participants filled out a questionnaire while still able to view the product. Three questions gauged Familiarity with the product: This (product) looks familiar; I have seen this (product) before; I know things that resemble this (product). Two questions inquired about participants’ Expectations of the product’s scent. The first, If I would smell this (product), I expect the product to smell ___, was answered on five scales with the following end points: pleasant – unpleasant; sweet – sour; fresh – stale; heavy – light; and synthetical – natural. For the second, I expect this (product) to smell like ___, participants chose their answer(s) from a list of 16 options that were included for their relevance in relation to the products we used as stimuli (wood, cloth, plastic, leather, grass, roses, plants, pepper, carrot, lemon, strawberry, banana, mint, lavender, chocolate, and coffee). Participants were also given the option to provide an alternative answer. Finally, three questions inquired about the Certainty of the expectation of the product’s scent: I am certain about how this (product) smells; I am curious about how this (product) smells. The third question about certainty was directly related to the question about the expected character of the product scent: I am certain that my answer to the question about the expected product’s scent is correct. After they filled out the questionnaire for the first product, participants were instructed to evaluate the rest of the products using the same method, until all of the three products of one group were evaluated.
The participants’ next step was to evaluate the three other products in the see-and-smell-condition. In this condition, participants were instructed to look at the product and then lift the plastic covering using both hands (see Figure 3) to smell the product. Participants were not allowed to touch the product. Subsequently, participants filled out a questionnaire with the product still in view. Three questions on the questionnaire gauged the Degree of Surprise: This (product) smells exactly as I expected when I saw it; I am surprised about how the (product) smells; I am amazed about how the (product) smells. Additionally, participants evaluated how they felt about their surprise (Evaluation of Surprise) on four scales with the following end points: not funny at all – very funny; not annoying at all – very annoying; not disappointing at al – very disappointing; and not pleasant at all – very pleasant. Two questions assessed the Certainty of participants’ expectations about the product’s scent: When I saw the (product), I was certain about how it would smell; When I saw the (product), I was curious about how it would smell. Two questions asked about the participant’s perception of the product’s scent. For the first question, participants were instructed to choose the scent of the product from a list of 16 options (the same as used in the see-condition): This (product) smells like ___. For the second question, participants evaluated how the scent of the product deviated from their expectation on five scales with the following end points: much less pleasant – much more pleasant; much less sweet – much sweeter; much less fresh – much fresher; much less heavy – much heavier; and much less synthetical – much more synthetical. Finally, participants expressed their opinion about the product in a few words. After completing their responses for the first product, they evaluated the other two products in the same way.

Figure 3. Participant in the see-and-smell-condition smelling a product.
Results
Manipulation Check
For each product we compared expected odor identification responses in the see-condition to perceived odor identification responses in the see-and-smell-condition. For all products, the frequencies of the responses selected differed substantially between the two conditions. In the see-condition, participants most often picked the odor of the product’s material as the expected odor (17 ≤ n ≤ 20 for all products, where the number of responses n = 20 would be the maximum). In the see-and-smell-condition, most participants recognized the added odorants (11 ≤ n ≤ 19), but for 4 products (boots, lemons, plant with flowers and kitchen paper holder) the odor of the material was incorrectly picked quite often (5 ≤ n ≤ 11). Furthermore, some participants identified the rose odorant on the boots as strawberry or lavender, and some identified the lavender odorant on the decorative dice as strawberry or roses.
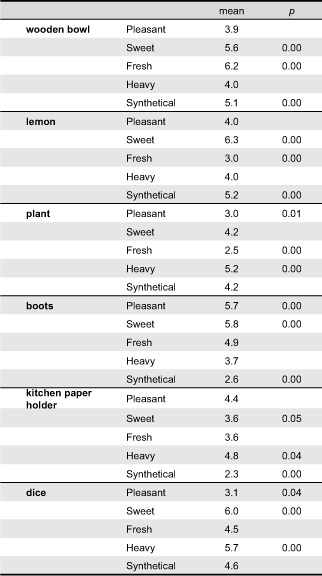
As a second manipulation check, two-tailed t-tests were carried out on the five scales in the see-and-smell-condition that measured deviations from expectation. We checked if mean responses deviated significantly from the center of the scale (= 4). Table 2 shows that for each product we found significant differences (p < 0.05) for at least three out of five scales. The analysis of these questions, then, shows that the experiment succeeded in introducing incongruent odors for our products.
Table 2. Deviation from smell expectation for the six products in Experiment 1.
Differences between WS and NS Products
Cronbach’s α values for the scales measuring Familiarity (α = 0.71) and Surprise (α = 0.91) indicated that these scales were consistent (see Nunnally, 1978). However, the consistency of the scales measuring Certainty was lower than expected: α = 0.57 for the see-condition and α = 0.18 for the see-and-smell-condition. Therefore, the item When I saw the (product), I was curious about how it would smell was removed from the Certainty scale in the see-condition (Cronbach’s α for the resulting scale was 0.65) and was analyzed separately as Curiosity. Furthermore, the two Certainty items in the see-and-smell-condition were analyzed separately and referred to as Certainty and Curiosity.
To investigate differences in mean responses on these questions between the different types of products, they were analyzed as dependent variables in analyses of variance (ANOVAs). Because each participant evaluated only a subset of products in each condition, within-participants ANOVAs could not be used to analyze the complete dataset. Therefore, the data analysis disregarded the fact that each participant had evaluated six products and analyzed instead the data as if each person had evaluated one product only. As such, responses were subjected to between-participants analyses of variance (ANOVA) with Type of product (WS or NS) as explanatory variable and Product (bowl, lemons, plant, boots, paper holder or dices) nested within the Type variable. Since we used different types of questions for the two experimental conditions, responses in the see-condition and in the see-and-smell-condition were analyzed separately.
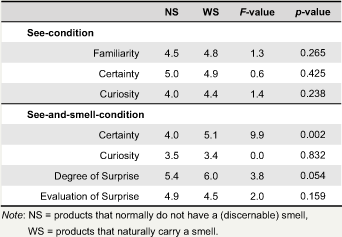
For the see-condition, we found no significant effects. For the see-and-smell-condition we found a main effect of Type of product on Certainty. In addition, the effect for Degree of surprise approached significance. Possibly, because participants were more certain about how WS products would smell, this led to larger surprises.
An ANOVA was performed on the scale (α = 0.84) produced from the four questions that measured the Evaluation of Surprise, which showed no main effect of Type of product (Table 3). Mean scores on Evaluation of Surprise are between 4.0 and 5.6 for all products, indicating that people generally evaluated the addition of surprising odors as moderately positive.
Table 3. Mean scores and F-values for the Type of product effect in Experiment 1 (7 point scale).
To gain more insight into participants’ evaluations of the surprising odors, we analyzed participants’ additional comments on the products. The incongruent odors for the boots and the kitchen paper holder were liked, because their odor could be related back to the product. There were five positive responses for both products, which included comments such as “I like the odor; the odor of coffee fits the kitchen” and “The roses on the boots match their odor.” In contrast, participants mentioned that they could not relate the odor of the decorative dice to the product and, therefore, they did not like this odor for this product. There were six negative comments in total with comments such as “The lavender scent doesn’t match the product at all; they should smell stale instead of fresh.” Furthermore, ten participants evaluated the incongruent scents for products in the WS group as unnatural and offered comments such as “I would rather smell lemons that smell like lemons. That feels more natural” and “I would prefer a wood scent for a wooden bowl; this is unnatural.”
Discussion
This study focused on the differences between adding incongruent odors to products that normally carry versus products that normally do not carry a particular smell. As the added smells were mostly correctly identified, they were probably all perceived as incongruent. Overall, the mean scores for Surprise were above 5.4 on a 7-point scale indicating that, as expected, the products were generally found surprising.
In the study, we found some differences between the two types of products. Participants’ ratings for how certain they were about the product’s scent after seeing and smelling the product were higher for WS products. This suggests that the participants made different inferences before and after smelling the scents of the products. Before smelling the product during the experiment, the knowledge about the product’s natural smell did not increase certainty scores. However, after smelling the WS products, their high degree of surprise ratings coincided with high ratings for degree of certainty. The larger degree of surprise experienced after smelling the WS products was attributed to a higher degree of certainty about how the product was expected to smell; by smelling the products, participants were probably triggered to think about how the product would naturally smell. Possibly, after smelling the products and experiencing surprise, participants attributed the intensity of their surprise to the certainty of their smell expectations.
Finally, an effect of Type of product on Evaluation of Surprise was not found. However, participants’ spontaneous remarks about the products suggest that using incongruent odors for products that normally do not have a discernable odor can lead to a more positive evaluation of the product as a whole, especially if the odor matches the theme or usage context of the product. On the other hand, using incongruent odors for products that normally have a familiar odor mainly elicited negative remarks.
Experiment 2
Product designers mostly design products without explicitly designing their odors. Information on when and how to apply odors in products is scarce. Participants’ opinions in Experiment 1 suggest that odors are more positively evaluated if the odor can be related to the product. The odors that participants could somehow relate to the product (odor of roses for boots adorned with roses, and odor of coffee for kitchen paper holder) most often received positive comments. On the other hand, odors that could not in any way be related to the product (e.g., lavender for decorative dice) were more often negatively evaluated. In other words, it seems that the more inappropriate an odor is, the smaller the positive effect on product evaluation will be. Experiment 2 was set up to provide support for this relationship between degree of appropriateness of scents and product evaluation.
Odors are perceived to be more or less appropriate, depending on the associations that the perceiver of the odor can form between the odor and the product. Associations can be made through different product attributes, such as the material of the product (which is typically responsible for a product’s odor), but also through its shape, color or product theme, use and use environment. Note that the term ‘inappropriate’ is used here rather than the term ‘incongruent’ in order to reserve the label ‘congruent’ for odors that are naturally connected to a specific material, such as a wood smell for the wooden bowl or a lemon smell for lemons. Therefore, all odorants used in Experiment 1 were incongruent. However, the types of associations and their strength determine the extent to which an incongruent odor can be related to the product and thus its degree of appropriateness (see Ludden, Kudrowitz, Schifferstein, & Hekkert, in press).
To gain more insight into how people evaluate the degree of appropriateness of an odor and how this affects product evaluation, products were presented either without an added odorant or with one of two odorants that differed in their association to the product and thus in their expected degree of appropriateness. To minimize any extra effects of odor pleasantness on product evaluation, odorants were selected that were as equally pleasant as possible. In a pre-study, the pleasantness of the odorants and the perceived degree of appropriateness of the product-odor combinations was determined. The main study tested the effects of the degree of appropriateness on overall product appreciation.
Scented products form a rather new product category, and the addition of odor may add to the complexity of the product. Therefore, the newness and complexity of the product-odor combinations was also measured. According to Michaut (2004), perceived newness and complexity have a positive or negative effect on product liking. Incongruity and surprise are important elements of her newness construct, whereas uncertainty and confusion are elements of her complexity construct.
Pre-study
It was tested whether the two selected scents for each product were perceived as being approximately similar in pleasantness. In addition, it was tested whether the two scents were perceived to vary in their degree of appropriateness with the product. Furthermore, to gain more insight into why scents were perceived as more or less appropriate, participants were asked to identify the scents and to explain why they thought a scent either fitted or did not fit a product.
Method
Twenty participants (eight female and 12 male, aged 19-27, mean 21) participated in the pre-study. Participants were students of the Faculty of Industrial Design Engineering of Delft University of Technology.
Stimuli
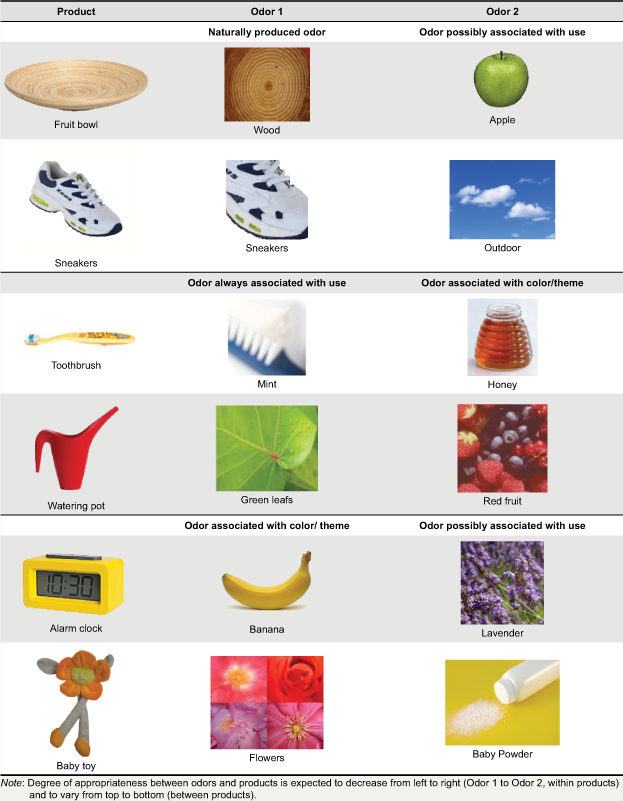
Six products were selected, each from a different product category: a fruit bowl, a pair of sneakers, a toothbrush, a watering pot, an alarm clock and a baby toy. These products were selected because they were easily available, quite small and therefore easy to handle, familiar to most people, and did not have a discernable odor. Three groups of two products were made, and odorants with different types of associations for each group were selected (Table 4). The fruit bowl and the sneakers were presented with odorants that were naturally associated with the material of the product (very strong association, congruent odors) or with odorants that could in some cases be connected to the use of the product (weak association). The toothbrush and the watering pot were presented with odorants that were directly and consistently associated with the use of the product (strong association), or with odorants that could be associated with the color or theme of the product (weak association). Finally, the alarm clock and the baby toy were presented with odorants that could be associated with the color or theme of the product (weak association) or with odorants that could be associated with the use environment of the product (weak association). We expected the odorants with strong associations to the products to be more appropriate than those with weak associations. In this way, we varied the degree of perceived appropriateness of the odorants with the products both within and between products. We used two similar products that were each sprayed with a different odorant and stored in separate plastic containers to prevent the odorants from spreading during the experiment. Odorants were regularly reapplied to ensure that they could be perceived in all trials.
Table 4. Odor-product combinations used in Experiment 2.
Procedure
Participants were presented with each of the 12 product-scent combinations in random order. They were instructed to look at the product and to smell it without touching it. Subsequently, they responded to a statement about the pleasantness of the scent (This product smells pleasant) on a 9-point scale with the end points of do not agree at all – agree completely. They also responded to a question about the degree of fit of the scent (How well do you think the scent fits the product?) on a 9-point scale with the end points of does not fit at all – fits excellently. Participants were also asked to identify the odor by choosing from a list of 20 options (chocolate, grass, lemon, candy, apple, baby powder, wood, bamboo, red fruit, rubber, sneakers, outdoor, flowers, plants, leather, banana, mint, lavender, honey, and mud). They were also given the option to provide an alternative answer. Finally, participants were asked to express why they thought the odor fitted or did not fit with the product.
Results and Discussion
For each product, separate repeated measures ANOVAs (see e.g., Stevens, 2002) were carried out on the ratings for Pleasantness and Degree of fit with Odor as within-participants explanatory variable. Table 5 shows the mean ratings for the products with the two odorants. A successful manipulation would mean that odors were perceived as equally pleasant, and that the degree of fit varied between odors.
Table 5. Mean ratings and F-values per product for Pleasantness and Degree of fit (9 – point scale).
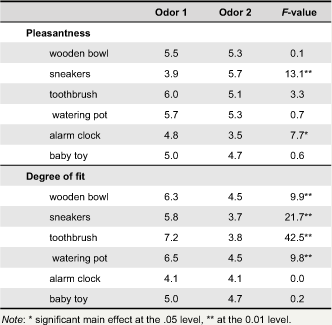
Main effects of Odor on Pleasantness were found for the sneakers and for the alarm clock. For the sneakers, the outdoor scent was perceived as significantly more pleasant than the sneaker scent. For the alarm clock, the banana scent was perceived as significantly more pleasant than the lavender scent. In addition, both the sneaker and the lavender scents had means that were below the scale midpoint (=5), suggesting they were both rather unpleasant.
For Degree of fit, significant effects of Odor were found for four of the six products (Table 5). As expected, odorants that are produced naturally or that are associated consistently with a product rated high on degree of fit. Furthermore, it did not seem to make a difference whether there was a possible association with use or with the product’s theme or color. As a consequence, for the baby toy and the alarm clock, creating product-odor combinations that varied in appropriateness did not succeed.
Responses to the questions concerning odor identification and the comments on why odors were perceived to either fit or not fit the product can partly explain why some product-odor combinations yielded better outcomes than others. The outdoor odorant for the sneaker was often (n = 8) identified as a flower odor. It is not so surprising that a flower odor was evaluated as more pleasant than a sneaker odor, which was often (n = 13) correctly identified. As concerns the alarm clock, participants did recognize the association between the banana odor and the color of the alarm clock, but they indicated that they would not want to have a banana smell in their bedroom environment. Therefore, the banana scent was evaluated as not fitting the alarm clock.
Main Study
The results of the pre-study show that with several products (toothbrush, watering pot and fruit bowl) sets of product-odor combinations for which the odorants were perceived as equally pleasant but varied in perceived degree of fit were successfully created. The odorants for the sneakers were not perceived as equally pleasant although they did vary in perceived degree of fit. Therefore, results for the sneakers have to be interpreted with caution. Because the odorants presented with the alarm clock and the baby toy did not differ on degree of fit, the combinations for these products are not suitable to test effects of degree of fit. Nevertheless, they were included in the main study to compare evaluations for products with an odor to products without an odor.
Because the products used in this experiment normally do not have a discernable odor, it was expected that products presented with an odorant would rate higher on newness than products presented without an odorant. Following Michaut’s (2004) predictions, a higher rating on newness would have a positive effect on product liking. It was expected that odorants that are more appropriate for the product lead to decreased perceived complexity, which would positively influence the overall product liking. Therefore, products presented with an odorant that is more appropriate with the product should rate higher on overall product liking than products presented with either a more inappropriate odorant or without an odorant.
Method
Sixty participants (23 female and 37 male, aged 18-26, mean 21) participated in the main study. All participants were students of Industrial Design Engineering of Delft University of Technology.
Stimuli
The same six product categories were used in the main study as in the pre-study (see Table 4). An unscented control product was added to each set of products.
Procedure
Each participant evaluated one variant from each set of product-odor combinations, making six products in total. Participants always evaluated two products without an odorant, and four products with an odorant. The order in which the products were evaluated was randomized and differed between participants.
During the experiment, the experiment leader placed one product on a table in front of the participant. Participants were instructed not to touch the products, but rather to look at them from a small distance. This was done to ensure that participants would smell the odorant without directly focusing their attention on it (Schifferstein & Michaut, 2002). Participants followed their appraisal with filling out a questionnaire.
The first question on the questionnaire addressed the overall product liking (Do you like this product?) on a nine-point scale with the end points of: I don’t like this product at all – I like this product very much. Next, participants responded to the question I think this product is___ on 11 nine-point semantic scales having the following end points: conspicuous – inconspicuous; good quality – bad quality; feminine – masculine; interesting – boring; unpleasant – pleasant; stimulating – relaxing; funny – serious; cheap – expensive; agreeable – disagreeable; tough – cute; quiet – vivid. These items were selected based on their relevance for product quality and product expression.
Additionally, participants answered the questions about newness and complexity adapted from Michaut (2004). They were asked to rate on six nine-point scales where the products landed between end points. To gauge newness, the following end points were used: This product is something I have seen/heard before – This product is different; This is a typical product – This is not a typical product; and I am not surprised by this product – I am surprised by this product. To rate complexity, the end points used were the following: This product is easy to figure out – This product is puzzling; This product is easy to describe – This product is difficult to describe; and I know what this product can do for me – I am unsure what this product can do for me. Furthermore, participants were asked to indicate if the product evoked memories or associations with people, things or events, with the options ‘not at all’, ‘reminds me of one other person/thing/event’, and ‘reminds me of two or more other persons/things/events’. In the case of a confirmative response, participants were asked to describe the memory or association that first came to mind. Finally, they were asked to describe their opinion of the product in a few words.
Results
Principal Components Analysis with Varimax rotation was carried out on the responses on the 11 semantic scales to construct evaluative factors. This was done to look for shared variance among the 11 scales, and to attempt to summarize the majority of the information in a small number of independent underlying factors. This led to three factors for which the internal consistency proved to be sufficient. One factor reflected the Quality of the product (five items, with positive end points good quality, interesting, pleasant, expensive, and agreeable, α = 0.80). The other two factors reflected the product expressions Vividness (four items with positive end points conspicuous, stimulating, funny, vivid, α = 0.75) and Masculinity (two items, with positive end points masculine and tough, α = 0.74). Internal consistency was also sufficient for the scales measuring Newness (α = 0.71) and Complexity (α = 0.71).
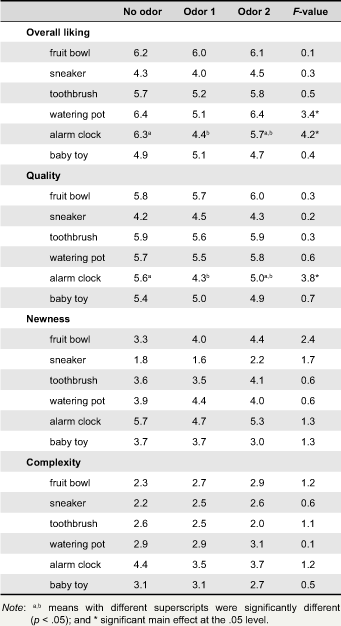
For each product, separate ANOVAs were carried out with Quality, Masculinity, Vividness, Overall liking, Newness and Complexity as dependent variables, and Odor (three levels) as between-participants explanatory variable (Table 6). In these analyses, a main effect of Odor on Overall liking was found for the alarm clock and for the watering pot. Pair-wise comparisons with Bonferroni adjustment of confidence levels showed no significant differences between the three means for the watering pot. For the alarm clock, the product with no odorant rated significantly higher on overall liking than the alarm clock with the banana scent. A main effect of Odor on the Quality scale was also found for the alarm clock. Again, Quality was rated higher for the unscented clock than for the banana-scented clock. This effect can probably be attributed to the appropriateness of the odor with the use environment of the product since respondents in the pre-study indicated that the smell of banana did not fit a bedroom environment. No other significant effects were found.
To investigate the relationship between the degree of appropriateness (evaluated as Degree of fit in the pre-study) and Complexity and Overall liking (evaluated in the main study) of the product-odor combinations, we calculated the correlation coefficient between the means for these variables. Contrary to our expectations, a lower perceived degree of fit of an odorant did not lead to a higher perceived complexity of the product (Pearson r = 0.22, p = 0.50). Furthermore, a higher perceived degree of fit of an odorant did not lead to higher ratings on overall liking (r = 0.05, p = 0.87).
Table 6. Mean scores and F-values per product (9–point scales).
Finally, participants’ comments on their associations with and opinions about the products were analyzed. It was found that fewer but similar remarks about the products’ odors as in Experiment 1 were made. Again, some remarks (n = 5) concerned whether the scent matched the product in theme or color. Also, remarks were made about scents that were perceived as too strong (n = 8). What was interesting is that upon perceiving an odor, participants appeared to be concerned that the product was not new anymore, but had been used before (n = 4). For example, a participant remarked that someone must have made lemonade in the watering pot that smelled of red fruit.
General Discussion
Two experiments that investigated the effect of scents on product evaluation were conducted. Although the results from Experiment 1 tentatively suggested that incongruent odors in products might be evaluated positively, especially for products that normally do not carry a scent of their own, in most cases in Experiment 2 odors did not influence participants’ liking of the product. In addition, participants did not perceive products presented with odorants as newer than products without odorants, and a decreasing degree of appropriateness did not increase the perceived complexity of the product.
The present data add to a number of studies that were unable to predict the exact impact of odor quality characteristics on product perception and liking (e.g., Knasko, 1995; Schifferstein & Michaut, 2002). For instance, Schifferstein and Michaut (2002) did not find any effects of odor congruency on the liking of products from multiple product categories. Although it might be argued that scent may have been a relatively unimportant attribute for the products used in the present study (Schifferstein, 2006), this was certainly not the case for the study of Schifferstein and Michaut (2002), where food products were included. In addition, in a review of olfaction research relevant to retail environments, Bone and Ellen (1999) concluded that research on the effects of congruity of odors found only weak effects of congruity on product evaluation. Schifferstein and Michaut (2002) suggested that specifically asking about the products’ scents might have decreased the odors’ impact on product evaluations. Therefore, scents were not explicitly asked about in the main study of Experiment 2. Nevertheless, the expected effect on product liking was not found.
In Experiment 1, participants were asked explicitly to evaluate the scents of the products. As a consequence, the number of participants that mentioned the products’ odor in their comments about the product was much larger in Experiment 1 (20 out of 40) than in the main study of Experiment 2 (3 out of 60). This suggests that participants attributed more importance to scent when they were asked about it. However, this may not reflect the actual impact of scent on the overall product experience under real-life conditions. What is interesting here from a scientific perspective is why the predicted effects of odors are so hard to obtain in empirical studies, and what exactly is missing in the theoretical framework that causes these unexpected findings. Possibly, the dependent measures should be less explicit and should be restricted to observations of behavior or to indirect questioning (Köster, 2003). Or perhaps the actual impact of scents in products can only be studied in a more realistic setting where people can actually explore and use the products for some time. In this light, one must be careful in generalizing the results presented in this study as well.
Scent in Product Design
The present outcomes might suggest that scent hardly contributes to product liking. Analogously, in a study on the effect of congruent and incongruent sounds on product expression (Ludden & Schifferstein, 2007), it was found that although different sounds were perceived as having different expressions, in most cases the expression of the sounds did not have a direct effect on the overall product expression. Furthermore, in a study in which the pleasantness of the appearance, feel, sound and smell of several product variants was manipulated (Schifferstein, Otten, Thoolen, & Hekkert, in press) a significant effect on overall pleasantness was only found for product color. Therefore, it seems that both for product scent and product sound it is hard to predict effects on the overall expression and liking of products.
Although the expected effects were not found in this study, designers should nevertheless not ignore the potential effects of odors. Research has shown evidence of cross-modal integration of olfaction and vision. For example, Gottfried and Dolan (2003) showed that the detection of odors was better when an odor was presented together with a congruent picture than when an odor was presented with an incongruent picture. Furthermore, scents even seem to be able to steer people’s movements. Castiello et al. (2006) presented objects with either a scent belonging to a larger or to a smaller object. The scents were found to interfere with people’s grasping movements. In using products, conflicts between visual and olfactory information could have a negative effect on the usability of products. The present results indicate that using an inappropriate scent may cause consumers to believe that the product has been used before. Perhaps, they will be worried that the product is not clean. It has to be asked, then, if people will be prepared to eat cookies that come from a ‘smelly’ storage box. Possibly, the scent of the Mary Biscuit enhances the experience of eating cookies only because the vanilla smell is highly congruent with most cookies that are stored in the box.
Even though the effects of odor appropriateness or inappropriateness were not demonstrated in the present study, it would be unwise and premature to conclude that the scent of products is unimportant. Therefore, the advice to designers should probably be to design smells that can be related to the product. When applied in the right way, odors in products will probably be evaluated positively and can contribute to the overall product experience. However, predicting the effects the odors will eventually have on the product’s expression and evaluation is difficult. This makes an iterative process of applying and testing odors during the design process essential.
Acknowledgements
This research was supported by MAGW VIDI grant number 452-02-028 of the Netherlands Organization for Scientific Research (N.W.O.) awarded to H. N. J. Schifferstein. We thank Xiaoqing Lin, Eva Biemans, Kirsten Rijke and Judith Trippelvitz for their assistance in carrying out the experiments. Furthermore, we thank Stan Knoops and Marieke Otten of International Flavors and Fragrances for their advice in setting up Experiment 2 and for providing the odorants for this experiment.
References
- Bone, P. F., & Jantrania, S. (1992). Olfaction as a cue for product quality. Marketing Letters, 3(3), 289-296.
- Bone, P. F., & Ellen, P. S. (1999). Scents in the marketplace: Explaining a fraction of olfaction. Journal of Retailing, 75(2), 243-262.
- Castiello, U., Zucco, G. M., Parma, V., Ansuini, C., & Tirindelli, R. (2006). Cross-modal interactions between olfaction and vision when grasping. Chemical Senses, 31(7), 665-671.
- Ellen, P. S., & Bone, P. F. (1998). Does it matter if it smells? Olfactory stimuli as advertising executional cues. Journal of Advertising, 27(4), 29-39.
- Falck, M., & Schaffelaars, D. (1999). Geur & ontwerp [Smell & design]. Eindhoven, the Netherlands: [ZOO] Producties.
- Fiell, C., & Fiell, P. (2000). Design of the 20th century. Koln: Benedikt Taschen Verlag.
- Fiore, A. M., Yah, X., & Yoh, E. (2000). Effects of a product display and environmental fragrancing on approach responses and pleasurable experiences. Psychology & Marketing, 17(1), 27-54.
- Foster, S. C. (2006). iCool smelly mp3-player. Retrieved March 15, 2008, from http://www.shinyshiny.tv/2006/02/icool_smelly_mp.html
- Gottfried, J. A., & Dolan, R. J. (2003). The nose smells what the eye sees: Crossmodal facilitation of human olfactory perception. Neuron, 39(2), 375-386.
- Janssen, B. (2004). Marketing online: Top of flop: Fred&Ed, zoet broodbeleg uit een tube. Retrieved March 26, 2008, from http://www.marketingonline.nl/topofflop/case01.2004.html
- Knasko, S. C. (1995). Pleasant odors and congruency: Effects on approach behavior. Chemical Senses, 20(5), 479-487.
- Köster, E. P. (2003). The psychology of food choice: Some often encountered fallacies. Food Quality and Preference, 14(5/6), 359-373.
- Laird, D. A. (1932). How the consumer estimates quality by subconscious sensory impressions. Journal of Applied Psychology, 16(3), 241-246.
- Lindstrom, M. (2005). Brand sense: Build powerful brands through touch, taste, smell, sight, and sound. New York: Free Press.
- Ludden, G. D. S., & Schifferstein, H. N. J. (2007). Effects of visual-auditory incongruity on product expression and surprise. International Journal of Design, 1(3), 29-39.
- Ludden, G. D. S., Schifferstein, H. N. J., & Hekkert, P. (2009). Visual - tactual incongruities in products as sources of surprise. Empirical Studies of the Arts, 27(1), 61-87.
- Ludden, G. D. S., Kudrowitz, B. M., Schifferstein, H. N. J., & Hekkert, P. (in press). Surprise & humor in product design. Designing sensory metaphors in multiple modalities. Humor.
- Michaut, A. M. K. (2004). Consumer acceptance of new products with application to foods. Unpublished doctoral dissertation, Wageningen University, Wageningen, the Netherlands.
- Miller, C. (1991). Research reveals how marketers can win by a nose. Marketing News, 25(3), 1-2.
- Nunnally, J. C. (1978). Psychometric theory (2nd ed.). New York: McGraw-Hill.
- ScentSational Technologies. (2008). Brand-enhancing flavored packaging. Increasing sales by enhancing the consumer’s experience. Retrieved March 13, 2008, from http://scentsationaltechnologies.com/
- Stevens, J. P. (2002). Applied multivariate statistics for the social sciences. Mahwah, NJ: Lawrence Erlbaum Associates.
- Schifferstein, H. N. J. (2006). The relative importance of sensory modalities in product usage: A study of self-reports. Acta Psychologica, 121(1), 41-64.
- Schifferstein, H. N. J., & Desmet, P. M. A. (2008). Tools facilitating multisensory product design. The Design Journal, 11(2), 137-158.
- Schifferstein, H. N. J., & Michaut, A. M. K. (2002). Effects of appropriate and inappropriate odors on product evaluations. Perceptual and Motor Skills, 95(2), 1199-1214.
- Schifferstein, H. N. J., Otten, J. J., Thoolen, F., & Hekkert, P. (in press). An experimental approach to assess sensory dominance in a product development context. Journal of Design Research.
- Spangenberg, E. R., Crowley, A. E., & Henderson, P. W. (1996). Improving the store environment: Do olfactory cues affect evaluations and behaviors? Journal of Marketing, 60(2), 67-80.
- van Kesteren, I. E. H., & Ludden, G. D. S. (2006). Beleving vertaald in kunststoffen: de glitters van deze tijd [Experience translated into plastics: today’s sparkles]. Kunststof Magazine, 17(2), 16-18.
