
Identifying a Motivational Profile for Older Adults Towards Increased Physical Activity
Carlijn A. Valk 1,*, Peter Lovei 2, Hubert Cornelis 3, Yaliang Chuang 1, Thomas Visser 2, Pearl Pu 4, and Yuan Lu 1
1 Eindhoven University of Technology, Eindhoven, The Netherlands
2 Philips Design, Eindhoven, The Netherlands
3 Stichting Ontmoet & Groet, Eindhoven, The Netherlands
4 École Polytechnique Fédérale de Lausanne, Lausanne, Switzerland
Personalizing behavior change (BC) strategies to motivate increased physical activity is especially important for the diverse older adult population. However, there is a lack of knowledge about how to profile older users to most effectively personalize BC solutions. Self-awareness and social awareness are BC strategies commonly used in commercially available applications to promote physical activities. Through a randomized controlled trial (N = 53), we studied the effect of some personal factors on the physical activity of older adults under these two strategies. For this purpose, each BC strategy was implemented in a mobile application. Based on the statistical analysis of the measured step data and the collected questionnaire data, we identified a list of personal factors to personalize each BC strategy towards improved physical activity. Hereby we suggest how to create effective motivational profiles and provide design recommendations to personalize these BC strategies toward increased physical activity for older users.
Keywords – Behavior Change, Motivation, Persuasive Technology, Physical Activity, Older Adults, User Profile.
Relevance to Design Practice – Designers of behavior change (BC) solutions can use the motivational profiles suggested here to inform which BC strategy to apply to personalize their products. This method of profiling can serve as an example for further research into linking motivational profiles with BC strategies to increase the effectiveness of these products.
Citation: Valk, C., Lovei, P., Cornelis, H., Chuang, Y., Visser, T., Pu, P., & Lu, Y. (2021). Creating a motivational profile for older adults towards increased physical activity. International Journal of Design, 15(1), 17-32.
Received May 19, 2020; Accepted March 27, 2021; Published April 30, 2021.
Copyright: © 2021 Valk, Lovei, Cornelis, Chuang, Visser, Pu, & Lu. Copyright for this article is retained by the authors, with first publication rights granted to the International Journal of Design. All journal content is open-accessed and allowed to be shared and adapted in accordance with the Creative Commons Attribution-NonCommercial 4.0 International (CC BY-NC 4.0) License.
*Corresponding Author: c.a.l.valk@tue.nl
Carlijn Valk is a postdoctoral design researcher at TU Eindhoven. Her work focusses on motivating behavior change toward healthier living by personalizing persuasive technologies. In her research she uses various co-design and participatory design methods to engage the end user in the development of new technologies. Her PhD investigated how to stimulate increased physical activity among older adults by overcoming barriers to design and research process participation.
Peter Lovei is Data Designer at Philips Experience Design and PhD candidate at the Industrial Design department of TU Eindhoven. His main research interest lies in the intersection of computer science and design research. He is applying and improving the data-enabled design process by developing scalable and modular components that can be applied across a wide range of care pathways. He is achieving this via his research through design projects around the topics of sleep, pregnancy, elderly care, and improvement of clinical care for cardiovascular patients and patients who underwent a bariatric surgery. He is one of the lecturers for the Data Enabled Design course.
Hubert Cornelis is Director of the Meet & Greet foundation. His work focuses on supporting the elderly in living independently at home, where attention is paid to the competences of the elderly and the personal needs and attention. From M&G he works on coming together, being together, staying together by working together, and doing together (with stakeholders and elderly residents in the community) to live together. His focus is on value creation in aging through reciprocity. He is committed to creating social impact from M&G. Hubert is convinced of the added value in collaboration with universities and the field lab function of Meet & Greet.
Yaliang Chuang is an Assistant Professor in the Future Everyday cluster of the Department of Industrial Design at TU Eindhoven. His research focuses on Human-Computer Interactions, especially the design of systems of smart things. Yaliang masters the design thinking process in exploring novelty applications with emerging technologies. He also utilizes design languages to create proper sociotechnical solutions that can leverage technologies and social interactions to improve people’s quality of life. In 2006, Yaliang co-founded the International Journal of Design. Since then, he continues to serve as the Managing Editor. Yaliang has also been invited as the associate chair of the design committee of the ACM SIGCHI conference since 2018.
Thomas Visser is Senior Experience Lead at Philips Experience Design. He has a background in design research and design for behavior change and he has conducted his PhD research on using interactive and connected products to increase social well-being in seniors. Currently, Thomas is a design lead for several design innovation projects in Philips’ Connected Care businesses. He works closely with R&D, marketing and business teams, as well as with academic institutes to increasingly better understand the ever-changing space and experience of healthcare technology.
Pearl Pu currently leads the HCI Group in the School of Computer and Communication Sciences at the Swiss Federal Institute of Technology in Lausanne (EPFL). Her early interests focused on novel interaction models for product search and recommendation in online environments. Lately, she became more interested in applying HCI methods to healthcare technology and developing neural models for response generation. She is a member of the steering committee of the ACM International Conference on Recommender Systems, a distinguished speaker for ACM, and served on the editorial boards of several highly recognized scientific journals. She is a recipient of fourteen Research Awards from the Swiss National Science Foundation, three Technology Innovation Awards from the Swiss Government, and a Research Career Award from US National Science Foundation. She also co-founded three startup companies, for which she received the 2008 Rising Star Award from Sina.com and the 2014 Worldwide Innovation Challenge Award from the French president.
Yuan Lu is Associate Professor of designing for healthy and active ageing at TU Eindhoven. She has a background in mathematics and industrial and systems engineering. In her work, she explores how to use technological probes and the collected data to stimulate healthy lifestyle behaviors of vulnerable people, especially older adults, through a socio-ecological perspective with multi-stakeholder network collaboration.
Introduction
Most of us accept that regular physical activity is beneficial to our health. However, it is too often overlooked how vitally important physical activity is, not only for the health but also for the wellbeing and independence of older adults. Physical activity has been shown to improve muscle skeletal strength, reduce the risk of chronic diseases, and even support mental health (Bauman et al., 2016; U.S. Department of Health and Human Services, 1996). Currently, physical activity and strength training are the most effective fall prevention treatments. One study found that regular physical activity even reduced the participant’s symptoms of frailty (Bangsbo et al., 2019; Bauman et al., 2016; Chodzko-Zajko et al., 2009; Lopez et al., 2018). Physical activity has also been linked to independence which is essential to many older adults’ experience of quality of life, as physical activity supports increased mobility (Chodzko-Zajko et al., 2009). In contrast, a sedentary lifestyle exacerbates symptoms of chronic disease and is linked to decreased mobility and even loneliness (Chodzko-Zajko et al., 2009). Despite this existing knowledge, people generally reduce their physical activity and adopt a sedentary lifestyle as they age (Davis et al., 2011; De Rezende et al., 2014).
Behavior change (BC) solutions can have a positive effect on this unfortunate trend by stimulating older adults to adopt a more physically active lifestyle. BC solutions apply BC strategies to motivate people to adopt new behaviors and break bad habits. However, motivating people to adopt new behavior is challenging and complicated, not in the least because people react differently to applied BC strategies. It has been shown that personalizing BC strategies applied to BC solutions can improve the effectiveness of these solution in stimulating the adoption of new target behaviors (Brug et al., 1999; Kaptein et al., 2015; Purpura et al., 2011). The older adult community is a very diverse population, due to the wide range of physical capabilities, co-morbidities, and the lifetime of diverse experiences (Gregor et al., 2002). Thus, older adults are especially in need of personalized solutions which address their wide variety of needs, wants, and challenges (LeRouge et al., 2011).
Commercially available BC solutions, such as mobile applications which aim to stimulate increased physical activity, commonly use some form of self-awareness or social awareness strategy (Lyons et al., 2014; Middelweerd et al., 2014). Self-awareness strategies aim to inspire BC by providing the user with insight into the extent of their own adherence to the target behavior; while social awareness strategies aim to achieve the same, except by providing insight into the adherence to the target behavior of a group, of one or more peers. Though such personal activity monitoring interventions hold potential for older adults (Lyons et al., 2017; McMahon et al., 2016; Middelweerd et al., 2014; Valk et al., 2017), there are a variety of challenges among older adults which bar an important subgroup of this population from enjoying the benefits of many commercially available BC solutions (Preusse et al., 2017; Seifert et al., 2017), so that there is little known about whether even the most commonly used BC strategies are effective for older users.
It is clear that there is a need to investigate how to effectively personalize BC solutions for older adults for the benefit of their health and wellbeing. Experts agree that to this end, profiling is a valuable method to personalize BC strategies (Friederichs et al., 2015; Hardcastle & Hagger, 2016; Kaptein et al., 2015; LeRouge et al., 2011; Looman et al., 2018), yet there is no consensus on what user factors should characterize or determine the user’s BC profile. Additionally, once users have been profiled, it is not always clear how these profiles can inform design decisions such as which BC strategy is most appropriate for a specific profile of older users. There is a need to further investigate which factors might be indicative of a user’s reaction to an applied BC strategy beyond only factors such as age and gender.
To address this gap, we conducted a randomized controlled trial investigating the effect of two commonly used BC strategies (self-awareness and social awareness), on the physical activity of a group of 53 older adult participants, between a baseline and intervention measurement over the course of nine weeks. To test these two BC strategies, they were each implemented into otherwise very similar mobile applications, pictured in Figure 1. In addition, we analyzed the effect of several personal factors, captured by questionnaires, on the increase in physical activity.
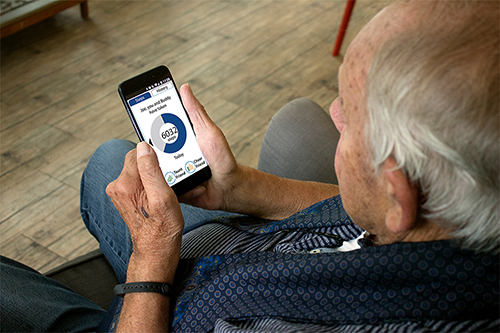
Figure 1. User demonstrates use of intervention application.
A series of regression analyses were run to identify which personal factors predicted an increase in physical activity for each intervention. From these analyses, we clustered the personal factors which were found to be significant into motivational profiles, linked to the relevant BC strategy. Furthermore, we provide design recommendations based on our findings and propose an approach for how to create motivational profiles for further investigations into how to motivate increased physical activity among older adults.
In this way we want to contribute to the body of knowledge on personalizing BC strategies. We believe a better understanding of how to personalize BC strategies for older adults is of vital importance for improving BC solutions, which motivate older adults to increase their physical activity and hereby improve their quality of life.
Related Works
Though the positive effects of physical activity have been shown to improve the health, wellbeing, and independence of older adults, an important subset of this population could still benefit from increasing their physical activity and avoiding a sedentary lifestyle (Bangsbo et al., 2019; Bauman et al., 2016; Chodzko-Zajko et al., 2009; Lopez et al., 2018; Nagai et al., 2018).
In order to support increased engagement with physical activity, BC solutions need to be personalized to appropriately address the needs of the highly diverse older adult population. Personalization has been shown to increase the effectiveness of BC solutions (Bull et al., 1999; Cabrita et al., 2015; Campbell et al., 1994; Purpura et al., 2011; Schutzer & Graves, 2004). Additionally, strong evidence indicates that when designing for older adult users the need for personalization is even more important (Cabrita et al., 2015; LeRouge et al., 2011). However, highly personalized solutions tailored to one individual are costly to create and practically impossible to implement on a larger scale. Current automized personalization methods, such as purchase recommendary systems used in online marketing or in-app goal setting due to previous activity levels, lack the necessary contextual and psychological depth beyond measured activity data or other measured physiological data (Kaptein et al., 2015). Experienced authors advocate that user profiles have the potential to increase the effectivity of the BC solution by allowing for a more personal approach than the inadvisable one size fits all, while streamlining the creation of these BC interventions by avoiding bespoke interventions (Friederichs et al., 2015; Hardcastle & Hagger, 2016; Kaptein et al., 2015; LeRouge et al., 2011; Looman et al., 2018).
To this effect, researchers have conducted studies to discover which personal factors should be considered when creating such a profile. Though certain constructs such as age, gender, and ethnicity are very often used to construct user profiles, authors see the value in using a combination of contextual and psychological factors to profile users for interventions that support physical activity. Much research into the psychology of BC has already been done. Notably, Prochaska and Velicer (1997) describe BC as a dynamic process consisting of several consecutive stages describing an individual’s attitude toward or readiness for BC, from precontemplation (no intention to change), to maintenance (actively keeping up the change). Other authors have concentrated on the role of self-efficacy, which describes an individual’s estimation of their own ability to successfully perform a behavior or achieve a set goal (Sherer & Maddux, 1982). Psychological factors such as stage of change (Prochaska & Velicer, 1997), social efficacy and self-efficacy (Sherer & Maddux, 1982) in combination with other personal factors could inform design choices towards the creation of BC solutions (Brug et al., 1999; Lee et al., 2008; Looman et al., 2018; McAuley et al., 2006). However, little is known about which specific combination of personal factors could be used to profile older adults to inform which BC strategy should be applied.
While some form of self-monitoring or self-awareness might be the most prevalent BC strategy when considering commercially available physical activity monitors, social interventions are also often used to motivate increased physical activity. Several mobile applications allow users to share their recorded physical activity to their social network, for example. In addition, authors have explored how social connectedness even when mediated through digital and technological devices can enhance the wellbeing of older adults (Visser et al., 2011). There are of course many BC strategies and technics (Michie et al., 2015), but besides being commonly used to support increased physical activity (Lyons et al., 2014; Middelweerd et al., 2014), both the self-awareness (McMahon et al., 2016) and social awareness (Kononova et al., 2019) type BC strategies were found to have potential for older adult users (Valk et al., 2017). Still, it is difficult to know which BC strategy is most appropriate to use to address older adults when designing BC solutions.
In this study we attempt to examine the effect of the above-mentioned personal factors on the increase in physical activity of older adults using a design probe employing either the self- or social awareness BC strategy.
Method
As mentioned in the introduction, we were interested to learn which personal profiling factors (e.g., as age, gender, overall physical activity, self-efficacy, social efficacy, etc.) effect physical activity (in terms of relative increase in physical activity as measured by a wearable activity tracker) and whether there are any personal factors that could indicate a significant improvement in physical activities depending on the intervention BC strategy applied. Thus, the purpose of the study was to find out whether age, gender, smartphone usage, stage of change, social efficacy, and self-efficacy have a statistically significant effect on the relative improvement on daily physical activities under the social awareness and self-awareness strategy, respectively.
In this section we report on the study design, the participants, the intervention hardware and software, the data we collected, and the data protection practices we used.
Study Design
This study consisted of a two-group randomized controlled trial, with a four-week baseline and a five-week intervention measurement phase, see Figure 2. During the baseline phase of the study, each participant was asked to wear a step counter without a display and to keep a research-issued phone charged at their home for data collection purposes. During the intervention phase of the study, participants were asked to use the research-issued smartphone to view their daily steps through interacting with the intervention application they were allocated. Three workshops were organized with no more than twenty participants at a time: 1) Onboarding and introduction workshop to explain the procedure and expectations, 2) Workshop teaching participants how to use the intervention application they had been allocated, and 3) De-briefing workshop to provide participants with preliminary insights from the study and thank them for their participation. Participants were also asked to fill in a list of questionnaires to collect more information on personal factors, potentially relevant to motivational profiling. For the details, see the data collection section.
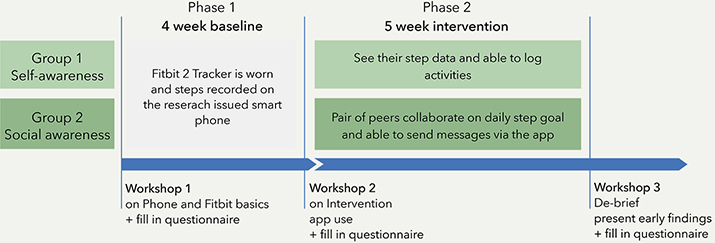
Figure 2. Basic outline of the randomized controlled trial including baseline and intervention phases and workshops.
Participants
All participants of the study were recruited in close collaboration with a trusted third party, in this case the founder and volunteers from the local senior community center. Handouts describing the study and inviting members to the onboarding session were distributed among the members of the senior community center several weeks before the first onboarding workshop, giving potential participants ample time to consider if they would like to join the study. Community dwelling older adult members of the local senior community center were the main target group of this recruitment though some volunteers of the center also decided to join the study. Older adult members of the senior community center all have a Tilburg Frailty index of larger than five (Gobbens et al., 2010), describing them as independent yet reliant on some support or care for activities of daily living, such as help with strenuous household tasks or relying on a walking aid.
Software Intervention
For this investigation, it was necessary to redesign the original HealthyTogether application (Chen & Pu, 2014), into the REACH HealthyTogether application through a co-creation process with a panel of five older adults, representative of the larger group of study participants. Two very similar versions of the resulting REACH HealthyTogether application were created each implementing a BC strategy. The first version integrated the self-awareness BC strategy and the second integrated the social awareness BC strategy into the application, see Figure 3 and Figure 4 respectively. The main difference is that in the self-awareness application (Figure 3), the circle on the today screen visualizes one user’s progress toward a personal daily step goal while in the social awareness application (Figure 4), the circle represents the total progress of the user and their buddy towards a combined daily step goal. Each combined daily step goal is the sum of the individual step goals of the user and their buddy, but no distinction is made in the progress visualization about which buddy has contributed most that day. This choice was made to emphasize collaboration instead of competition, as in this highly divers population we wanted to avoid people getting discouraged by always contributing less than their buddy. The buddies were assigned randomly from the same workshop group so that participants had a chance to meet their buddy at least a few times during the workshops. In the history overview, both applications allow users to scroll through daily step totals achieved in previous days. In this view, those using the social awareness version can gain insight into their personal number of steps compared to that of their buddy.
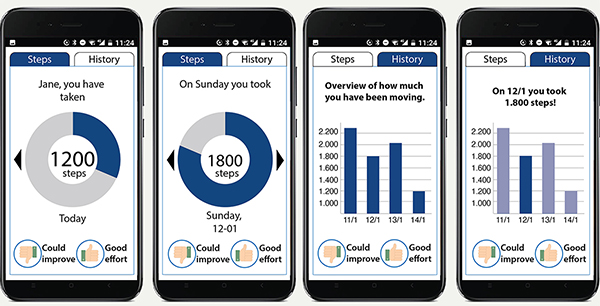
Figure 3. Intervention application for the self-awareness condition.
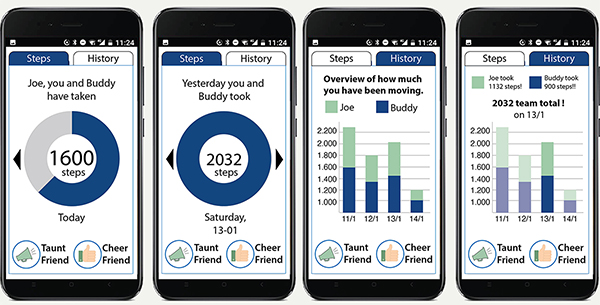
Figure 4. Intervention application for the social awareness condition.
Hardware Intervention
The hardware used to support this study consisted of the Fitbit Flex2 and the Mi A1 smartphone. Both pieces of hardware were considered due to practical reasons, e.g., cost, availability, and approval by the aforementioned panel of participants. The Mi A1 phone was chosen for its screen size and regular security updates of the operating system. The Fitbit Flex2 was chosen because of the practicality of it being waterproof, featuring exercise detection such as walking, cycling, swimming, aerobic workout etc. without having a screen to show the number of steps which was important in order to run the baseline phase of the study.
Data Collection
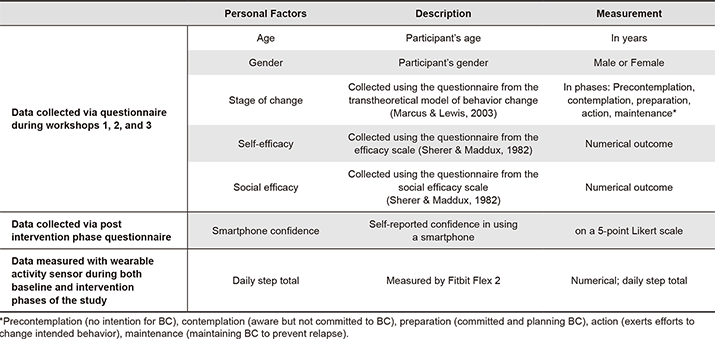
By means of a questionnaire we collected information on participants’ age, gender, self-reported confidence in using a smartphone (smartphone confidence), stage of change (Prochaska & Velicer, 1997), and social and self-efficacy (Sherer & Maddux, 1982), see Table 1. Overview of data collection. By means of the wearable activity sensor, the Fitbit Flex 2, we collected step data during both the baseline and intervention phases of the study.
Table 1. Overview of data collection.
Data Security and Ethics
To protect the privacy of our participants, the necessary personal information, such as contact information, was encrypted and stored offline. In addition, this sensitive information was only shared with those researchers who required it to run the study, for example to provide tech support. For much of the general communication toward the participants, researchers relied on the support of the partnering senior community center, which already possessed contact information for all their members, and in doing so avoided, in many cases, the necessity to record this personal data. This data collection and storage was described in layman’s terms during the first workshop before participants were invited to sign the informed consent as part of onboarding. A flyer describing the data collection and storage and a flyer describing the study and how to contact the research team was also handed out for participants to take home.
Responsible parties of this senior community center and knowledgeable people at the Eindhoven University of Technology approved our protocol, data collection, and storage practices.
The data collected from this study was anonymized and made available to the REACH Horizon 2020 consortium in order to comply with the consortium agreement and European requirements. This consortium will further communicate the already deidentified data to others following general data protection regulations (European Commission, 2018). To share this anonymized data with research partners end-to-end encryption was used.
Results
The participants were recruited by the partnering senior community center based on their willingness to participate in the study. Less than two weeks of measured step data in either the baseline or the intervention phase of the study excluded that case from any calculations concerning physical activity.
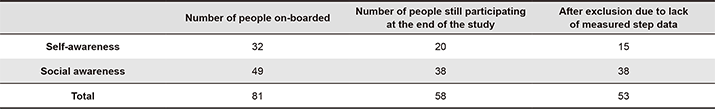
Eighty-one older adult potential participants signed up to come to the onboarding workshop and were assigned to use either a social awareness or a self-awareness intervention application prior to the onboarding workshop. At the conclusion of the study, out of the 49 participants who used the social awareness intervention 11 people dropped out of the study (22.45%) and out of the 32 participants who used the self-awareness intervention 12 participants dropped out before the end of the study (37.50%). After the exclusion criterium was enforced, 53 participants remained (Table 2).
Table 2. Participation after dropout and after exclusion criteria were enforced.
Personal Profile Results from the Questionnaire
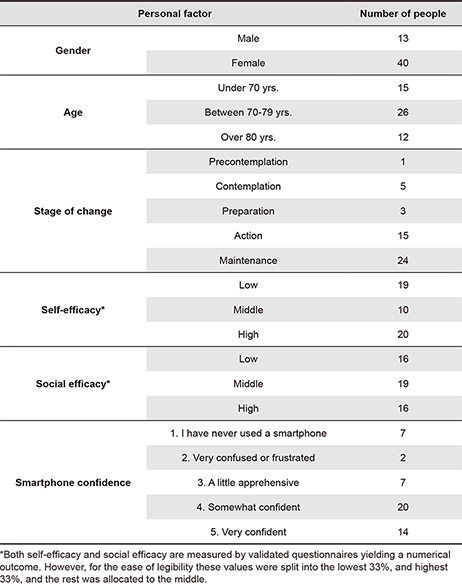
Out of the 53 remaining participants 40 were female and 13 were male. Participants had a mean age of 72.38, a median age of 73, and mode of 76. Of the remaining 53 participants 49 participants completed the self-efficacy questionnaire with scores ranging from 17 to 40, with a mean score of 32.47. Fifty participants completed the social efficacy questionnaire with overall scores ranging from 9 to 22 with a mean score of 17.06. Out of the 48 participants who completed the stage of change questionnaire we found most participants to be either in the action (15) or the maintenance (24) stage of change. More specific information about the study population, in terms of the examined personal factors, is reported in Table 3.
Table 3. Participant details.
Measured Physical Activity Results
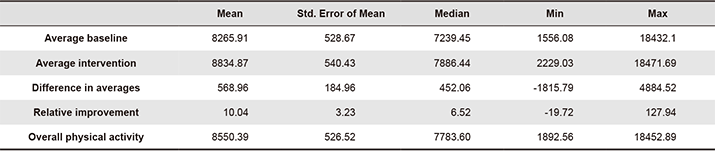
In addition, the daily step data collected showed diversity within this population. The lowest average number of steps measured on a day during the baseline was 1556.08, while the highest average was 18432.10. The mean difference in number of steps between the baseline and the intervention was 568.96, but due to the large differences in average number of steps it is relevant to consider not just the absolute difference but also the relative improvement. More details on this can be found in Table 4.
Table 4. Details on physical activity in number of steps a day.
Analysis
The research question we aimed to address with this investigation concerns the relationship between personal profiling factors and effectivity of applied BC strategies, in terms of relative improvement in daily step count between the baseline and intervention phases of the study. In our analysis of the above reported results we first addressed the entire data set and then we examined each intervention condition on its own.
Analysis of the Complete Data Set
The central purpose of this analysis was to investigate which personal factors, and to what extend each of these, had an effect on the relative improvement in steps taken per day. To this end, we ran a multiple regression to predict relative improvement in steps between the baseline and the intervention phases of the study from gender, age, self-efficacy, social efficacy, stage of change, intervention application used during intervention phase of the study, overall physical activity level throughout the entire study, and self-reported smartphone confidence.
Our regression required some initial data processing. As an ordinal variable cannot be used in a multiple regression, we created dummy variables to change the ordinal variables (overall physical activity, smartphone confidence, and stage of change) into dichotomous variables.
An assessment of partial regression plots and the studentized residuals against the predicted values plot showed there was linearity. We found independence of residuals, as assessed by a Durbin-Watson statistic of 2.132, and homoscedasticity, as assessed by visual inspection of a plot of studentized residuals versus unstandardized predicted values. The studentized deleted residual all fell between -1.653 and 2.437 except an outlier with the value of 6.567, and almost all of the leverage values were above the problematic value of 0.2. However, the Cook’s distance values were never above 1, so we continued with this regression.
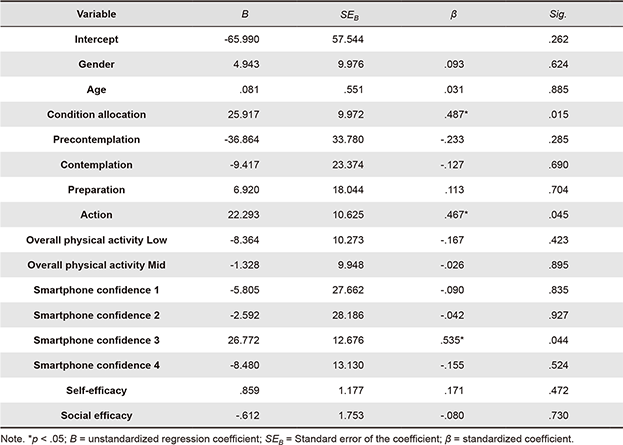
The multiple regression analysis showed that R2 for the overall model was 41.1% with an adjusted R2 of 8.4%. Age, gender, intervention application allocation, self-efficacy, social efficacy, overall level of physical activity, stage of change, and self-reported smartphone confidence were not statistically significant to predict relative improvement, with F(15, 27) = 1.257, p = .293. From the SPSS calculated Coefficients, reported in Table 5, we see that only app allocation, stage of change: action, and self-reported phone confidence: a little confused, are statistically significant to relative difference between steps taken during the baseline and the intervention periods of the study.
Table 5. Summary of the multiple regression analysis, coefficients Table.
Analysis of the Two Intervention Conditions
To determine that there was no accidental bias in the allocation of the self-awareness and social awareness intervention groups, we examined the average number of steps taken in each group during the baseline phase of the study, before any intervention was introduced. We used a Mann-Whitney U test to investigate the average number of steps taken during the baseline, across these two intervention groups. Distributions of the average number of steps taken a day during the baseline phase of the study were similar across the two groups, despite the disparity in number of participants. From this test we found that median engagement score for self-awareness (7706.90) and social awareness (7004.65) was not statistically significantly different, U = 264, z = -.415, p = .678.
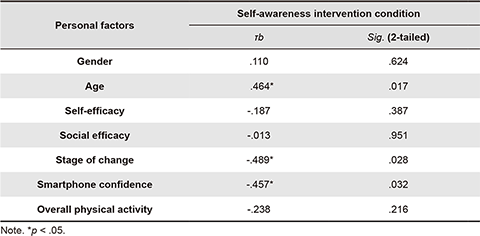
Originally, we aimed to run a similar multiple regression on each intervention condition group separately. However, when divided into the two different intervention conditions, the data from the self-awareness group was not sufficient to run a multiple regression, as the data did not meet the Durbin-Watson requirement and had multicollinearity problems, even after excluding some of the troublesome variables. Instead, we used a nonparametric correlation analysis to find the strength and direction of the relationship between each personal factor examined and the relative increase in physical activity measured for this intervention condition. The Kendall’s tau-b (τb) correlation was used to find the relationship between each personal factor examined and the relative improvement in steps, see details in Table 6. Age, stage of change, and smartphone confidence were found to have a statistically significant effect (at 95% confidence, for age, p = 0.017, for stage of change p = 0.28, and for smartphone confidence p = 0.032) on the relative improvement of daily physical activities stimulated by self-awareness.
Table 6. Results of the Kendal’s Tau-b correlation between personal factors and relative improvement of physical activity over the data of the self-awareness condition.
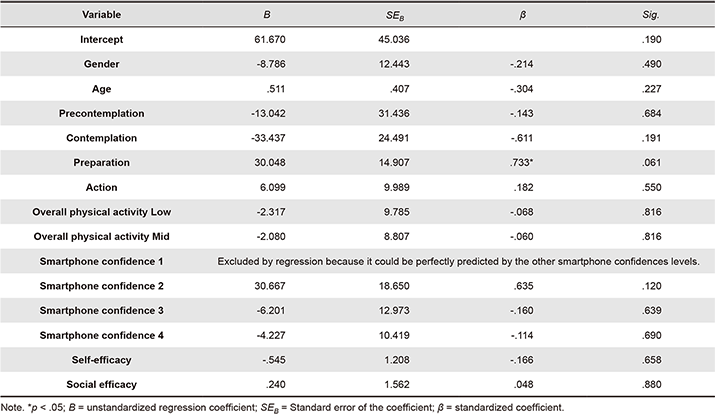
For the data from the social-awareness group, it was feasible to run a multiple regression analysis after the validation. Accordingly, we ran another similar multiple regression analysis on only the data set from this intervention group. Detailed results are listed in Table 7. Linearity and homoscedasticity were established by assessment of the relevant plots. There was an independence of residuals, as the Durbin-Watson statistic was found to be 2.166. The studentized deleted residual all ranged from -1.743 to 2.304, and all of the centered leverage values were above the problematic value of 0.2. Cook’s distance values were never greater than 1. R2 for the overall model was 48.7% with an adjusted R2 of 7.1. Age, gender, self-efficacy, social efficacy, overall physical activity, and smartphone confidence were found not to be statistically significant to relative improvement in daily steps, F(13, 16) = 1.171, p = .377. However, we did observe that stage of change: preparation was significant, p = .061 at a confidence level of 90%.
Table 7. Summary of multiple regression analysis, coefficients Table of the social awareness intervention condition.
In conclusion, from running a multiple regression on the entire data set we found application allocation (intervention condition), stage of change, and smartphone confidence to have a significant relationship with relative increase in physical activity. The correlation analysis of the self-awareness intervention condition reiterated the relevance of stage of change and smartphone confidence, while also showing age to be significantly correlated to the relative improvement in total daily steps. The multiple regression analysis of the data from the social-awareness condition suggested that stage of change at preparation was found to have a statistically significant effect to the relative improvement.
These findings suggest the self-awareness BC strategy might effectively address people with low smartphone confidence, at an earlier stage of change, and of advanced age. While the social awareness strategy might be used more effectively to address people who are already in the preparation stage.
In the next section we will discuss each of these personal factors in detail with some additional explorations.
Further Analysis
The aim of this work is to investigate how to profile older users, to most effectively personalize BC solutions towards increased physical activity. To that end we conducted further investigations into each personal factor examined, which will be discussed in this section.
Age
We were originally interested in age specifically because it seems to be one of the most commonly used profiling factors. Yet, from our regression analyses we found that age did not have a significant relationship with relative improvement, for the overall participant group nor for the social awareness group. However, in the smaller self-awareness group age was found to positively correlate to the relative improvement of physical activity. To examine the relationship between physical activity and age further, we conducted a Spearman’s rank-order correlation to examine the relationship between age and overall physical activity. From this correlation we found that there was a statistically significant, moderate negative correlation between age and overall level of physical activity, rs(95) = -.304, p = .027. This finding resonates with other sources which cite similar findings: as age increases, physical activity tends to decrease (Davis et al., 2011).
There is a general misconception that the potential for change decreases with age, so bluntly but aptly described in the age-old adage; “you can’t teach an old dog new tricks”. However, our findings suggest that age affects absolute physical activity but not the individual relative improvement stimulated by the two tested BC strategies. If we examine relative improvement, as a manifestation of potential to change physical activity habits, we find that there is no decrease in potential towards this kind of change with age. This finding reaffirms the importance of personalized BC research and its potential to benefit older adults.
Gender
Gender is commonly used as a personal factor for profiling, however, from our regression and subsequent analysis, we found gender not to be correlated with relative improvement. To examine the relationship between gender and overall physical activity in steps we ran a Kendall’s tau-b correlation. There was a very small negative association between gender and overall physical activity, and this too was not statistically significant, τb = -.043, p = .710.
This outcome might be the result of the disproportionate number of men and women we were able to recruit. On the other hand, these results might suggest that, among this population, gender was less important as a personal factor informing the effect of BC stimuli. Due to the disparity in numbers between men and women, these results are not conclusive. More specific research into this factor should be conducted to gain a more comprehensive understanding of whether gender should or should not be considered an important factor to inform the choice of BC profile.
Self-efficacy
In addition to the regression reported in the results section of this paper, we also conducted a separate Spearman’s correlation to see if we could find a relationship between the participant’s self-efficacy and their overall physical activity measured. Forty-nine participants completed the self-efficacy questionnaire and were included in this analysis. As in the regression analysis we found no statistically significant correlation between self-efficacy and overall physical activity, rs(49) = .028, p = .849.
In other studies authors cite the importance of self-efficacy to BC (Marcus & Lewis, 2003), however, our findings here do not support this directly. This might be because the self-efficacy questionnaire is not validated for this group of the population. Researchers did get comments from several participants that the questionnaire was long and some of the questions confusing. In comparison to the four-question stage of change questionnaire, the sixteen questions of the combined self- and social efficacy questionnaire might have been fatiguing for some participants in such a way that the tool did not measure this construct accurately. In addition, there might be some physical limitations to the activity that certain participants were able to achieve, due to a dependence on walking aids for example, despite their self-efficacy. To investigate this construct further, we would need a more specific research study geared to looking specifically at the effect of self-efficacy on relative improvement of physical activity.
Social Efficacy
As with self-efficacy, to determine whether social efficacy score was correlated to the relative difference in averages we ran a Spearman’s rank-order correlation. Fifty participants completed the social efficacy questionnaire. A visual inspection of the scatterplot indicated the relationship to be monotonic. Results of this investigation show that there was no statistically significant correlation between social efficacy score and relative improvement in steps, rs(50) = -.030, p = .835. These results could be attributed to the fact that we did not measure social activity specifically in this study. Potentially, participants with a higher social efficacy did become more socially active, yet this increased social activity fell outside the scope of this investigation. As with the self-efficacy questionnaire, participants might have found the questions fatiguing especially after already completing the self-efficacy questionnaire, as per the suggested order in the original publication (Sherer & Maddux, 1982). Another study focusing more specifically on the exploration of this personal factor would likely be able to provide more conclusive results.
Stage of Change
From the previously presented analysis, of the overall data and each intervention condition, we observed that stage of change significantly affected the relative improvement of physical activity. Figure 5 shows that there were more participants in the action and maintenance stage of change than in the pre-contemplation, contemplation, and preparation phase among the participants of this study. A previous, much larger study (Marcus et al., 1992) also found a large number of their participants to be either in the action or the maintenance phase and suggested these phases could be subdivided to make them more descriptive. Though only action in the overall regression and preparation in the social awareness regression were found to be statistically significant, we observed that in both regressions the earlier stages of change (precontemplation and contemplation) had an inverse relationship with the relative improvement of physical activity while later stages (preparation and action) were found to have a direct relationship to relative improvement. In the overall regression we found that action perfectly predicted maintenance, so that these two variables had the same size effect on the relative improvement though action had a positive effect while maintenance had a negative effect.
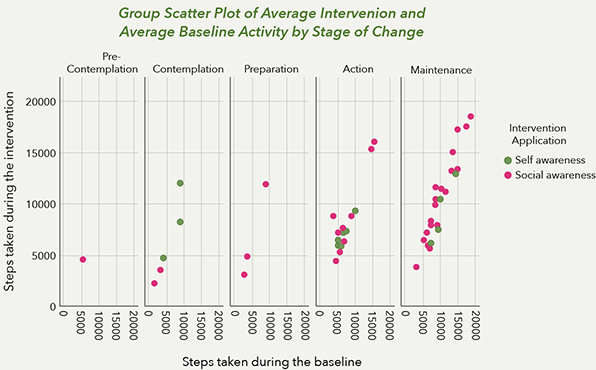
Figure 5. Spread of participant population among the different stages of change.
This result can be explained as follows; people in the action stage of change were actively trying to change their habits to increase their physical activity and, thus, in this process or perhaps with the help of a design intervention, they increased their physical activity. On the other hand, the maintenance phase is characterized by internalizing the change made. Those who were in the maintenance stage might have already reached a level of physical activity they were satisfied with before or during the baseline phase of the study, so that there was not too much more for them to improve during the intervention phase of the study. Conceivably, the social awareness BC strategy stimulated those who were already ready to increase their physical activity, to take that next step.
In contrast, the correlation analysis revealed a negative relationship between stage of change and the relative increase of physical activity of the people in the self-awareness condition. This implies that participants in an earlier stage of change would be more likely to have a larger relative increase in daily steps taken. Unfortunately, the data of the self-awareness condition was not sufficient to run a regression analysis, otherwise we would have been able to examine more closely the effect of each of the levels of the stages of change. For now, we can consider the possibility that people in an earlier stage of change such as precontemplation or contemplation, who were not quite as ready to change as people from the later stages of change such as action, respond well to an intervention which provides them with insight into their own habits, thus making them more aware of the habits they might want to change.
These findings may suggest that people might be more receptive to BC strategies or to certain BC strategies in one certain stage of change compared to another. This effect would be an important consideration to inform the choice of which BC strategies would best address their target audience.
Smartphone Confidence
From the overall regression analysis, we found that the self-reported level of smartphone confidence was statistically significant to the relative improvement in steps taken, though not at every level.
A self-reported smartphone confidence level a little apprehensive was found to have a significant correlation from the overall regression analysis. The other levels of phone confidence, though not statistically significant yet still interesting to be mentioned here, were all inversely related to relative improvement in daily steps taken. The multiple regression done on the data from the social awareness condition showed no statistical significance but, again, only phone confidence very confused had a direct relationship while the other levels had an inverse relationship. The correlation analysis of the self-awareness condition data also resulted in an inverse relationship between self-reported phone confidence and relative improvement of daily steps taken.
Our findings from the regression analysis seem to show that low self-reported confidence in smartphone use is related to higher relative improvement in steps. Perhaps those who have low smartphone confidence have only had very limited or no exposure to mobile applications which encourage physical activity. Then this study facilitated an introduction to such an intervention and provided the necessary technology support to enable these people to take advantage of this type of intervention for the first time. Other authors have explored how even the design of the accompanying manual could either facilitate or present barriers to the use and adoption of technology among older persons (Fan & Truong, 2018). For this reason, we supplied our participants with a paper-based manual with many images specific to our study.
It might have been the extra time and support the research team devoted to the people who had less experience or confidence with smartphones which could have produced this result rather than the intervention application itself. Alternatively, some participants reporting low smartphone confidence might have wanted more encouragement in other endeavors as well and thus responded well to the increased attention to physical activity.
Overall, we could not differentiate which BC strategy better addressed participants with either higher or lower levels of smartphone confidence. However, these results clearly indicate an opportunity for technology-based BC solutions, even for those who may feel apprehensive about using digital devices at first.
Comparing the BC Strategy Intervention Conditions
So far, we have found that for the participants we distributed without bias across the two intervention groups both the self-awareness and social awareness intervention seemed to contribute to increase in relative improvement. Still, we were curious to see if one intervention elicited significantly better results in terms of relative improvement compared to the other.
From the overall regression analysis there is some evidence that the social awareness intervention was more motivating to participants than the self-awareness intervention, yet we were curious to investigate this point further. The Mann-Whitney U test was used here as an alternative to the independent samples T-test because the data was not normally distributed. The Mann-Whitney U test was run to determine if there were differences in relative improvement in steps between the self-awareness condition and the social awareness condition. Distributions of the relative improvement in total daily steps between the baseline and intervention phases of the study for self- and social awareness intervention were similar, as assessed by visual inspection, despite the difference in quantity of participants. Median relative improvement in steps for participants using the self-awareness BC strategy (1.51) and participants using the social awareness BC strategy (9.10) were not statistically significantly different, U = 213, z = -1.422, p = .155. This additional analysis would suggest that there is no difference in effect caused by the BC strategies applied in these intervention applications, so that neither strategy could be construed as a better fit for this user group than the other. However, this lack of statistical result could be in part due to the incongruent number of participants in each intervention condition. The disparity in these numbers in itself points to a participant preference for the social awareness strategy as will be discussed in the limitations section.
Design Recommendations
We have investigated the effect of multiple personal factors on the effectiveness of two BC strategies, because we believe a better understanding of this relationship will allow designers to make more informed decisions about which BC strategy to apply in the development of BC solutions. To this end, we provide design suggestions based on our findings in Table 8, describe the motivational profiles we identified, and recommend an approach for peers in the field to continue to define more motivational profiles towards increasing the effectivity of BC interventions. This we offer in the hopes that even our explorative study will yield actionable inspiration for peers in the field seeking to create motivational profiles toward more effective personalization of BC strategies.
Table 8. Summary of our findings from the investigation described above.
| Personal Factor | Summary of Findings | Reflection | Design Suggestion |
| Age | Not significant to relative improvement in physical activity. Inverse correlation to absolute physical activity. | Age might affect absolute physical activity but not an individual’s potential for change within their capabilities. | Consider realistic target behaviors but be confident in people’s propensity for change. |
| Gender | Not correlated to relative improvement in daily steps nor overall physical activity. | Findings inconclusive due to the disproportionate number of men and women in study. | Further research necessary into specific differences. |
| Self-efficacy | Not correlated with relative improvement nor overall physical activity. | Our findings don’t support the importance of self-efficacy to BC, possibly due to physical limitations. | Conduct further research to see if improving self-efficacy supports BC. |
| Social efficacy | No correlation with relative improvement in daily steps taken. | Potential increase in social activity fell outside the scope of our measurements. | Conduct further research to see if improving social efficacy supports BC. |
| Stage of change | Precontemplation and contemplation had an inverse relationship with the relative improvement in steps while preparation and action had a direct relationship. | Participants in preparation or action might be more receptive to BC strategies leading to an increase in steps, than those in precontemplation or contemplation. | It is important to consider in which stage of change your target users are because this should inform how to address them with BC strategies. |
| Preparation had a significant correlation to relative improvement in the social awareness data regression. | Social awareness might be an effective BC strategy to address people in the preparation stage. | Consider how social awareness BC strategies can support individuals in the preparation phase. | |
| The correlation analysis of the self-awareness condition revealed a negative relationship between stage of change and the relative increase of physical activity. | This implies that participants in an earlier stage of change would be more likely to have a larger relative increase in daily steps taken. | Consider how self-awareness strategies can motivate people in an earlier stage of change toward BC. | |
| Smartphone confidence | Lower smartphone confidence might predict higher relative improvement in physical activity. | Could be a byproduct of extra attention researchers inevitably paid to those with less experience with smartphones or of the novelty of new technology. | These findings indicate an opportunity for technology-based BC solutions, even for those who might have low tech acceptance or adoption. |
| BC strategy intervention comparison | A nonparametric correlation analysis of self-awareness condition data found age, stage of change, and phone confidence to have a significant effect on the relative improvement in steps. | These findings suggest the self-awareness BC strategy could be effective for individuals with low smartphone confidence, at an earlier stage of change, and of advanced age. | Suggest applying self-awareness BC strategies for individuals at an earlier stage of change with low smartphone confidence and of advanced age. |
| A multiple regression on social awareness condition data found that stage of change preparation was significant, at a confidence level of 90%. | The social awareness strategy might be suited to address people who are already in the preparation stage. | Suggest applying social awareness strategies for people in preparation stage. | |
| Additional analysis did not show a difference in effect on physical activity caused by BC strategy. | Despite this outcome, the disparity in these numbers in itself points to a preference for the social awareness strategy. | Though the statistical analysis does not suggest that either strategy is a better fit for this target audience, further research should be done. |
Our findings, summarized in Table 8, are in line with the hypothesis that individuals might be more receptive to certain BC strategies depending on personal factors, such as stage of change. From our exploration here we are able to provide motivational profiles and recommendations on which BC strategy might be most effective for each, see Table 9. To create these motivational profiles we have clustered the personal factors which according to our statistical analysis predicated most responsiveness to each of the two BC strategies applied, social and self-awareness.
Table 9. Proposed motivational profiles and suggested BC strategies to address these.
| Proposed motivational profiles | Suggested BC strategy |
| Individuals who are in the preparation stage of change | A social awareness BC strategy might be effective to help people in the preparation stage move toward actualizing their intended behavior towards increased physical activity. |
| Individuals with a lower self-reported smartphone confidence, earlier stage of change, and of advanced age | Individuals with lower smartphone confidence, of advanced age, and at an earlier stage of change might benefit from self-awareness BC strategies to make them more aware of their behavior in order to motivate towards increased physical activity. |
To personalize BC solutions more effectively, we recommend creating design profiles based on a combination of contextual, behavioral, and psychological personal factors. Our findings here suggest that only looking at prevalent profiling factors such as age and gender are likely not enough to inform which BC strategy could be most effective, as we found that neither was predictive of relative improvement in physical activity. Therefore, we argue that to create effective motivational profiles towards personalization of BC strategies, a larger variety of personal factors should be used to inform these profiles. In many design processes the initial step is to create an understanding of the users, but here we suggest structuring this initial investigation phase to gain more insight into the personal factors (behavioral, contextual, and psychological) which could be relevant to BC.
Overall Limitations
The work presented here explores certain personal factors and how these relate to the demonstration of a target behavior, in this case increased physical activity, measured in steps. The study was successful in that we were able to conduct field research on factors which might inform effectivity of certain BC strategies and we were able to reliably report on the analysis of the data collected, in this work. It was difficult, however, to draw much conclusive evidence from this study, as this study focused on exploring many different possibly interrelated variables. Therefore, each of the personal factors mentioned above could have been addressed in more depth than we had the opportunity to do here.
It is clear that there were disproportionate test groups in this study in terms of intervention application use. In this section we look for the reasons for this disparity. Overall, the participant dropout rate between on-boarding and debriefing was relatively low, 11.5%, whereas other physical activity promotive research studies with older adults see dropout rates up to 36% (Schmidt et al., 2000). By way of a Fisher’s exact test, which examined the difference between independent variable groups on one dichotomous dependent variable dropout (did dropout or did not dropout), we found that there was a not statistically significant difference in proportions of .144, p = .142. However, researchers of this study observed a clear preference among the participants for the social awareness intervention as compared to the self-awareness intervention. Throughout the recruitment process, there were participants who would agree to join only if they could do so with a friend from the center. Many potential participants on hearing the explanation of the study during the self-awareness onboarding workshops declined to join the study at all, so that the number of these cases are not reflected in the dropout rate. These experiences and researcher anecdotes align with literature pointing to the potential social strategies have to motivate older adults to increase their physical activity (Kononova et al., 2019).
Despite our conviction that field studies are necessary for BC research, our approach does present some limitations. Firstly, technology savvy participants could have looked into their step data during the baseline of the study on the research issued smartphone, if they chose to do so. Secondly, there was a disproportionate number of men and women willing to participate in the study. We have learned that in general there are more female members of the senior community center than male members, but it is unclear if our population is perfectly representative of these proportions. In addition, the research here described was only conducted with participants of one local senior community center so that there may be some socio-cultural differences preventing this work from being generalizable to other older adult communities, as cultural characteristics can have an important impact on the design of interactive systems (Huang & Deng, 2008). Finally, though a practical and cost effective solution in this study, we acknowledge that ‘steps’ alone may not completely represent the physical activity of all older adult participants, despite the automatic activity recognition feature. For this reason, we consider it of great importance to call for new design research actions to focus on exploring these, and potentially other factors we have overlooked here, in much greater detail and among a larger breadth of users.
Conclusion
In this work we ran a series of analyses to identify which personal factors relate to an increase in physical activity within two BC strategy conditions. The insights presented in this work sometimes support and sometimes challenge accepted profiling practices widely used in design for behavior change. We discussed in detail the studied personal factors and their effect on effectiveness of the social awareness and self-awareness BC strategies. We share this in order to show that in behavior change research for such a diverse population as the older adult community, personalization should rely on a combination of personal factors. To inspire others in the field to personalize BC solutions for older adults, we provided design suggestions based on our findings and proposed motivational profiles identified from our statistical analysis. We believe a better understanding about which personal factors inform the effect of the chosen BC strategies will help designers make more informed decisions when creating BC solutions, whereby contributing to the health and wellbeing of the diverse older adult population.
Acknowledgements
We, the authors of this work, would like to thank the REACH Horizon 2020 project as well as our partners at the senior community center. The work presented in this paper was made possible in part by funding by European Union’s Horizon 2020 research and innovation program, under grant agreement No 690425. In addition, we would like to extend our sincerest gratitude to the men and women who made our contribution possible; the participants and volunteers of the senior community center. Thank you for making this contribution possible.
References
- Bangsbo, J., Blackwell, J., Boraxbekk, C.-J., Caserotti, P., Dela, F., Evans, A. B., …Viña, J. (2019). Copenhagen consensus statement 2019: Physical activity and ageing. British Journal of Sports Medicine, 53(14), 1-3. https://doi.org/10.1136/bjsports-2018-100451
- Bauman, A., Merom, D., Bull, F. C., Buchner, D. M., & Singh, M. A. F. (2016). Updating the evidence for physical activity: Summative reviews of the epidemiological evidence, prevalence, and interventions to promote “active aging.” The Gerontologist, 56(2), S268-S280. https://doi.org/10.1093/geront/gnw031
- Brug, J., Campbell, M., & Van Assema, P. (1999). The application and impact of computer-generated personalized nutrition education: A review of the literature. Patient Education and Counseling, 36(2), 145-156. https://doi.org/10.1016/s0738-3991(98)00131-1
- Bull, F. C., Kreuter, M. W., & Scharff, D. P. (1999). Effects of tailored, personalized and general health messages on physical activity. Patient Education and Counseling, 36(2), 181-192. https://doi.org/10.1016/s0738-3991(98)00134-7
- Cabrita, M., Nassabi, M. H., Op den Akker, H., Tabak, M., Hermens, H., & Vollenbroek-Hutten, M. (2015). An unobtrusive system to monitor physical functioning of the older adults: Results of a pilot study. In Extended Proceedings of the 23rd Conference on User Modelling, Adaptation and Personalisation. Dublin, Ireland: UMAP Workshops. http://ceur-ws.org/Vol-1388/PATH2015-paper1.pdf
- Campbell, M. K., DeVellis, B. M., Strecher, V. J., Ammerman, A. S., DeVellis, R. F., & Sandler, R. S. (1994). Improving dietary behavior: The effectiveness of tailored messages in primary care settings. American Journal of Public Health, 84(5), 783-787. https://doi.org/10.2105/AJPH.84.5.783
- Chen, Y., & Pu, P. (2014). HealthyTogether: Exploring social incentives for mobile fitness applications. In Proceedings of the 2nd International Symposium of Chinese CHI (pp. 25-34). New York, NY: ACM. https://doi.org/10.1145/2592235.2592240
- Chodzko-Zajko, W., Schwingel, A., & Park, C. H. (2009). Successful aging: The role of physical activity. American Journal of Lifestyle Medicine, 3(1), 20-28. https://doi.org/10.1177/1559827608325456
- Davis, M. G., Fox, K. R., Hillsdon, M., Sharp, D. J., Coulson, J. O. C., & Thompson, J. L. (2011). Objectively measured physical activity in a diverse sample of older urban UK adults. Medicine and Science in Sports and Exercise, 43(4), 647-654. https://doi.org/10.1249/MSS.0b013e3181f36196
- De Rezende, L. F. M., Rey-López, J. P., Matsudo, V. K. R., & Luiz, O. D. C. (2014). Sedentary behavior and health outcomes among older adults: A systematic review. BMC Public Health, 14(1), no. 333. https://doi.org/10.1186/1471-2458-14-333
- European Commission. (2018). Ethics and data protection. Retrieved from https://ec.europa.eu/info/sites/info/files/5._h2020_ethics_and_data_protection_0.pdf
- Fan, M., & Truong, K. N. (2018). Guidelines for creating senior-friendly product instructions. ACM Transactions on Accessible Computing, 11(2), no. 9. https://doi.org/10.1145/3209882
- Friederichs, S. A., Bolman, C., Oenema, A., & Lechner, L. (2015). Profiling physical activity motivation based on self-determination theory: A cluster analysis approach. BMC Psychology, 3(1), no. 1. https://doi.org/10.1186/s40359-015-0059-2
- Gobbens, R. J., Van Assen, M. A., Luijkx, K. G., Wijnen-Sponselee, M. T., & Schols, J. M. (2010). The Tilburg Frailty Indicator: Psychometric properties. Journal of the American Medical Directors Association, 11(5), 344-355. https://doi.org/10.1016/j.jamda.2009.11.003
- Gregor, P., Newell, A. F., & Zajicek, M. (2002). Designing for dynamic diversity: Interfaces for older people. In Proceedings of the ACM Conference on Assistive Technologies (pp. 151-156). New York, NY: ACM. https://doi.org/10.1145/638249.638277
- Hardcastle, S. J., & Hagger, M. S. (2016). Psychographic profiling for effective health behavior change interventions. Frontiers in Psychology, 6(1988), 1-2. https://doi.org/10.3389/fpsyg.2015.01988
- Huang, K. H., & Deng, Y. S. (2008). Social interaction design in cultural context: A case study of a traditional social activity. International Journal of Design, 2(2), 81-96.
- Kaptein, M., Markopoulos, P., De Ruyter, B., & Aarts, E. (2015). Personalizing persuasive technologies: Explicit and implicit personalization using persuasion profiles. International Journal of Human Computer Studies, 77, 38-51. https://doi.org/10.1016/j.ijhcs.2015.01.004
- Kononova, A., Li, L., Kamp, K., Bowen, M., Rikard, R. V, Cotten, S., & Peng, W. (2019). The use of wearable activity trackers among older adults: Focus group study of tracker perceptions, motivators, and barriers in the maintenance stage of behavior change. JMIR Mhealth and Uhealth, 7(4), e9832. https://doi.org/10.2196/mhealth.9832
- Lee, L., Arthur, A., & Avis, M. (2008). Using self-efficacy theory to develop interventions that help older people overcome psychological barriers to physical activity: A discussion paper. International Journal of Nursing Studies, 45(11), 1690-1699. https://doi.org/10.1016/j.ijnurstu.2008.02.012
- LeRouge, C., Ma, J., Sneha, S., & Tolle, K. (2011). User profiles and personas in the design and development of consumer health technologies. International Journal of Medical Informatics, 82(11), e251-e268. https://doi.org/10.1016/j.ijmedinf.2011.03.006
- Looman, W. M., Fabbricotti, I. N., Blom, J. W., Jansen, A. P. D., Lutomski, J. E., Metzelthin, S. F., & Huijsman, R. (2018). The frail older person does not exist: Development of frailty profiles with latent class analysis. BMC Geriatrics, 18(1), no. 84. https://doi.org/10.1186/s12877-018-0776-5
- Lopez, P., Pinto, R. S., Radaelli, R., Rech, A., Grazioli, R., Izquierdo, M., & Cadore, E. L. (2018). Benefits of resistance training in physically frail elderly: A systematic review. Aging Clinical and Experimental Research, 30(8), 889-899. https://doi.org/10.1007/s40520-017-0863-z
- Lyons, E. J., Lewis, Z. H., Mayrsohn, B. G., & Rowland, J. L. (2014). Behavior change techniques implemented in electronic lifestyle activity monitors: A systematic content analysis. Journal of Medical Internet Research, 16(8), e192. https://doi.org/10.2196/jmir.3469
- Lyons, E. J., Swartz, M. C., Lewis, Z. H., Martinez, E., & Jennings, K. (2017). Feasibility and acceptability of a wearable technology physical activity intervention with telephone counseling for mid-aged and older adults: A randomized controlled pilot trial. JMIR Mhealth and Uhealth, 5(3), e28. https://doi.org/10.2196/mhealth.6967
- Marcus, B. H., & Lewis, B. A. (2003). Physical activity and the stages of motivational readiness for change model. Research Digest, 4(1). https://sites.uni.edu/dolgener/personal_wellness/PWNT_Readings/Stages_of_Change_and_Activity.pdf
- Marcus, B. H., Selby, V. C., Nlaura, R. S., & Rossi, J. S. (1992). Self-efficacy and the stages of exercise behavior change. Research Quarterly for Exercise and Sport, 63(1), 60-66. https://doi.org/10.1080/02701367.1992.10607557
- McAuley, E., Konopack, J., & Motl, R. (2006). Physical activity and quality of life in older adults: Influence of health status and self-efficacy. Annals of Annals of Behavioral Medicine, 31(1), 99-103. https://doi.org/10.1207/s15324796abm3101_14
- McMahon, S. K., Lewis, B., Oakes, M., Guan, W., Wyman, J. F., & Rothman, A. J. (2016). Older adults’ experiences using commercially available monitor to self-track their physical activity. JMIR Mhealth Uhealth, 4(2), 1-9. https://doi.org/10.2196/mhealth.5120
- Michie, S., Wood, C. E., Johnston, M., Abraham, C., Francis, J. J., & Hardeman, W. (2015). Behaviour change techniques: The development and evaluation of a taxonomic method for reporting and describing behaviour change interventions (a suite of five studies involving consensus methods, randomised controlled trials and analysis of qualitative data). Health Technology Assessment, 19(99), 1-188. https://doi.org/10.3310/hta19990
- Middelweerd, A., Mollee, J. S., Van der Wal, C. N., Brug, J., & Te Velde, S. J. (2014). Apps to promote physical activity among adults: A review and content analysis. International Journal of Behavioral Nutrition and Physical Activity, 11(97), 2-9. https://doi.org/https://doi.org/10.1186/s12966-014-0097-9
- Nagai, K., Miyamato, T., Okamae, A., Tamaki, A., Fujioka, H., Wada, Y., …Domen, K. (2018). Physical activity combined with resistance training reduces symptoms of frailty in older adults: A randomized controlled trial. Archives of Gerontology and Geriatrics, 76, 41-47. https://doi.org/10.1016/J.ARCHGER.2018.02.005
- Preusse, K. C., Mitzner, T. L., Fausset, C. B., & Rogers, W. A. (2017). Older adults’ acceptance of activity trackers. Journal of Applied Gerontology, 36(2), 127-155. https://doi.org/10.1177/0733464815624151
- Prochaska, J. O., & Velicer, W. F. (1997). The transtheoretical change model of health behavior. American Journal of Health Promotion, 12(1), 38-48. https://doi.org/10.4278/0890-1171-12.1.38
- Purpura, S., Schwanda, V., Williams, K., Stubler, W., & Sengers, P. (2011). Fit4life: The design of a persuasive technology promoting healthy behavior and ideal weight. In Proceedings of the Conference on Human Factors in Computing Systems (pp. 423-432). New York, NY: ACM. https://doi.org/10.1145/1978942.1979003
- Schmidt, J. A., Gruman, C., King, M. B., & Wolfson, L. I. (2000). Attrition in an exercise intervention: A comparison of early and later dropouts. Journal of the American Geriatrics Society, 48(8), 952-960. https://doi.org/10.1111/j.1532-5415.2000.tb06894.x
- Schutzer, K. A., & Graves, B. S. (2004). Barriers and motivations to exercise in older adults. Preventive Medicine, 39(5), 1056-1061. https://doi.org/10.1016/j.ypmed.2004.04.003
- Seifert, A., Schlomann, A., Rietz, C., & Schelling, H. R. (2017). The use of mobile devices for physical activity tracking in older adults’ everyday life. Digital Health, 3. 1-12. https://doi.org/10.1177/2055207617740088
- Sherer, M., & Maddux, J. E. (1982). The self-efficacy scale: Construction and validation. Psychological Reports, 51(2), 663-671. https://doi.org/10.2466/pr0.1982.51.2.663
- U. S. Department of Health and Human Services. (1996). Physical activity and health: A report of the surgeon general. Retrieved from https://www.cdc.gov/nccdphp/sgr/pdf/sgrfull.pdf
- Valk, C., Lu, Y., Ren, X., Wintermans, M., Kraaijevanger, I., Steenbakkers, J., & Visser, V. (2017). Towards personalized persuasive strategies for active ageing. Gerontechnology, 16(3), 160-172. https://doi.org/10.4017/gt.2017.16.3.005.00
- Visser, T., Vastenburg, M. H., & Keyson, D. V. (2011). Designing to support social connectedness: The case of snowglobe. International Journal of Design, 5(3), 129-142.
