
How Do People Adapt to Use of an IoT Air Purifier?: From Low Expectation to Minimal Use
Minji Cho 1,*, Sangsu Lee 1, and Kun-Pyo Lee 2
1 Department of Industrial Design, KAIST, Daejeon, South Korea
2 School of Design, The Hong Kong Polytechnic University, Hong Kong, China
Due to the rising number of networked objects, IoT (Internet of Things)-enabled products are increasingly available on the consumer market, and IoT features are added to conventional home appliances. However, knowledge of the adaptation process of nonexpert users when adopting IoT products at home is still in its early stage. In this paper, we present a four-week qualitative study on how users adapt to an IoT air purifier at home. We aimed to understand the adaptation process an end user goes through when using an IoT product in a domestic environment. Our findings show that users go through four adaptation stages: low expectation, trust building, behavior change, and minimal use. We found that user interfaces that show sensor data affect the transition in the early stages, while actuator-enabled automation influences the transition to the last stage. Based on the understanding of the four stages in adaptation, we suggest design implications to enhance the user experience of accepting IoT products at home in the early and late stages of adaptation.
Keywords – Internet of Things, Adaptation Stages, User Research in the Wild.
Relevance to Design Practice – This study focused on users’ adaptation to an IoT air purifier and what factors influenced transition to stages. We identified design implications to improve the user experience of an IoT product in a domestic environment.
Citation: Cho, M., Lee, S., & Lee, K. -P. (2019). How do people adapt to use of an IoT air purifier?: From low expectation to minimal use. International Journal of Design, 13(3), 21-38.
Received June 18, 2018; Accepted October 10, 2019; Published December 31, 2019.
Copyright: © 2019 Cho, Lee, & Lee. Copyright for this article is retained by the authors, with first publication rights granted to the International Journal of Design. All journal content, except where otherwise noted, is licensed under a Creative Commons Attribution-NonCommercial-NoDerivs 2.5 License. By virtue of their appearance in this open-access journal, articles are free to use, with proper attribution, in educational and other non-commercial settings.
*Corresponding Author: mjcho@kaist.ac.kr
Minji Cho is a PhD candidate in the Department of Industrial Design, KAIST. She received a Bachelor of Science in Industrial Design and Business and Technology Management with minor in Computer Science from the same school. After spending five years as a member of the Human-Centered Interaction Design Lab led by Kun-Pyo Lee, she joined the Next Interface Lab led by Sangsu Lee. Her research interests lie in interaction design, focusing on user experience at home with a smart conversational agent.
Sangsu Lee is an assistant professor at the industrial design department at KAIST and leads the Next Interface lab, which studies more natural and human-centered future interfaces for everyone. After he received his PhD at the Human-centered interaction design lab, he worked at Samsung Mobile as a UX Lead and was designing user interfaces for the Galaxy series for several years. Based on his experience in the design industry, he is interested in practical design research in the field of user interface design that bridges the gap between academic research and practice.
Kun-Pyo Lee is Dean of the School of Design at Hong Kong Polytechnic University and is an Honorary Fellow of the Design Research Society. He was a professor and head of the Dept. of Industrial Design at KAIST, Korea, was the co-founder of IASDR, has served as President of the Korea Society of Design Science and the Korean Society for Emotion and Sensibility, and has also served as Vice President of the Ergonomics Society of Korea. He studied design at Joong Ang University (BFA) in Korea, at the Institute of Design, Illinois Institute of Technology (MS) in the USA, and at the University of Tsukuba (PhD) in Japan. For some years, he was in charge of designing entire product lines as head of the Corporate Design Center and Executive VP at LG Electronics. His research interests include design planning, user-centered design, design innovation, design strategy, and more recently, AI design.
Introduction
The term Internet of Things (IoT) has been around since its inception in 1999 (Ashton, 2011), and the definition of IoT is expanding from machine-to-machine communication without human interaction to scenarios in which the Internet connects people to devices and everyday items that have computing capabilities (Brown, 2016; Rose, Eldridge, & Chapin, 2015). Thanks to a variety of open wireless technologies, sensors, and actuators that enable the IoT, the market size of the IoT is predicted to increase to 520 billion dollars in 2021, which is more than double the 235 billion dollars value of 2017 (Columbus, 2018). As such, the IoT has clearly solidified its presence in the market, and it has received significant attention in academia following the previous studies on pervasive computing. The area of smart homes has changed because of the IoT (De Silva, Morikawa, & Petra, 2012), and there have been studies on how users incorporate them into their lives.
We conduct a four-week user study to investigate how users adapt to an IoT air purifier at home. Due to the ambiguity of the definition of the IoT, we want to see how users adapt to an IoT product at home and how its IoT features affect their adaptation process. Taking a user-centered approach to IoT, our research aims to understand what stages nonexpert users go through when adapting to these products and what promotes transition to the next stage, as well as to obtain design implications to develop a better IoT product usage experience for the future.
Focusing on IoT at home, we chose an IoT air purifier as the target product for the study. There are a number of IoT products available on the market, and we looked at the components that make up IoT devices to set the criteria, which include hardware (sensors, actuators, and communication hardware), middleware, and storage (Gubbi, Buyya, Marusic, & Palaniswami, 2013), while IoT resources include sensors, actuators, storage, and user interface (Patel & Cassou, 2015). We decided to look for a product that had sensors, actuators, and a user interface so that we could observe how users perceive and adapt to the IoT device rather than simply adapting to the data display from sensors, and we could also identify how those IoT components influence user experience. Therefore, a product that does not have a sensor and requires user control or a product that does not have an actuator and therefore can only be monitored was excluded, and thus chose an IoT air purifier that meets these criteria. This product receives the outdoor air quality (OAQ) of the area through the Internet, measures indoor air quality (IAQ) with its built-in sensor (the sensor component), cleans air using a purifying function that is activated by sensed data (the actuator component), and displays this information through the LED of the product and its smartphone application (the user interface component). Additionally, this product aligns with the viewpoint that the IoT should be integrated into products that users already use in their daily lives (Jia, Wu, Jung, Shapiro, & Sundar, 2012).
In what follows, we present the findings from our study on how users adapt to an IoT purifier at home and how this adaptation process could be used in IoT design. By understanding the adaptation process of users, we determine how they perceive and use IoT products and what influence them to move on to the next adaptation stage. We identified four adaptation stages and suggest design implications for the early and later stages of adaptation.
Related Work
User-Centered Approach to Designing IoT Products
IoT products, including smart homes, have been the subject of research in the Human-computer Interaction (HCI) field for decades (Atzori, Iera, & Morabito, 2010; Koreshoff, Robertson, & Leong, 2013; Mennicken, Vermeulen, & Huang, 2014; Wilson, Hargreaves, & Hauxwell-Baldwin, 2015). Several previous studies have been conducted related to the IoT, such as presenting technological advances that enable the IoT, exploring possible applications and systems (Cook et al., n.d.; Kubitza, Voit, Weber, & Schmidt, 2016; Nakamura, Arakawa, & Yasumoto, 2016), developing middleware and an infrastructure (Carlson, Mogerle, Pagel, Verma, & Rosenblum, 2015; Kubitza et al., 2016), and suggesting ideation methods (Jung, Nam, Lim, & Lee, 2017; Mora, Gianni, & Divitini, 2017). Among them, the studies that took a user-centered design perspective are most relevant to our research topic, especially those involving a user study.
The research most similar to ours is a study that investigated how users use IoT products in the wild. Yang and Newman (2013) used Nest, a learning thermostat, in diary studies and conducted interviews. They identified that the system did not fully understand the intent behind a users’ behavior and that the users had difficulty understanding how Nest works. Brush et al. (2011) explored the barriers to accepting various home automation systems through home-visit interviews. Like our research, both studies tackled the difficulties that people face while using IoT products. In a study that suggested a future scenario using a laundry agent prototype designed for using the washing machine more efficiently, researchers identified obstacles when deploying such a system in an actual environment (Costanza et al., 2014). In addition, there have been studies conducted on user satisfaction and failure when adopting home automation (Takayama, Pantofaru, Robson, Soto, & Barry, 2012) and user concerns when living with an ambiguous IoT device (Worthy, Matthews, & Viller, 2016). The biggest difference in our study is that we targeted the users’ stages of adaptation to the IoT and suggested implications for it instead of focusing on the burdens of adoption.
In addition, research on the use stages of IoT products can be found primarily in relation to a DIY smart home. Funk, Chen, Yang, and Chen (2018) described a first-person user experience of smart-home programming including three rounds of installation with over 150 IoT devices. Analyzing user intentions mapped to rules, the authors claimed that the conventional if-then rules do not fully support user needs and proposed the Intentional Interactive Programming approach that captures information such as scenarios and intentions to enable a higher level of abstraction to be implemented in a domestic environment. An in-situ observational study of how users use various IoT products for a DIY smart home revealed a usage cycle (Woo & Lim, 2015). Eight households created rules using a trigger-action programming language to connect their sensors and actuators, and they experienced stages from initial installation to removal that provided design implications for DIY smart home products. A similar study to this was conducted by interviewing home automation stakeholders, including actual users, to find motivations for home automation and steps for making the home smart (Mennicken & Huang, 2012). These studies provide insights into what steps the user goes through to complete home automation but still leave room to study how users will accept and adapt to IoT products.
While not observing users directly in the wild, there are studies that have shown how users accept IoT products or services. The researchers achieved this by collecting users’ online reviews (Purington, Taft, Sannon, Bazarova, & Taylor, 2017), conducting large-scale quantitative studies (Ben Allouch, van Dijk, & Peters, 2009), and analyzing recipes shared through if this, then that (IFTTT) (Ur, McManus, Ho, & Littman, 2014; Ur et al., 2016). Yarosh and Zave (2017) conducted a mixed-methods lab investigation, which included posing scenarios and asking how they were interpreted, to understand users’ mental models of feature interaction resolution. Hwang, Truong, and Mihailidis (2012) conducted participatory design sessions and usability testing for an intelligent assistive system in the home for caregivers. Another participatory design case study was conducted with connected plants to explore the value of socially embedded IoT devices (Martindale, Bedwell, Phillips, & Pedros, 2017). Our study complements some of these findings by adding the lived experience of IoT users.
Other studies have illustrated the direction of IoT development. For example, Crabtree and Tolmie (2016) observed participants’ mundane interactions with things in the home to suggest possible directions for IoT development. Wakkary et al. (2017) took a thing-centered approach to bridge the gap between things and humans and gained insights that led to a new type of IoT in the home. A modeling technique with relational approaches to designing IoT systems was explored to help model relationships between a user and a smart object and between smart objects in complex IoT systems (Ghajargar, Wiberg, & Stolterman, 2018). In addition, some studies have suggested IoT development and research directions based on the author’s past empirical work (Hwang & Hoey, 2012; Mennicken et al., 2014). Another study suggested the user dimensions in IoT model, which explained that the user interface and the ecosystem of the IoT product influence user interaction and the item’s perceived value (Olsson, Bosch, & Katumba, 2016). We propose design implications using the insight obtained from the user’s IoT adaptation stages so they can be added to these directions.
Users Accepting New Technology
Apart from the topic of the IoT, many researchers have studied users’ steps to adapting new technologies. There are many key theoretical models on how users accept new technologies (Davis, Bagozzi, & Warshaw, 1989; Hirsch & Silverstone, 2003), such as the technology adoption life cycle (Moore, 1991). In addition to well-known theories, there are case studies on adaptation steps for specific products. Li, Dey, and Forlizzi (2010) conducted surveys and interviews with existing users of personal informatics and introduced the stage-based model of personal informatics that consists of preparation, collection, integration, reflection, and action. Karapanos, Zimmerman, Forlizzi, and Martens (2009) suggested a conceptual model of temporality of experience drawn from a five-week smartphone user study and determined that familiarity, functional dependency, and emotional attachment motivate the transition to the adoption phase of orientation, incorporation, and identification. In the home environment, De Graaf, Ben Allouch, and van Dijk (2018) suggested a phased framework of long-term acceptance of an interactive robot that consisted of expectation, encounter, adoption, adaptation, integration, and identification phases. Each phase evolved as people gain experience with the technology over time. In a study involving a robot vacuum cleaner, Sung, Grinter, and Christensen (2010) revealed four temporal stages of pre-adoption, adoption, adaptation, and use/retention in users’ acceptance of robots as a part of the household. Montalván, Shin, Cuéllar, and Lee (2017) added two more stages, exploration and habituation, based on a six-month study of robot vacuum cleaner users. Given these insights, we expected to see transitions in users’ adaptation process when using IoT products at home and, thus, discover what induces their transitions.
Although it is not an adaptation model, research observing the behavior change that occurs when a user accepts a new product has been conducted in the persuasive technology field (Fogg, 2002; Satyanarayanan, 2001). Researchers have also created prototypes of Indoor Air Quality (IAQ) monitoring devices, given them to actual users, and observed their usage patterns and behavioral changes (Kim & Paulos, 2009, 2010; Kim, Paulos, & Mankoff, 2013). Other studies on the change of users’ awareness and behavior according to house environment data include those for electricity and water use (Kuznetsov & Paulos, 2010; Moreno, Ramos, & Skarmeta, 2014; Riche, Dodge, & Metoyer, 2010). In a study related to health, Fritz, Huang, Murphy, and Zimmermann (2014) interviewed long-term users of activity trackers. Other researchers have made prototypes that encouraged physical activity and observed changes in users (Consolvo et al., 2008; Lin, Mamykina, Lindtner, Delajoux, & Strub, 2006; Toscos, Faber, An, & Gandhi, 2006). However, trying to change behavior based on data is not the original goal of the IoT. Our study allowed us to observe people using products that contain actuators in addition to sensors. Our goal was not just to see how users’ behaviors changed but to see what steps they took during the adaptation process and what motivated their transitions.
In summary, we wanted to investigate users’ adaptation process when using an IoT air purifier. Our study contributes to the literature—we provide the adaptation stages of using an IoT product at home and the factors influential to the transitions. We also offer user-centered design implications for future IoT products for the home.
Study Design
In this paper, we present the results of a qualitative study in which we followed eight participants from different households for four weeks to understand the stages of adapting to use of an IoT air purifier at home (2016-2017). We used a set of complementary qualitative user study methods to track the changes in participants’ behavior and thoughts.
Target Product
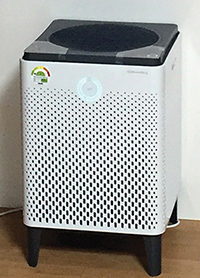
Figure 1. Coway IoT air purifier with color-coded LEDs.
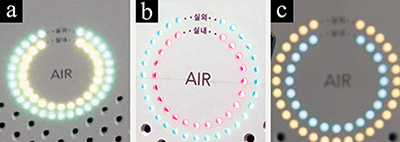
Figure 2. Color-coded LEDs on the air purifier, the outer ring for OAQ and inner ring for IAQ:
(a) moderate OAQ and poor IAQ, (b) good OAQ and very poor IAQ, (c) poor OAQ and good IAQ.
We used an IoT air purifier from Coway, a Life Care solution company (see Coway website, http://www.coway.com/). As mentioned in the introduction, we chose this product because it has all the components of an IoT device (Gubbi et al., 2013; Patel & Cassou, 2015), so we could observe how users perceived and adapted to use of the IoT device rather than simply adapting to data from a single sensor. We could also identify how those components influence user experience. The air purifier connects to the Internet to receive the air quality information of the local area, shows the data detected by the sensor, and automatically activates and adjusts the air purifying function according to the data, so it was representative enough to be selected.
This product displays IAQ and OAQ by means of color-coded LEDs on the surface of the product (Figure 1 and 2). IAQ is measured by the sensor of the air purifier, and OAQ is received from data that the government updates for each area. The IoT air purifier works with a compatible smartphone application that shows air quality reports and enables remote use (Figure 3). In the application, IAQ is divided into fine dust, ultrafine dust, living gas, and carbon dioxide, and their levels are shown in words (e.g., good, moderate) and graphs. Using this app, users can control the air purifier from anywhere, and they can see air quality reports outside the home as well. We explained these IoT features of the air purifier to the participants before the study. Some of the participants who had already been using the air purifier but did not know the IoT features and did not connect it to the Internet, so we informed them its IoT features to observe their experience of using IoT. We also informed the participants who had not used it before because there was a risk that they would use it without knowing its IoT features.
South Korea’s air quality is ranked 173 out of 180 countries around the world (Hsu & Zomer, 2016). Annual air purifier sales are about half of TV sales (“Air Purifier Market Balloons to 1 Tril. Won,” 2016). Because many Koreans already use an air purifier in their home and know its functions, it was easier to focus on the experience of using IoT features rather than merely using the already familiar air purifying function.
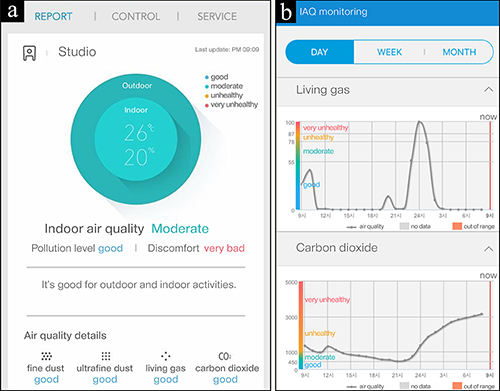
Figure 3. Smartphone application for an IoT air purifier (translated):
(a) the main page for the air quality report, (b) detailed report with indoor gas level graph and CO2 level graph.
Participants
In this study, we chose nonexpert users as the participants rather than expert users because we wanted to see everyday use of IoT products that does not require related knowledge. There are a variety of IoT products and services on the market, but those that allow DIY use are reserved only for expert users who actively participate (Woo & Lim, 2015), and they are not very accessible to nonexpert users who lack such passion and knowledge. We are still at the stage of exploring possibilities, and we expect that by observing the IoT adaptation stages of nonexpert users who perceive the value of the IoT to be low (Accenture, 2016), designers will find a way forward to reach those who have not yet enjoyed the benefits of the IoT.
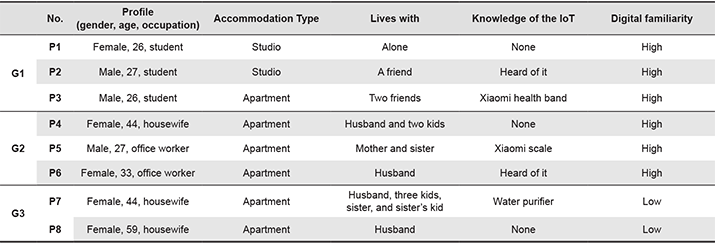
We recruited eight participants from different households in South Korea who were not using other IoT products. They defined themselves as nonexpert users, neither early adopters nor expert users, although their knowledge about the IoT and the digital familiarity they reported were different. All of them had used conventional air purifiers in the past; three of them had never used the Coway IoT air purifier before, and the other five had used it as a conventional air purifier without knowing about its IoT function or activating the IoT features. Thus, all of the participants were first-time users of the IoT features of Coway’s IoT air purifier. The observations did not indicate a significant difference from their previous use in the adaptation process. As outlined in Table 1, the eight participants varied in terms of age, occupation, living situation, and self-reported digital familiarity. We subdivided these participants into three groups—G1 for those who had never used a Coway IoT air purifier before, G2 for those who had used it before without its IoT function and had a high digital familiarity, and G3 for those who had used it before without its IoT function and had a low digital familiarity. We recruited participants by posting in local communities as well as through Coway’s customer base.
Table 1. Participant Profiles.
User Study Method
To see how the participants adapted to and used the IoT air purifier, we conducted home-visit interviews, used group diaries, and held focus group interviews (FGIs), as shown in Figure 4. We learned about the participants’ perceptions and expectations in the first interview, then determined what they had experienced and felt in their use through group diaries, and, finally, debriefed their past experiences and obtained more details in the FGI sessions.
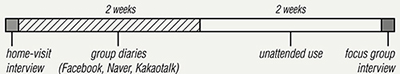
Figure 4. Study process.
First, we conducted the semi-structured home-visit interviews the day before the study. In the home-visit interviews, for those participants who had been using the IoT air purifier without its IoT features, we instructed them on how to enable and use its IoT features, and we provided the IoT air purifier for the participants who did not have one. For the first two weeks, participants were asked to share their thoughts and episodes related to the air purifier through social media (Facebook group, NaverBandTM, and KakaoTalkTM) at least once every two or three days. Group members chose which social media platform to use as a channel for sharing their group diaries. In other words, the participants shared their diaries with each other in an online group and left reactions on others’ posts, keeping their diaries and sharing their experiences through photographs as people would normally do on social media. Our purpose of having groups to share diaries together was to help the participants to have a chance to think about what they had not thought about through the group diaries, expecting the diary posts to act as stimuli for thoughts for the participants to react to. We wanted the participants to take a look at the other participants’ diaries and to think, such as same here, or what about my case? The participants shared how they were using it, what difficulties they had, and what was good about the air purifier, but they did not interact that much with each other in the group diaries, as they often just pressed the ‘like’ button rather than actively leaving comments. In the FGI sessions, however, the participants talked about each other’s diaries and shared what they thought about those posts. The participants’ questions that were raised in the diary posts were not answered in the group diaries, but they talked about those questions in the FGI sessions. They shared detailed stories and revived experiences that they were unaware of based on parts of experiences that they had already shared with one another. The participants did not know each other before the study but got to know each other through the group diaries, and eventually became more familiar with the other participants in the final FGI sessions.
Additionally, we collected the usage patterns associated with other products from two participants (P4 and P7), although this was not the main goal of our study. We installed Sen.se’s Mother (hub) and attached Cookies (motion sensors) (see the Sen.se Mother review: https://www.cnet.com/reviews/sense-mother-review/) to their air purifiers and other air-related items that they were using (windows, vacuum cleaners, and kitchen ventilators), to measure the time and frequency of each usage (Figure 5).
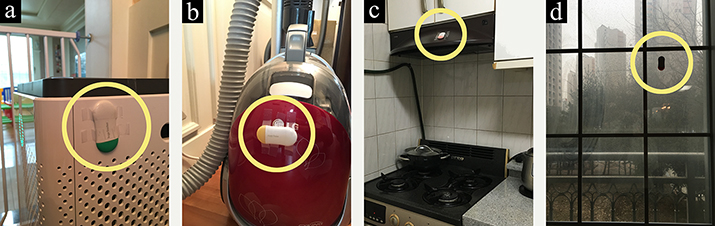
Figure 5. Cookies attached to: (a) an air purifier, (b) a vacuum cleaner, (c) kitchen ventilator, and (d) windows.
By the end of the first two weeks, we noticed from the diaries that the early stage of exploration had already passed and habituation had taken place. Data saturation (Guest, Bunce, & Johnson, 2006) occurred much earlier than we expected; new themes did not emerge, and participants texted us that there was nothing to write about but repeated stories. To determine the invisibility of the product, we decided to eliminate the diary task. For the remaining two weeks, participants were free from any task except using the IoT air purifier in the way they wanted. After a total of four weeks of study, the participants were invited as a group to the semi-structured FGI sessions and were asked to revisit their group diaries to share their experiences.
Data Analysis
By the end of the study, we transcribed 6.1 hours of recordings from eight home-visit interviews and three FGI recordings, and collected 47 group diary posts from social media with photos (Figure 6) and usage logs of P4 and P7 from Sen.se (Figure 7). Grounded theory (Strauss & Corbin, 1990) was used to analyze these data, and two researchers independently coded data instances and grouped codes into categories. Discussion and redevelopment of categories continued to find emerging themes until we reached an agreement. Because we were interested in the changes in user experience over time, we aligned them along a time axis to show any change in the participants’ engagement with the IoT air purifier, behaviors, and strategies.
|
Translated: (a) I bought a stuckyi for air purification. I bought it from a flower shop in Hanbit Plaza. Stuckyi, a succulent plant of cactus species, absorbs carbon dioxide at night, unlike other plants. In fact, it’s hard to expect a big change with one pot, but I just bought it. Room seems to have a better vibe. (b) What should I do with carbon dioxide level in my home? Now the weather is warm and when it’s summer, I wonder how the air quality will be changed when I open the door. |
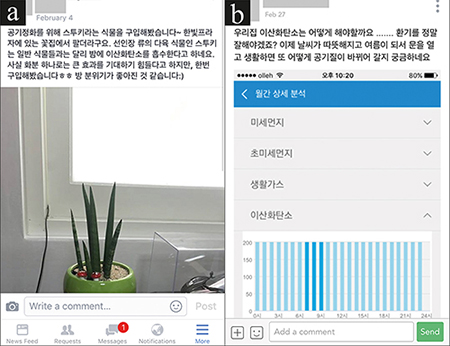
Figure 6. Group diaries posted on: (a) Facebook group and (b) Naver Band.
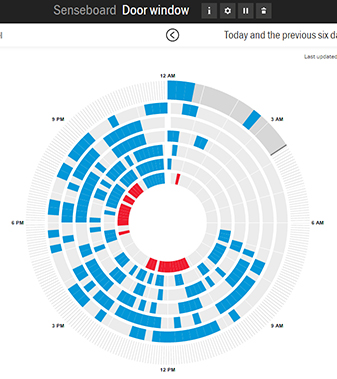
Figure 7. Usage log of windows tracked by Sen.se Cookies (P7).
Understanding the Adaptation Stages
Below we present the adaptation stages that participants went through while using the IoT air purifier for four weeks (Figure 8). The adaptation stages were low expectation, trust building, behavior change, and minimal use, with an optional stage of routinized use. When we illustrated this adaptation process, we referred to previous user studies on phases of technology acceptance, including the stage-based model of personal informatics systems (Li et al., 2010), the phases in the adoption of smartphones (Karapanos et al., 2009), the phased framework of an interactive robot (De Graaf et al., 2018), and the domestic robot ecology of Roomba (Sung et al., 2010). We mapped the stages from our study to phases of pre-adoption, adoption, adaptation, and acceptance, referred to the previous models to give a general overview of the stages, and later we compared them with those of other products. We marked perceived usefulness derived qualitatively from the diaries and interviews, and we added dark bubbles as supporting material, as shown in Figure 8.
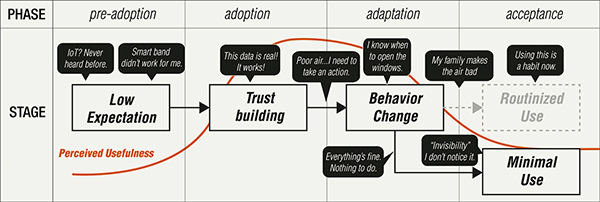
Figure 8. Adaptation stages under phases.
Stage 0. Low Expectation of IoT
Before starting the four-week study, we conducted home-visit interviews to investigate the participants’ expectations and motivation for using the IoT air purifier. Regardless of their knowledge of the IoT or digital familiarity, expectations of the IoT air purifier were low, as they lacked value perception (Accenture, 2016) and did not expect the IoT to make a real difference in their lives (Network, 2016). Most of them wanted more of the air purifying function rather than the IoT features. Participants said they participated because of an expectation for better performance and rewards.
Participants with low digital familiarity did not know what the IoT is, and their motivation to participate in this IoT-focused study was expectation of better performance of the air purifier and rewards from the study. Before the study, they purchased the product because of its air purifying performance and design: “I saw this model on television. […] First, I liked the design very much. It’s simple and modern” (P8, home-visit interview). The IoT function was not a factor that motivated them to purchase the product. Accordingly, none of the participants had ever installed an application that works with the IoT air purifier, although they had used it for more than three months. Those participants who had previously used this product without its IoT feature said they did not use the IoT feature because they experienced barriers to installing smartphone applications and because they did not know its benefits: “The registration [of application] is bothersome and I don’t know why I should use it” (P4, home-visit interview).
The participants with a high level of digital familiarity wanted to use an IoT air purifier because of its air purifying function. Their motivation to participate in this study was the reward, as we provided the IoT air purifier. They had some understanding of the IoT, but they were more interested in the air purifying functions than the IoT functions: “[I want] removing bad smells and fine dust, and purifying the air when you cannot ventilate” (P2, home-visit interview). Participants who had knowledge of other IoT products also showed a low interest in the IoT features because they had a rather negative impression of them: “Previously, I bought Xiaomi Mi Band, but the sleep pattern information did not come out well and the usability was low, so I only used it for the first day” (P3, home-visit interview). As the participants only talked about the air purifying function, we asked more about the participants’ expectations of the IoT features, and they mentioned monitoring and controlling the air purifier remotely from home: “I think it would be nice to monitor [the air quality] remotely” (P1, home-visit interview).
Stage 1. Trust Building: Data Reliability to Product Reliability
The participants could see the IAQ and OAQ information through LEDs and applications, and after using the IoT features, the participants started to realize the usefulness of monitoring air quality data after matching the data shown with how the air purifier reacted. At first, the participants were impressed witnessing the IAQ data changing due to everyday activities such as cooking and sleeping. Afterward, they monitored the air quality data, paying attention to the correlation between what was happening at home and the air quality, and soon came to trust the data shown by the air purifier’s LEDs and application: “It’s amazing that the LED color changes when I clean [the room], cook or do not ventilate” (P4, FGI). Apart from the apparent cause of poor air quality, such as not ventilating, the participants learned what makes air quality poor from the IAQ data: “I was also surprised that air pollution level is at the highest when I am sleeping at night” (P1, FGI). In the FGI sessions, P3 also said, “We have a high air pollution level when there are many people. It’s the highest [right] before going to work and after coming home.”
This reliability of the data led to a feeling of usefulness because participants then thought the IoT air purifier worked well. In other words, it was the air quality sensor, not the air purification function, that gave them the sense of such reliability for the first time, but they were satisfied with the displayed data, which seemed to be accurate. Participants considered it a good thing to monitor the air quality, even if they did not take any action according to the data: “I felt that the pollution level changes in real time, so it raised trust” (P6, FGI). In the FGI sessions, P7 mentioned, “I installed the app this time, and because it showed fine dust and various indicators, I felt it was somehow efficient. My brother-in-law also saw this and told me that he would install it.” There were even participants who prioritized the data shown in the application over their senses: “Even though I’m a little frustrated because I do not ventilate often, the air quality [shown] is always good, so I do not open the window at all with confidence” (P1, group diary).
Stage 2. Behavior Change
After getting used to monitoring air quality data, the participants who had poor IAQ attempted to improve it. The biggest motivation was that they realized their home air quality was not as good as they thought. Previously, they had no idea about IAQ, but after adopting the IoT air purifier and its IoT features, they learned how poor the air quality was. The name of this stage, behavior change, not only refers to how they used the product but also includes changes in their understanding of managing at-home air quality and habits such as opening windows for ventilation.
The participants tried to maintain good air quality at home through checking the LED indicators and the application. The biggest change was that they started to open windows more often for ventilation. They were previously aware of the importance of ventilation but did not ventilate much because they were annoyed or it was cold. After checking the air quality and seeing the ventilation alarm of the air purifier, they began to open their windows more actively than before: “Even though I was not going to open the window, once I got the ventilation alarm, I opened it a little even if it was freezing outside” (P6, group diary). P2 reported in the FGI sessions that it almost became a habit: “Something has become a habit these days. Before I go to bed at night, I open windows for 20 minutes to ventilate as fast as possible and then turn the air purifier into turbo mode for about 20 minutes. Then I close the door and sleep. I did not ventilate until I used this air purifier.” Ventilation habits of the participants changed as they began to compare IAQ and OAQ. On a day when IAQ was better because of severe fine dust outside, P3 felt that the air in the room was stuffy but still did not open the window because he trusted the data provided by the application that the OAQ was worse than the IAQ: “At that time, I just closed the windows and only used air purifiers” (P3, FGI). Other than opening the windows for ventilation, some participants found another way to maintain air quality. P2 posted in the group diary, “I looked at the CO2 graph and bought a Stuckyi pot for air purification. Stuckyi, a succulent cactus plant, absorbs carbon dioxide at night. In fact, it’s hard to expect a big change with one pot, but I just bought it.” Based on the alarms and data from the air purifier and the app, the participants were able to change their behavior and form habits to achieve the goal of maintaining good IAQ, motivated by the poor IAQ of their homes.
Stage 3-1. Routinized Use: Caring for Others
How an IoT air purifier is positioned in users’ lives is largely divided into two stages: to actively use it for other members who live together, and to forget about it. In this study, there were two participants who settled into the stage of routinized use, and they continued to interact with the IoT air purifier and its smartphone application as if using them had become a habit.
For example, P5 used the application every day to check IAQ at home and cared whether the air purifier was working fine or not. P5 shared a screen capture of the indoor gas graph on the application to the group diary, saying that suddenly the IAQ at home dropped and he assumed that his family was probably doing something at home. P5 explained more about what happened that day in the FGI sessions: “I went home that day and found my family was preparing grilled bacon. Now I get to know a little about these things. When I look at the daily graph, ‘someone came home,’ ‘someone turned on the gas stove’…I feel these things.” He behaved as if he was in charge of managing the air quality at home, and he routinely checked the application and controlled the air purifier remotely: “When I was working at the office, I thought my mom would definitely turn off the air purifier at home, so I looked at the application around at 5 [p.m.]. If it is turned off, I turn it back on” (P5, FGI). Also, P7 used the air purifier based on her schedule of cleaning the house and cooking, and she continuously monitored the air quality through the smartphone application: “I see apps occasionally when venting” (P7, FGI).
Stage 3-2. Minimal Use: Fading into the Background
This stage is the stage in which users are no longer conscious of the IoT function (i.e., data monitoring) but still depend on the original function of the product—purifying the air. The participants did not think there was any new information to learn, and they believed that the IoT air purifier would keep the air clean according to the IAQ. Their interaction with the air purifier also decreased to a minimal level or even disappeared.
Some of the participants said they stopped paying attention to the application after using it for a week or two. Their daily reports grew more similar with each day, and they looked at it only when they did something unusual: “I used it 4-5 times a day at the beginning, but now I don’t use it. The air [quality] in the house was always marked as good, so I stopped checking it from some moment. Now I look at it only when I cook” (P1, FGI). The automatic mode in the IoT air purifier is a mode in which the purifying level changes according to the IAQ. Participants P2, P3, P6, and P8 believed in this function and left it turned on: “Even if I go outside, I keep it running an automatic mode 24 hours a day” (P8, FGI). In the FGI sessions, P3 also mentioned, “Nowadays, I just leave it running.” They turned on automatic mode and let the air purifier work on its own, and they showed minimal additional use only when there was a special occasion: “I use the automatic mode the most. […] When my friends come, after cleaning, I turn on turbo mode” (P6, FGI). As such, the participants did not interact much with the air purifier; they mentioned in the FGI sessions that they had almost forgotten about the air purifier but could still say that they were satisfied with its function that automatically purifies the air according to the IAQ.
Factors Influencing Transition in Stages
The overall adaptation stages are as shown above, but upon closer inspection, the participants’ experiences differed from each other (Figure 9). After behavior change in the adaptation phase, participants were split between routinized use and minimal use in terms of how they accepted the IoT air purifier. We analyzed the factors that affected the transition between each stage. From low expectation to behavior change, user interfaces that show sensor data and receive data played an important role in the transition; from behavior change to minimal use, automation enabled by actuators helped the transition. Apart from the characteristics and components of IoT products, living situation and home environment influenced some participants to shift to routinized use rather than minimal use.
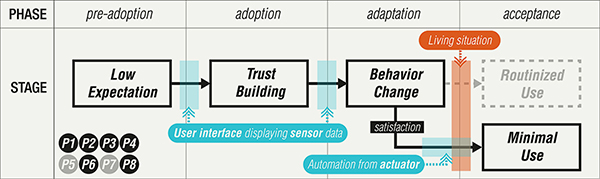
Figure 9. Difference in adaptation stages of participants and influential factors in transition.
Monitoring and Interpreting the Data
The IoT air purifier shows air quality data on the application and product surface. When using these user interfaces that display sensor data, the participants were more likely to go through trust building and behavior change depending on how well they understood what the data meant.
Data Abstraction
Air quality data is shown in color on the product surface of the IoT air purifier (Figure 2) and in numbers, labels, colors, and graphs in the smartphone application (Figure 3). The participants looked at the data to gauge how good or poor the air quality was; however, the extent to which the participants understood the air quality data varied depending on how it was represented. Abstract data representation, such as a color or label, generally conveyed the meaning successfully, except for some of the participants. In the FGI sessions, P5 mentioned, “It’s good. If the fine dust level [outside] is not good, it is yellow, and if it is good, it is green. I don’t need to read the letter, and I can understand intuitively how the outside air quality is.” P2 looked at the graph labeled poor with numbers and was worried because he did not know how serious the condition was. He understood it only after looking at air quality levels in other places: “In the morning, the air quality always changed to ‘poor’. I searched the Internet for numbers coming out and found that it was worse than the subway!” (P2, group diary). Other participants also mentioned that an analogy would help users understand the air quality data: “You know, the air of your house is the level of Daechongbong of Jiri mountain, or it is like Florida beach level” (P7, FGI). “It is a little confused because the standard of good and poor is different for each [air pollutant] graph. I would like to give a better comparison with other places” (P1, FGI). This kind of data abstraction helps users understand numerical values because users are not required to interpret the data themselves.
Understanding Cause and Effect
The IoT air purifier shows IAQ and OAQ data, especially IAQ, depending on what the user does at home. As mentioned earlier, the participants built trust when they saw the IAQ data change as a result of their behavior, and they inferred the causal relationship between behavior and IAQ. The participants were most convinced of the causal relationship when they immediately saw the data change after a change in behavior. This was observed mainly with activities such as cooking, which immediately brings about changes in air quality: “When I cook, there is a time when smoke rushes to the living room. I’m not good at cooking. When smoke reaches the living room, it just turns red and freaks out” (P6, FGI). On the other hand, if the cause could not be captured in real time, the participants were in doubt. For example, when reviewing accumulated data over a long period of time, if the participants did not remember the actual environmental changes, they did not understand why the air quality data exhibited particular numbers or patterns: “For the week and the month [graph], I don’t know. I did not doubt the data, but the cycle was long, so I was like ‘was it?’ Day [graph] seems to be trustworthy because I remember well. Also, there is no big difference in life, but the graph goes up and down, so I have a question about why” (P3, FGI). In addition, the air quality data is indicative of the current state, in other words, the result, which is only guessed by the users. Therefore, if there are many factors that are likely to be the cause, participants were confused because the IoT air purifier does not tell the answer: “The uncertainty when using the app is that I have no idea whether it is the air purifier that cleaned the air or it is other factor like my behavior, such as opening the window” (P2, FGI). Having a good understanding of the causes of changing air quality affected trust building and behavior change.
Dealing with Data
Once users understand what the current IAQ and OAQ are, the question is what to do. Even though users understand how serious the current air quality is and whether they should take action immediately or not, how to deal with the situation is left to them. Of course, bad indoor air will be purified by the air purifier, but participants were concerned when the IAQ went bad and wanted to solve the problem. There is a ventilation indicator on the air purifier that conveys action instructions to the user. It displays a light to tell users to open the windows when the OAQ is better than the IAQ to a certain extent. If this kind of guidance helped solve the problem, the usage habit was formed easily: “[I like] showing the outside air quality I did not know, and I like it the most that [it] tells me when to vent while I don’t pay attention” (P6, FGI). However, this was not always successful, as P2 had poor IAQ, but he did not know how to solve the problem until he searched a way to improve the air quality and changed his behavior: “I get poor [air quality] every day, but I do not really know how to improve it” (P2, group diary). Some participants also wanted the IoT air purifier to provide a concrete way to respond to the air quality data: “[I want] recommendation. There is no flowerpot in this house and the air is dry like a barren desert, so there should be a humidifier. It should be place in this position to spread moisture. Something like this” (P6, FGI). Users who understood how to deal with the given data could easily move on to behavior change.
Different Living Situation and Automation from Actuators
Unlike personal IoT devices such as activity trackers, IoT air purifiers are designed to be used at home to manage the home environment. Hence, because the purpose is to maintain good air quality at home, the participants seemed to pay more attention to caring for others who lived with them. If there were more people living in the house there were a lot of changes in the air quality, thus, the participants constantly interacted with the air purifier and tried to keep the IAQ good. On the other hand, as time went by, if the IAQ stayed good, managing the air quality became a bothersome but negligible chore. We observed that the participants who trusted the automation of the air purifier left it to work on its own, and seldom interacted with it. In terms of managing the home environment, the difference in living situation and air quality condition influenced the stage transitions of the participants. In the last phase, acceptance, the two stages (routinized use and minimal use) were, in other words, strategies chosen by the participants in different home environments with the help of automation from actuators. In both stages, we also observed growing needs for IoT products at home.
Actively Caring for the Other Members at Home
The participants were people who were interested in maintaining good air quality in their homes. Whether they were living alone, living with their family, or living with friends, every participant was one or the only person who cared about air quality management at home: “There are three in my family and I use [the air purifier] mainly. My husband and son do not know about this at all” (P8, FGI). Among the participants whose home IAQ continued to deteriorate due to the activities of the people living with them, they tended to move on to routinized use.
P5, who started to actively manage the air quality after using the IoT air purifier, continued to use the application to care for other family members. The IAQ at his home changed dramatically depending on the activities of his family members, and he felt responsible for keeping the air clean. P5 posted several times about the IAQ, and P6 mentioned P5’s IAQ in the FGI sessions: “Comparing to my home, I think the difference comes from the number of people. On weekdays or weekends, I saw the air changing a lot by activities.” Because the other family members did not care about the IAQ, P5 kept paying attention to the IAQ using the air purifier and its application every day and quickly moved on to routinized use.
P7, who lived with six family members, also felt that she was in charge of keeping the air clean at home. However, P7 differed from P5 in that she already had a ventilation habit before using the IoT air purifier, but she still experienced a transition to routinized use. In the FGI sessions, P7 mentioned, “Because the kids eat and spill a lot, I usually ventilate frequently and open the window for more than 30 minutes. So far, I got ventilation notification only twice. It was only when I was cooking and when the kids ran out, and there was a lot of fine dust at home.” She also mentioned that she interacted with the IoT air purifier by turning it off when cleaning the home and turning on turbo mode after cooking. In Figure 10, which shows the dates and times of using the IoT air purifier, window, and vacuum cleaner in the home of P7, we found a pattern of opening the window, turning on the vacuum cleaner, and operating the air purifier around 10:30 A.M. to 11:30 A.M. Regarding the log of using the air purifier dozens or even hundreds of times, P7 explained, “Kids were turning it on and off to play with it.” Her habits did not significantly change, in her words, from before she had the air purifier because she was already taking care of the family by opening the windows and cleaning the house, and she quickly settled into routinized use because she routinely used the turbo mode after preparing dinner.
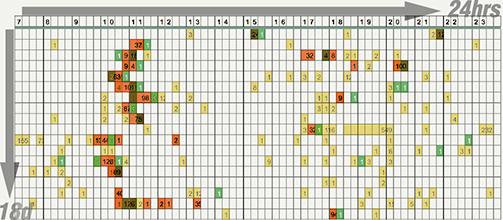
Figure 10. Usage log of the IoT air purifier (yellow), windows (orange), and vacuum cleaner (green) on a timeline (P7).
Letting IoT Manage Air Quality on Its Own
Although some of the participants moved on to routinized use, there were participants who lost interest and subsequently had little or no interaction with the IoT air purifier. In the initial stages, the participants checked air quality data and learned what affects air quality and formed a habit to maintain good air quality. They did not experience frequent air pollution caused by other family members, and because of the habitual behavior they had formed, they were able to maintain good air quality without being aware of it. Unlike householders who developed and retained a habit of checking the IAQ every day (Kim et al., 2013), because of good habits and the performance of the air purifier, the air quality remained good, so, some of the participants did not feel the need to pay attention to it and almost stopped interacting with the air purifier. They came to learn that they did not have to take any additional action to maintain the status quo, so they chose to forget about air quality management at home rather than consciously managing the air quality and operating the relevant functions of the air purifier.
Expecting More IoT at Home
In routinized use and minimal use, the participants reported that they were satisfied with the IoT air purifier. However, some of the participants asked for a higher level of automation from the IoT at home, going further than letting the air purifier run on automatic mode. They suggested a scenario in which not only air purifiers but also other things in the house were interconnected and operated together without user intervention:
It will be convenient if the air purifier recognizes brightness of surroundings and automatically switch the silent mode when it’s dark. Or, if it is connected to the mattress, it can sense my movement on the mattress to recognize whether I’m sleeping or not, and turn on silent mode. (P2, FGI)
There are times when I feel the limit of using this product alone. I wish there were things that could work with other things. If there is no one but kids in the house and the ventilation alarm is turned on, you can activate the…let’s say Smart Window without having to tell the kids to vent. (P5, FGI)
Likewise, a simple automation in the air purifier triggered greater expectation of making the user’s home more connected. The participants wanted to maintain good air quality at home, but it was implied that the “person” who actually manages the domestic environment does not have to be the user but rather the home IoT products. Regardless of their satisfaction with the product, reducing the burden of housework, air quality management in this study, was desired. This expectation is in line with context-awareness studies that predicted situations through surrounding data (Dourish, 2004, 2009).
Discussion and Design Implications
In this study, we aimed to understand users’ adaptation to use of an IoT air purifier. Its characteristics as an IoT device (sensor, communication, and actuator) and its at-home use had a major impact on the adaptation process. We derived several design implications for IoT devices at home, based on the IoT adaptation process and what influenced participants’ transitions.
Data-driven Adaptation in IoT at Home
Users’ adaptation to a new technology or design has various definitions. For example, it is an appropriation as continuous, progressive, and mutual adjustments, accommodations, and improvisations (Orlikowski, 1996), the cognitive and behavioral efforts performed by users to cope with significant information technology events (Beaudry & Pinsonneault, 2005), and processes whereby the user assigns meaning and significance to the artifact, and how this is experienced (Silverstone & Haddon, 1996). In this study, we chose an IoT air purifier as a target product, and we examined the adaptation process that indicates how users understand its role in their home and how they accept it in their everyday lives. When describing IoT, it is depicted as data from sensors.”Things are connected to the Internet, each embedded with sensors (Minerva, Biru, & Rotondi, 2015), share (Yachir, Amirat, Chibani, & Badache, 2016), and generate, exchange, and consume data (Rose et al., 2015). In this study, the user adaptation process was affected by the IoT features of the air purifier that displays data from sensors and the Internet to the user and adjusts the air purification level according to the sensed data. As mentioned earlier in the study design, the adaptation period was shorter than we expected. Perhaps this was because this IoT air purifier was not disruptive enough compared to IT advances studied in the past (De Graaf et al., 2018; Karapanos et al., 2009; Lazarus & Folkman, 1984), as users had more familiarity and fewer learnability issues. Still, the adaptation time was short compared to other adaptation patterns from a similarly less disruptive product, such as two months until the beginning of habituation (Montalván et al., 2017) for the robotic vacuum cleaner. This could be partially due to the fact that the air purifier does not stand out as much as a robotic vacuum cleaner because it has less physical movement, but we determined that this is because the IoT air purifier gained users’ trust earlier as it automatically purifies air pollution according to the IAQ. In addition to the fact that users had low expectations of IoT features, whereas the robotic vacuum cleaner users had high expectations due to it being called a robot. The sensor data shown by the IoT air purifier and the actuator that operates according to the data were well combined and successfully made users believe that they could leave the air quality managing task to the air purifier. In a DIY smart home product usage cycle, users identify problems (motivation), install sensors and actuators and program the rules (implementation), try them in their daily routines (use-through-routine), continue using them (routinization), and remove them unless useful (removal) (Woo & Lim, 2015). However, the IoT air purifier users in this study did not have enough passion or knowledge to go for DIY, so they attempted to solve the identified problems through the IoT air purifier home appliance that combined sensors, actuators, and rules. In the process of being incorporated into the users’ lives, the air purifier did not require users’ active intervention to modify its implementation but rather changed the users’ perception and behavior toward domestic air quality. Accordingly, the stages users went through differed from the case of a DIY smart home product.
The characteristics of user experience shown in trust building to behavior change are similar to those seen in sustainable HCI (Blevis & Eli, 2007) and personal informatics (Li et al., 2010). Because both research fields show the home environment data or user activity log, they share similar patterns coming from displaying the data from sensors. In the early stages, for example, users check the accuracy of data when using fitness tracking devices (Yang, Shin, Newman, & Ackerman, 2015), and users modify their behavior according to the environmental data or personal activity data (Kim & Paulos, 2010; Li et al., 2010). Thus, there are some hints from previous studies, such as raising awareness of the consequence of users’ behavior on energy consumption by providing detailed patterns of electricity use (Riche et al., 2010) or inducing pro-environmental behavior change by giving users feedback, comparison, etc. (Froehlich, Findlater, & Landay, 2010). The display of data plays a crucial role in the early adaptation stages, but use of the IoT air purifier in the later stage was different to those research fields mentioned above because the IoT air purifier has actuators that are activated by air quality data from sensors, and it can work by itself to keep the air clean without the users’ intervention.
In the later stage, minimal use, of adaptation in this study, the participants depended heavily on the actuator part of the air purifier by accumulating enough trust in the IoT air purifier through monitoring the data for a period of time, after which they had decided that it was fine to leave air quality management to the air purifier and to stop caring about it. Unlike a quantified selfer who does not find use unless he or she reviews recorded data (Gulotta, Forlizzi, Yang, & Newman, 2016; Schwanda & Ibara, 2011), stopping data monitoring in the at-home IoT experience is not an abandonment but rather acceptance of the IoT as part of everyday life. Unlike abandonment in conventional product use cycles, this is not a result of being tired of the product or the feeling of being substituted but rather a phenomenon that happens because the data has already changed user behavior enough to allow the IoT air purifier take the role of managing air quality at home. It is also different from routinized use because although the IoT air purifier became a part of the participants’ everyday life, it was more like leaving the product working in the background except for minimal interaction on special occasions. According to the Coping Model of User Adaptation (CMUA), if users feel that they have control, they maximize benefits from the new information technology (Beaudry & Pinsonneault, 2005), which is what happened to the participants in the acceptance phase in this study. However, the participants in the minimal use stage had a different strategy in that they did not want to put in effort to achieve benefits. The difference came from the IoT features of the air purifier that gained the participants’ trust, changed their behavior, and enabled automation. In the design of Calm technology, information is placed in the periphery so that users do not have to pay attention to it; it moves to the center of their attention when needed and then back to the periphery (Weiser & Brown, 1996). Without increasing information overload, users can be attuned to more information around them. Regarding Calm technology, concerns such as balancing between control and simplicity have been raised (Weiser, Gold, & Brown, 1999), and an alternative agenda of engaging users more actively when designing UbiComp technologies was proposed (Rogers, 2006). However, we discovered the need and the possibility for the IoT air purifier to be “calm” from the user experience as observed in minimal use. The participants felt burdened by constantly paying attention to the air quality, which did not change much, and the IoT air purifier had the ability to manage it instead so that the participants could intervene only when needed. During this process, various information related to air quality enhanced the participants’ periphery reach. Considering the characteristics of using IoT devices for managing the home environment, we propose the following ways to enhance the user experience.
Hooking into the Early Stage with Data
In the early stage of using a new technology for the first time, it is important to understand what experience users have when engaging with it and which factors induce transition to the next stage. Looking at the early stages of the adaptation process in other products, smartphone users experience novel features and learnability issues and its beneficialness is indicated by ease of use (Karapanos et al., 2009). Robot vacuum cleaner users assess compatibility with their home environment to confirm its usefulness (Sung et al., 2010). Conversational agent users examined intelligence and capability by testing random commands (Cho, Lee, & Lee, 2019; Luger & Sellen, 2016). In the case of the IoT air purifier, users realized its usefulness after matching the air quality data shown and their situation. They did not check whether the air purifier successfully improved IAQ or not, of course it might be difficult to sense such, but judged the product based on the data. To attract users’ interest and gain trust when using an IoT device for the domestic environment, the users should witness that the data is consistent with how the domestic environment actually happened as early as possible. This is a coincidental event, and designers can intentionally cause these events to occur, helping to build trust early. Therefore, to feel such a link from the start of using IoT products, it is necessary to display the data change in any effective form (Froehlich et al., 2012; Kuznetsov & Paulos, 2010) and to deliver it more actively to the user through an alarm at the initial stage.
Apart from technologically increasing data accuracy, it’s directly pertinent to consider increasing data reliability to show what caused the changes in data. In this study, the participants tried to understand the causal relationship between their behavior and the data displayed. Similarly, in past studies, participants tried to trace the cause of changes in the air quality data (Kim et al., 2013) and examined the data after their activities at home expecting to see according changes in the data (Paulos, 2009). However, if users do not remember the actual situation that caused the changes in data, because the IoT device does not inform them as to why the data changed, it is difficult for the users to guess why such changes happened, thereby losing the opportunity for the users to understand the data and to build trust. Because there were several possible factors that may have caused changes in the the air quality, some of the participants in this study had difficulty understanding the causal relationship and some did not understand why their past data graph appeared as it did. Hence, regardless of the actual accuracy of the data, there is even a risk of losing trust if the data is considered incompatible with the actual situation (Yang et al., 2015). Therefore, even if the context of the change in the data at the time cannot be fully understood, it is necessary to provide a possible cause to help the user grasp the actual situation that matches the data. Accordingly, particularly in the initial stage, designers can advance the encounter by notifying users of possible events rather than waiting for the users to check the data and discover its reliability. Regarding IoT air purifiers, providing the cause of the air pollution and witnessing the improvement in the air quality after purification will build trust in the data and performance thereof. Further, this will also show users that their purchase of an IoT air purifier device was the right decision (Coskun, Kaner, & Bostan, 2018).
Facilitating Behavior Change by Data Communication
The adaptation step is represented by the behavior change stage. The participants had the motivation to make their home environment better for the health of themselves and their families. They changed their behavior after understanding the state of the environment at a given time, which worked as a stimulus. The in-home environmental conditions, which were difficult to measure by human sensory abilities, required monitoring the data provided by the air purifier, and the method of data representation played an important role in understanding the data, i.e., the data was delivered in a form that was understandable to the user and motivated action (Patel, Asch, & Volpp, 2015), verifying that. expressing the data at any given time simply as numbers (Foster, Lawson, Wardman, Blythe, & Linehan, 2012) or good–poor labels does not provide enough criteria for users. Of course, color-coded air quality data or good–poor labels worked for some of the participants, but others were confused as to its meaning; they had difficulty understanding how good it was and whether they could just relax or needed to take action. As supporting material for better communication, analogies can be used to enable users to gauge the experience. For example, when monitoring energy consumption, users favored explanatory comparisons, such as electricity use as a number of laptops (Petkov, Köbler, Foth, & Krcmar, 2011). In our study, it is implied that explanatory comparison by place, such as a subway or Florida beach, would help them to understand the current air quality at home. This is different from visualizing the data, but it helps users to understand intuitively how good the current air is by giving them analogies to places where they already know the cleanliness of the air.
The More Connected, the More Accepted
The stage in which the user adapts and accepts the product as part of their life becomes the basis for further development (Hirsch & Silverstone, 2003). Nearing the end of the adaptation, the IoT air purifier at home eventually faded into the background in minimal use and is incorporated into daily routine in routinized use. Unlike personal informatics, which is concerned with long-term engagement and abandonment (Gulotta et al., 2016; Schwanda & Ibara, 2011), the IoT air purifier at home has potential to provide a better user experience during the phase of acceptance.
A possible direction is to make the IoT air purifier more connected at home and replace the domestic environment management task to reduce the burden and effort of the user to lead to even further acceptance. This was implied by the participants’ strategy of letting the IoT air purifier manage the home environment instead of them and was suggested by some participants’ expected scenario of connecting objects at home through the IoT. From this, designers can imagine what kind of products will be connected with each other and draw possible use scenarios by observing the current usage pattern and getting a hint from it (Crabtree & Tolmie, 2016). In our study, as observed from P7’s Sen.se log, other air-related products, such as a vacuum cleaner, could be considered as additional IoT devices to be connected at home because of the related use and high predictability of such products. Also, enabling the IoT devices to manage the home environment could help the users when deciding what actions to take based on the information provided. For example, as P5 suggested, rather than making users interpret the data and open windows, enabling the windows to open automatically when the OAQ is better than the IAQ will free users from caring about the air quality and recede to minimized interaction with the IoT air purifier.
In this study we substantiated that users want IoT devices to replace bothersome work for them but did not want to put additional effort into the process to achieve it (Wilson, Shah, & Whipple, 2015). There are many studies claiming that smart homes need to be customizable by end users (Hwang & Hoey, 2012), but users want more control over their lives than control over the device (Davidoff, Lee, Yiu, Zimmerman, & Dey, 2006), and that the users must be proactive in creating and using DIY products for customization (Woo & Lim, 2015). In our study, the participants in the minimal use stage were not very enthusiastic about controlling the product. The autonomy of the IoT air purifier fits the above criteria from previous studies, and autonomy has already been been found to be the most desired feature for smart household appliances (Coskun et al., 2018). Users can benefit from having autonomy by having peace of mind and more time and effort to devote to other important activities, which can be maximized when IoT products are connected to each other to work on their own. Interactive Intentional Programming (IIP), a domain model, suggests how this connected autonomy would achieve actuation of users’ intention under a certain scenario (Funk et al., 2018), whereby the user’s intention to maintain a healthy domestic environment can be realized with various actuations depending on sensing data and scenario or given context. For example, depending on the IAQ and OAQ, a connected IoT air purifier can maintain a healthy domestic air quality to meet the users’ intention—the scenario of cooking would make the windows open, the gas stove hood would turn on, and the air purifier would run in turbo mode. In other words, users should be able to enjoy the benefit of using connected IoT products while minimizing user intervention.
Actively Stimulating Exploration
As observed in the routinized use stage, there are times when users need to be aware of the IoT air purifier. The participants used air quality graphs as a basis for inferring what was happening at home, especially the behavior of other family members or friends they live with. They also responded to changes in the air quality caused by others living together at home. Also, as observed in personal informatics, long-term behavioral change is not simply accomplished at the time of achieving the goal but changes considerably over time (Gulotta et al., 2016). To be prepared, IoT devices at home can expose their existence and alert users’ attention to them.
The minimal use stage can be seen as a state of being stuck without new explorations. However, if the environment at home changes, another exploration might be required. For example, if a user’s social dynamics change, such as after getting married or giving birth, social engagement with cohabitants can influence his or her motivation to use IoT features. If the living situation changes, there will be a need for more engagement with the IoT products. The home environment could also change due to a friend’s visit or house repairs. Such changes can give users who have forgotten about the air purifier a chance to explore new opportunities. At this time, IoT devices in general can expose their presence to the users and suggest an adjusted way of using them to give an impression of usefulness and to promote additional behavior change if needed.
Limitations
Our study aimed to illustrate patterns of users’ adaptation to use of IoT products at home, but it is limited in that we only focused on one IoT target product, which is related to the home environment and occupants’ health; different target products could result in different adaptation stages because, according to their purpose, other conditions and dynamics would impact engagement with the product. In terms of the participants, they were all Korean, so cultural differences might bias the results. In addition, the participants had low motivation to use an IoT product in the beginning but were interested in using an air purifier at home, so this might have influenced their acceptance. However, considering that IoT air purifiers are purchased and used despite the low expectations of the IoT that users have, there will be more users who are not familiar with the IoT and have low expectations of it as IoT features are added to conventional products. In other words, it will be meaningful to see adaptation of users with low expectations. Another limitation of this study is that we chose group diaries and interviews as the study method. If we had used a less obtrusive method, perhaps we could have observed acceptance earlier.
Conclusions
We present stages of adaptation to an IoT air purifier by nonexpert users, drawing from a four-week qualitative study including home-visit interviews, group diaries, and FGI sessions involving eight participants. From the first stage of showing low expectations to the final stage of the product fading into the background of everyday life, the adaptation stages help us understand the way people perceive and accept an IoT product. By understanding the adaptation, designers can leverage the user experience at each stage, and examine the factors influential to the transition stages to give room for designing products with the new IoT technology that are more acceptable to the user. The data monitoring function, which influenced the early part of the adaptation stages, can be improved by design in the short term. Enhancing the experience of the last stage, which takes up the longest time when using IoT products, could be achieved during this time through development and integration of technologies to expand the connectivity of the IoT at home and adapt to users’ intentions and changing environmental conditions. For this, designers can get inspiration from the adaptation process users experience along with their usage patterns and discover where, for what reason, and in what ways the IoT should be present in the users’ daily lives. The IoT is still in the development stage, and a perfected IoT scenario has not been implemented yet. We hope that our findings will contribute to more user-centered IoT development and enhance the perceived value of IoT devices (Accenture, 2016).
Acknowledgments
This work was supported in part by Coway. We thank Coway for providing the air purifiers without imposing any condition on the study design and helping us to recruit the participants with rewards; and the review board for their insightful and constructive comments.
References
- Accenture. (2016). 2016 Accenture digital consumer survey. Retrieved from https://www.accenture.com/_acnmedia/PDF-3/Accenture-Igniting-Growth-in-Consumer-Technology.pdf
- Air purifier market balloons to 1 tril. Won. (2016, April 25). The Korea economic daily. Retrieved from http://english.hankyung.com/it/2016/04/25/0743371/air-purifier-market-balloons-to-1-tril-won
- Ashton, K. (2011). That “Internet of things” thing. RFID Journal, 22(7). Retrieved from https://www.rfidjournal.com/articles/pdf?4986
- Atzori, L., Iera, A., & Morabito, G. (2010). The Internet of things: A survey. Computer Networks, 54(15), 2787-2805. https://doi.org/10.1016/j.comnet.2010.05.010
- Beaudry, A., & Pinsonneault, A. (2005). Understanding user responses to information technology: A coping model of user adaptation. MIS Quarterly, 29(3), 493-524.
- Ben Allouch, S., van Dijk, J. A. G. M., & Peters, O. (2009). The acceptance of domestic ambient intelligence appliances by prospective users. In Proceedings of of the Conference on Pervasive Computing (pp. 77-94). Berlin, Germany: Springer. https://doi.org/10.1007/978-3-642-01516-8_7
- Blevis, E., & Eli. (2007). Sustainable interaction design. In Proceedings of the SIGCHI Conference on Human Factors in Computing Systems (pp. 503-512). New York, NY: ACM. https://doi.org/10.1145/1240624.1240705
- Brown, E. (2016, September 13). Who needs the Internet of things? Linux.Com. Retrieved from https://www.linux.com/news/who-needs-internet-things
- Brush, A. J. B., Lee, B., Mahajan, R., Agarwal, S., Saroiu, S., & Dixon, C. (2011). Home automation in the wild. In Proceedings of the SIGCHI Conference on Human factors in Computing Systems (pp. 2115-2124). New York, NY: ACM. https://doi.org/10.1145/1978942.1979249
- Carlson, D., Mogerle, M., Pagel, M., Verma, S., & Rosenblum, D. S. (2015). Ambient flow: A visual approach for remixing the Internet of things. In Proceedings of the 5th International Conference on the Internet of Things (pp. 114-121). New York, NY: IEEE. https://doi.org/10.1109/IOT.2015.7356555
- Cho, M., Lee, S., & Lee, K.-P. (2019). Once a kind friend is now a thing. In Proceedings of the Conference on Designing Interactive Systems (pp. 1557-1569). New York, NY: ACM. https://doi.org/10.1145/3322276.3322332
- Columbus, L. (2018, August 16). IoT market predicted to double by 2021, reaching $520B. Forbes. Retrieved from https://www.forbes.com/sites/louiscolumbus/2018/08/16/iot-market-predicted-to-double-by-2021-reaching-520b/#4f000f091f94
- Consolvo, S., Libby, R., Smith, I., Landay, J. A., McDonald, D. W., Toscos, T., … LeGrand, L. (2008). Activity sensing in the wild: A field trial of ubifit garden. In Proceeding of the SIGCHI Conference on Human Factors in Computing Systems (p. 1797-1806). New York, NY: ACM. https://doi.org/10.1145/1357054.1357335
- Cook, D. J., Youngblood, M., Heierman, E. O., Gopalratnam, K., Rao, S., Litvin, A., & Khawaja, F. (n.d.). MavHome: An agent-based smart home. In Proceedings of the 1st IEEE International Conference on Pervasive Computing and Communications (pp. 521-524). New York, NY: IEEE. https://doi.org/10.1109/PERCOM.2003.1192783
- Coskun, A., Kaner, G., & Bostan, İ. (2018). Is smart home a necessity or a fantasy for the mainstream user? A study on users’ expectations of smart household appliances. International Journal of Design, 12(1), 7-20.
- Costanza, E., Fischer, J. E., Colley, J. A., Rodden, T., Ramchurn, S. D., & Jennings, N. R. (2014). Doing the laundry with agents. In Proceedings of the SIGCHI Conference on Human Factors in Computing Systems (pp. 813-822). New York, NY: ACM. https://doi.org/10.1145/2556288.2557167
- Crabtree, A., & Tolmie, P. (2016). A day in the life of things in the home. In Proceedings of the 19th Conference on Computer-Supported Cooperative Work & Social Computing (pp. 1736-1748). New York, NY: ACM. https://doi.org/10.1145/2818048.2819954
- Davidoff, S., Lee, M. K., Yiu, C., Zimmerman, J., & Dey, A. K. (2006). Principles of smart home control. In Proceedings of the International Conference on Ubiquitous Computing (pp. 19-34). Berlin, Germany: Springer. https://doi.org/10.1007/11853565_2
- Davis, F. D., Bagozzi, R. P., & Warshaw, P. R. (1989). User acceptance of computer technology: A comparison of two theoretical models. Management Science, 35(8), 982-1003. https://doi.org/10.1287/mnsc.35.8.982
- De Graaf, M. M., Ben Allouch, S., & van Dijk, J. A. (2018). A phased framework for long-term user acceptance of interactive technology in domestic environments. New Media & Society, 20(7), 2582-2603. https://doi.org/10.1177/1461444817727264
- De Silva, L. C., Morikawa, C., & Petra, I. M. (2012). State of the art of smart homes. Engineering Applications of Artificial Intelligence, 25(7), 1313-1321. https://doi.org/10.1016/J.ENGAPPAI.2012.05.002
- Dourish, P. (2004). What we talk about when we talk about context. Personal and Ubiquitous Computing, 8(1), 19-30. https://doi.org/10.1007/s00779-003-0253-8
- Dourish, P. (2009). Seeking a foundation for context-aware computing. Human-Computer Interaction, 16(2-4), 229-241.
- Fogg, B. J. (2002). Persuasive technology: Using computers to change what we think and do. Ubiquity, 2002(December), Article No. 5. https://doi.org/10.1145/764008.763957
- Foster, D., Lawson, S., Wardman, J., Blythe, M., & Linehan, C. (2012). ‘Watts in it for me?’ Design implications for implementing effective energy interventions in organisations. In Proceedings of the SIGCHI Conference on Human Factors in Computing Systems (p. 2357-2366). New York, NY: ACM. https://doi.org/10.1145/2207676.2208396
- Fritz, T., Huang, E. M., Murphy, G. C., & Zimmermann, T. (2014). Persuasive technology in the real world: A study of long-term use of activity sensing devices for fitness. In Proceedings of the SIGCHI Conference on Human Factors in Computing Systems (pp. 487-496). New York, NY: ACM. https://doi.org/10.1145/2556288.2557383
- Froehlich, J., Findlater, L., & Landay, J. (2010). The design of eco-feedback technology. In Proceedings of the SIGCHI Conference on Human Factors in Computing Systems (pp. 1999-2008). New York, NY: ACM. https://doi.org/10.1145/1753326.1753629
- Froehlich, J., Patel, S., Landay, J. A., Findlater, L., Ostergren, M., Ramanathan, S., … Bai, M. (2012). The design and evaluation of prototype eco-feedback displays for fixture-level water usage data. In Proceedings of the SIGCHI Conference on Human Factors in Computing Systems (pp. 2367-2376). New York, NY: ACM. https://doi.org/10.1145/2207676.2208397
- Funk, M., Chen, L. -L., Yang, S. -W., & Chen, Y. -K. (2018). Addressing the need to capture scenarios, intentions and preferences: Interactive intentional programming in the smart home. International Journal of Design, 12(1), 53-66.
- Ghajargar, M., Wiberg, M., & Stolterman, E. (2018). Designing IoT systems that support reflective thinking: A relational approach. International Journal of Design, 12(1), 21-35.
- Gubbi, J., Buyya, R., Marusic, S., & Palaniswami, M. (2013). Internet of things (IoT): A vision, architectural elements, and future directions. Future Generation Computer Systems, 29(7), 1645-1660. https://doi.org/10.1016/j.future.2013.01.010
- Guest, G., Bunce, A., & Johnson, L. (2006). How many interviews are enough ? An experiment with data saturation and variability. Family Health International, 18(1), 59-82. https://doi.org/10.1177/1525822X05279903
- Gulotta, R., Forlizzi, J., Yang, R., & Newman, M. W. (2016). Fostering engagement with personal informatics systems. In Proceedings of the ACM Conference on Designing Interactive Systems (pp. 286-300). New York, NY: ACM. https://doi.org/10.1145/2901790.2901803
- Hirsch, E., & Silverstone, R. (2003). Consuming technologies: Media and information in domestic spaces. Lodon, UK: Routledge.
- Hsu, A., & Zomer, A. (2016). Environmental performance index. Wiley statsfef: Statistics reference online (pp. 1-5). Chichester, UK: John Wiley & Sons. https://doi.org/10.1002/9781118445112.stat03789.pub2
- Hwang, A., & Hoey, J. (2012). Smart home, the next generation: Closing the gap between users and technology. 2012 AAAI Fall Symposium Series. Retrieved from https://www.aaai.org/ocs/index.php/FSS/FSS12/paper/viewPaper/5549
- Hwang, A., Truong, K., & Mihailidis, A. (2012). Using participatory design to determine the needs of informal caregivers for smart home user interfaces. In Proceedings of the 6th International Conference on Pervasive Computing Technologies for Healthcare. New York, NY: IEEE. https://doi.org/10.4108/icst.pervasivehealth.2012.248671
- Jia, H., Wu, M., Jung, E., Shapiro, A., & Sundar, S. S. (2012). Balancing human agency and object agency. In Proceedings of the Conference on Ubiquitous Computing (pp. 1185-1188). New York, NY: ACM. https://doi.org/10.1145/2370216.2370470
- Jung, J., Nam, H., Lim, Y., & Lee, K. (2017). Beauty and the beast. In Proceedings of the ACM Conference Companion Publication on Designing Interactive Systems (pp. 61-66). New York, NY: ACM. https://doi.org/10.1145/3064857.3079120
- Karapanos, E., Zimmerman, J., Forlizzi, J., & Martens, J. -B. (2009). User experience over time: An initial framework. In Proceedings of the SIGCHI Conference on Human Factors in Computing Systems (pp. 729-738). New York, NY: ACM. https://doi.org/10.1145/1518701.1518814
- Kim, S., & Paulos, E. (2009). InAir: Measuring and visualizing indoor air quality. In Proceedings of the 11th International Conference on Ubiquitous Computing (pp. 81-84). New York, NY: ACM. https://doi.org/10.1145/1620545.1620557
- Kim, S., & Paulos, E. (2010). InAir: Sharing indoor air quality measurements and visualizations. In Proceedings of the SIGCHI Conference on Human Factors in Computing Systems (pp. 1861-1870). New York, NY: ACM. https://doi.org/10.1145/1753326.1753605
- Kim, S., Paulos, E., & Mankoff, J. (2013). InAir: A longitudinal study of indoor air quality measurements and visualizations. In Proceedings of the SIGCHI Conference on Human Factors in Computing Systems (pp. 2745-2754). New York, NY: ACM. https://doi.org/10.1145/2470654.2481380
- Koreshoff, T. L., Robertson, T., & Leong, T. W. (2013). Internet of things. In Proceedings of the 25th Australian Computer-Human Interaction Conference on Augmentation, Application, Innovation, Collaboration (pp. 335-344). New York, NY: ACM. https://doi.org/10.1145/2541016.2541048
- Kubitza, T., Voit, A., Weber, D., & Schmidt, A. (2016). An IoT infrastructure for ubiquitous notifications in intelligent living environments. In Proceedings of the ACM International Joint Conference on Pervasive and Ubiquitous Computing (Adjunct, pp. 1536-1541). New York, NY: ACM. https://doi.org/10.1145/2968219.2968545
- Kuznetsov, S., & Paulos, E. (2010). UpStream: Motivating water conservation with low-cost water flow sensing and persuasive displays. In Proceedings of the SIGCHI Conference on Human Factors in Computing Systems (pp. 1851-1860). New York, NY: ACM. https://doi.org/10.1145/1753326.1753604
- Lazarus, R. S., & Folkman, S. (1984). Coping and adaptation. In W. D. Gentry (Ed.), The handbook of behavioral medicine (pp. 282-325). New York, NY: Guilford. https://doi.org/10.1016/S0002-7138(09)61635-6
- Li, I., Dey, A., & Forlizzi, J. (2010). A stage-based model of personal informatics systems. In Proceedings of the SIGCHI Conference on Human Factors in Computing Systems (pp. 557-566). New York, NY: ACM. https://doi.org/10.1145/1753326.1753409
- Lin, J. J., Mamykina, L., Lindtner, S., Delajoux, G., & Strub, H. B. (2006). Fish’n’Steps: Encouraging physical activity with an interactive computer game. In Proceedings of the 8th Conference on Ubiquitous Computing (pp. 261-278). Berlin, Germany: Springer-Verlag. https://doi.org/10.1007/11853565_16
- Luger, E., & Sellen, A. (2016). “Like having a really bad PA”: The gulf between user expectation and experience of conversational agents. In Proceedings of the SIGCHI Conference on Human Factors in Computing Systems (pp. 5286-5297). New York, NY: ACM. https://doi.org/10.1145/2858036.2858288
- Martindale, S., Bedwell, B., Phillips, R., & Pedros, M. (2017). “Proof in the pudding”: Designing IoT plants for wellbeing. In Proceedings of the Conference on Designing Interactive Systems (pp. 529-540). New York, NY: ACM.
- Mennicken, S., & Huang, E. M. (2012). Hacking the natural habitat: An in-the-wild study of smart homes, their development, and the people who live in them. In Proceedings of the International Conference on Pervasive Computing (pp. 143-160). Berlin, Germany: Springer. https://doi.org/10.1007/978-3-642-31205-2_10
- Mennicken, S., Vermeulen, J., & Huang, E. M. (2014). From today’s augmented houses to tomorrow’s smart homes. In Proceedings of the ACM International Joint Conference on Pervasive and Ubiquitous Computing (pp. 105-115). New York, NY: ACM. https://doi.org/10.1145/2632048.2636076
- Minerva, R., Biru, A., & Rotondi, D. (2015). Towards a definition of the Internet of things (IoT). IEEE Internet Initiative, 1, 1-86.
- Montalván, J., Shin, H., Cuéllar, F., & Lee, K. (2017). Adaptation profiles in first-time robot users: Towards understanding adaptation patterns and their implications for design. International Journal of Design, 11(1), 1-19.
- Moore, G. A. (1991). Crossing the chasm: Marketing and selling high-tech products to mainstream customers. New York, NY: HarperBusiness.
- Mora, S., Gianni, F., & Divitini, M. (2017). Tiles: A card-based ideation toolkit for the Internet of things. In Proceedings of the Conference on Designing Interactive Systems (pp. 587-598). New York, NY: ACM. https://doi.org/10.1145/3064663.3064699
- Moreno, M. V., Ramos, J. L. H., & Skarmeta, A. F. (2014). User role in IoT-based systems. In Proceedings of IEEE World Forum on Internet of Things (pp. 141-146). New York, NY: IEEE. https://doi.org/10.1109/WF-IoT.2014.6803136
- Nakamura, Y., Arakawa, Y., & Yasumoto, K. (2016). Smart experimental platform for collecting various sensing data from various things. In Proceedings of the ACM International Joint Conference on Pervasive and Ubiquitous Computing (Adjunct, pp. 1751-1754). New York, NY: ACM. https://doi.org/10.1145/2968219.2968268
- Network, C. (2016). Why the consumer Internet of things is stalling. Retrieved from https://www.forbes.com/sites/ciocentral/2016/09/13/why-the-consumer-internet-of-things-is-stalling
- Olsson, H. H., Bosch, J., & Katumba, B. (2016). Exploring IoT user dimensions. In Proceedings of International Conference on Product-Focused Software Process Improvement (pp. 477-484). Berlin, Germany: Springer. https://doi.org/10.1007/978-3-319-49094-6_33
- Orlikowski, W. J. (1996). Improvising organizational transformation over time: A situated change perspective. Information Systems Research, 7(1), 63-92.
- Patel, M., Asch, D., & Volpp, K. (2015). Wearable devices as facilitators, not drivers, of health behavior change. JAMA, 313(5), 459-460. https://doi.org/10.1001/jama.2014.14781
- Patel, P., & Cassou, D. (2015). Enabling high-level application development for the Internet of things. Journal of Systems and Software, 103, 62-84. https://doi.org/10.1016/j.jss.2015.01.027
- Paulos, E. (2009). Designing for doubt citizen science and the challenge of change. In Proceedings of the 1st International Forum on the Application and Management of Personal Electronic Information in Engaging Data. Boston, MA: MIT. Retrieved from http://citeseerx.ist.psu.edu/viewdoc/summary?doi=10.1.1.187.5824
- Petkov, P., Köbler, F., Foth, M., & Krcmar, H. (2011). Motivating domestic energy conservation through comparative, community-based feedback in mobile and social media. In Proceedings of the 5th International Conference on Communities and Technologies (pp. 21-30). New York, NY: ACM. https://doi.org/10.1145/2103354.2103358
- Purington, A., Taft, J. G., Sannon, S., Bazarova, N. N., & Taylor, S. H. (2017). “Alexa is my new BFF”: Social roles, user satisfaction, and personification of the Amazon Echo. In Proceedings of the SIGCHI Conference on Human Factors in Computing Systems (Extended Abstracts, pp. 2853-2859). New York, NY: ACM. https://doi.org/10.1145/3027063.3053246
- Riche, Y., Dodge, J., & Metoyer, R. A. (2010). Studying always-on electricity feedback in the home. In Proceedings of the SIGCHI Conference on Human Factors in Computing Systems (pp. 1995-1998). New York, NY: ACM. https://doi.org/10.1145/1753326.1753628
- Rogers, Y. (2006). Moving on from weiser’s vision of calm computing: Engaging ubicomp experiences. In Proceedings of International Conference on Ubiquitous Computing (pp. 404-421). Berlin, Germany: Springer.
- Rose, K., Eldridge, S., & Chapin, L. (2015). The Internet of things: An overview. Internet Society, (October), 53. https://doi.org/10.1017/CBO9781107415324.004
- Satyanarayanan, M. (2001). Pervasive computing: Vision and challenges. IEEE Personal Communications, 8(4), 10-17. https://doi.org/10.1109/98.943998
- Schwanda, V., & Ibara, S. (2011). Side effects and gateway tools: Advocating a broader look at evaluating persuasive systems. In Proceedings of the SIGCHI Conference on Human Factors in Computing Systems (pp. 345-348). New York, NY: ACM. https://doi.org/10.1145/1978942.1978991
- Silverstone, R., & Haddon, L. (1996). Design and the domestication of information and communication technologies: Technical change and everyday life. In R. Mansell & R. Silverstone (Eds.), Communication by design: The politics of information and communication technologies (pp. 44-74). Oxford, UK: Oxford University.
- Strauss, A., & Corbin, J. M. (1990). Basics of qualitative research: Grounded theory procedures and techniques. Thousand Oaks, CA: Sage.
- Sung, J., Grinter, R. E., & Christensen, H. I. (2010). Domestic robot ecology. International Journal of Social Robotics, 2(4), 417-429. https://doi.org/10.1007/s12369-010-0065-8
- Takayama, L., Pantofaru, C., Robson, D., Soto, B., & Barry, M. (2012). Making technology homey: Finding sources of satisfaction and meaning in home automation. In Proceedings of the Conference on Ubiquitous Computing (pp. 511-520). New York, NY: ACM. https://doi.org/10.1145/2370216.2370292
- Toscos, T., Faber, A., An, S., & Gandhi, M. P. (2006). Chick clique: Persuasive technology to motivate teenage girls to exercise. In Proceedings of the ACM Conference on Human Factors in Computing Systems (pp. 218-221). New York, NY: ACM. https://doi.org/10.1145/1125451.1125805
- Ur, B., McManus, E., Ho, P. Y. M., & Littman, M. L. (2014). Practical trigger-action programming in the smart home. In Proceedings of the SIGCHI Conference on Human Factors in Computing Systems (pp. 803-812). New York, NY: ACM. https://doi.org/10.1145/2556288.2557420
- Ur, B., Ho, P. Y. M., Brawner, S., Lee, J., Mennicken, S., Picard, N., … Littman, M. L. (2016). Trigger-action programming in the wild. In Proceedings of the SIGCHI Conference on Human Factors in Computing Systems (pp. 3227-3231). New York, NY: ACM. https://doi.org/10.1145/2858036.2858556
- Wakkary, R., Oogjes, D., Hauser, S., Lin, H., Cao, C., Ma, L., & Duel, T. (2017). Morse things: A design inquiry into the gap between things and us. In Proceedings of the Conference on Designing Interactive System (pp. 503-514). New York, NY: ACM. https://doi.org/10.1145/3064663.3064734
- Weiser, M., & Brown, J. S. (1996). Designing calm technology. PowerGrid Journal, 1(1), 75-85.
- Weiser, M., Gold, R., & Brown, J. S. (1999). The origins of ubiquitous computing research at PARC in the late 1980s. IBM Systems Journal, 38(4), 693-696.
- Wilson, C., Hargreaves, T., & Hauxwell-Baldwin, R. (2015). Smart homes and their users: A systematic analysis and key challenges. Personal and Ubiquitous Computing, 19(2), 463-476. https://doi.org/10.1007/s00779-014-0813-0
- Wilson, H. J., Shah, B., & Whipple, B. (2015, Oct. 28). How people are actually using the Internet of things. Harvard Business Review. Retrieved from https://hbr.org/2015/10/how-people-are-actually-using-the-internet-of-things
- Woo, J., & Lim, Y. (2015). User experience in do-it-yourself-style smart homes. In Proceedings of the ACM International Joint Conference on Pervasive and Ubiquitous Computing (pp. 779-790). New York, NY: ACM. https://doi.org/10.1145/2750858.2806063
- Worthy, P., Matthews, B., & Viller, S. (2016). Trust me: Doubts and concerns living with the Internet of things. In Proceedings of the Conference on Designing Interactive Systems (pp. 427-434). New York, NY: ACM. https://doi.org/10.1145/2901790.2901890
- Yachir, A., Amirat, Y., Chibani, A., & Badache, N. (2016). Event-aware framework for dynamic srvices discovery and selection in the context of ambient intelligence and internet of things. IEEE Transactions on Automation Science and Engineering, 13(1), 85-102. https://doi.org/10.1109/TASE.2015.2499792
- Yang, R., & Newman, M. W. (2013). Learning from a learning thermostat: Lessons for intelligent systems for the home. In Proceedings of the ACM International Joint Conference on Pervasive and Ubiquitous Computing (pp. 93-102). New York, NY: ACM. https://doi.org/10.1145/2493432.2493489
- Yang, R., Shin, E., Newman, M. W., & Ackerman, M. S. (2015). When fitness trackers don’t “fit”: End-user difficulties in the assessment of personal tracking device accuracy. In Proceedings of the ACM International Joint Conference on Pervasive and Ubiquitous Computing (pp. 623-634). New York, NY: ACM. https://doi.org/10.1145/2750858.2804269
- Yarosh, L., & Zave, P. (2017). Locked or not?: Mental models of IoT feature interaction. In Proceedings of the SIGCHI Conference on Human Factors in Computing Systems (pp. 2993-2997). New York, NY: ACM. https://doi.org/10.1145/3025453.3025617