
A Usability Evaluation of Web Map Zoom and
Pan Functions
Manlai You, Chun-wen Chen*, Hantsai Liu, and Hsuan Lin
National Yunlin University of Science and Technology, Yunlin, Taiwan
*Corresponding Author: g9030805@yuntech.edu.tw
Due to limitations on screen size and resolution, the usability of web maps relies heavily on their interface design. The main goal of this research is to find better interface designs for web maps and to facilitate their usage by the public. The research consists of two stages of investigation: (a) a survey on the operation interfaces of popular web maps; and (b) a usability evaluation of simulated interfaces by measuring task performance and conducting subjective evaluations. Since the most common operation functions of web maps are zoom and pan, these two functions were selected as the main factors to be tested by simulations. The zoom function consists of two modes: original-center zoom and re-center zoom; the pan function also consists of two modes: grouped pan buttons and distributed pan buttons. The results show that: (a) for zoom operations, an original center zoom design is more efficient than a re-center zoom design; (b) an original-center zoom design is preferred to a re-center zoom design in matching with the meaning of the zoom icons; and (c) a re-center zoom design is preferred to an original-center zoom design in the compatibility of movement directions between the map and user’s mental cognition.
Keywords - Web Map, Zoom, Pan, Interface Design, Usability, Human-Computer Interaction
Relevance to Design Practice - This research aims to find better interface designs for web maps and to facilitate their usage by the public. The performance and satisfaction of the zoom and pan functions were verified by experiments.
Citation: You, M., Chen, C.-w., Liu, H., & Lin, H. (2007). A usability evaluation of web map zoom and pan functions. International Journal of Design, 1(1), 15-25.
Received Octorber 18, 2006; Accepted January 19, 2007; Published March 30, 2007
Copyright: © 2007 You, Chen, Liu and Lin. Copyright for this article is retained by the authors, with first publication rights granted to International Journal of Design. All journal content, except where otherwise noted, is licensed under a Creative Commons Attribution-NonCommercial-NoDerivs 2.5. By virtue of their appearance in this open access journal, articles are free to use, with proper attribution, in educational and other non-commercial settings.
Manlai You is a professor in the Department of Industrial Design at National Yunlin University of Science and Technology, Taiwan. His research interests include Ergo Design, Design Management, and Design Education. He is currently editor of the International Journal of Design, Journal of Design, and Journal of Science and Technology.
Chun-wen Chen is a Ph.D. candidate in the Graduate School of Design at National Yunlin University of Science and Technology, Taiwan. He has served as a lecturer in the Department of Information Communication at Asia University and as an adjunct lecturer at several universities. His main research interests are in the areas of HCI, information graphics, maps, and physical computing. He received his M.S. degree in digital media design from the Department of Information Communication, Yuan Ze University, Taiwan in 2001, and his B.S. degree in engineering from the Department of Power Mechanical Engineering, Tsing Hua University, Taiwan in 1989. He has extensive experience in graphic design and books/magazines publishing with DTP systems, and for several years, he worked on digital media at the Center for Research of Art and Technology, Taipei National University of the Arts. Later, he returned to NYUST, where he is currently pursuing his Ph.D. degree in design. His dissertation topic focuses on the design of interactive wayfinding maps.
Hantsai Liu is an industrial designer with research interests in CAD software, human-computer interaction, and product design. He received his M.F.A. in design from the Department of Industrial Design, National Yunlin University of Science and Technology, Taiwan in 2005, and his B.F.A. in design from the Department of Product Design, Shu-te University of Science and Technology, Taiwan in 2003. He has designed several communication products, including a “vocal chord phone” for the deaf and mentally-challenged and a “Braille phone” for the blind. He has also studied product designs for Taiwan festival culture. The topic of his master’s thesis covers the usability of web maps.
Hsuan Lin is a graduate student in the Department of Industrial Design, National Yunlin University of Science and Technology, Taiwan. His main research interests include human factors, human-computer interaction, user interface, and maps.
Introduction
A web map is a Web-based service on the Internet that provides maps for users to search and browse spatial information, such as place locations and routes. Web maps have become popular on the Web due to their convenience, low cost, and dynamic characteristics (Kraak, 2001). However, due to limitations on resolution and display size, the usability of web maps depends heavily on the user interface design in addition to the map itself. If the conceptual model of interface design cannot match users’ understanding, errors and frustration will take place (Norman, 1988). Different operation interface designs will result in different user experiences.
The user interface of a web map includes a map and an operation interface. The design of a map involves the visualization and arrangement of spatial information on the proper medium. It has been widely studied in the fields of cartography and information visualization. The authors of this research, You, Chen, & Lee (2006) have conducted a study on map design, which investigated the usability of factors in a wayfinding map. In the study, a simulated map and environment (a park) were used to test the participants’ performance and satisfaction. Results of the research show that maps with a perspective view and figurative landmarks provided better usability and higher subjective satisfaction. Chen, You, Liu, & Lin (2006) also have conducted a pilot study on the search performance of operation interfaces. Significant difference was found between the two zoom modes. Based on these findings, this paper reports a further investigation on the part of operation interfaces.
The operation interface consists of a set of objects that users can manipulate with a mouse or other input devices to activate map functions, such as zooming and panning, to control the map display in the frame. Interface designs and their use methods on a web map could be used for specific map operations. The methods of use include mouse manipulation, such as clicking and dragging.
Although web maps work in web browsers with a graphic user interface, they are quite different from general web pages or computer applications. The special functions required to manipulate maps make the interface complicated and difficult to learn. To make matters worse, web maps employ various interfaces, and therefore users must learn a different interface style with each web map. Without such difficulties, web maps would be much more popular nowadays.
Web maps are a useful tool to help people find target locations or proper routes and is a good aid to wayfinding problem-solving. As Siegel & White (1975) proposed, wayfinding knowledge is acquired through 3 stages: (a) landmark information: understanding of the key landmarks; (b) route among landmarks: landmarks as decision points; and (c) holistic spatial relationship: to form a cognitive map. As web maps are supposed to help people develop their wayfinding knowledge, interface designs should reinforce the use of web maps for better wayfinding performance and experience.
The main goal of this research is to find better interfaces for web maps and to facilitate their usage by the public. The research consists of two stages of investigation: (a) a survey on the operation interfaces of popular web maps and (b) a usability evaluation of simulated interfaces by measuring task performance and subjective evaluation.
Literature Review
There are many new technologies and interfaces being applied to spatial information systems, such as web maps, but the basic foundation of interactive interface of spatial information systems is still not established, especially for beginners (Cartwright, Crampton, Gartner, Miller, Mitchell, Siekierska, & Wood, 2001). Although the geographic information system (GIS) has been frequently taken as an example of direct manipulation in the field of human-computer interaction (Shneiderman, & Plaisant, 2005), no standards exist for map operation. Although web maps may be based upon the same technological structure, each web map service provider develops its own interface style. Consequently, an occasional user trying a web map usually would have to learn the map system’s specific operation interface - such as the meanings of the icons, the layout arrangement, and the methods of function use. If the user switches to another map system, he/she would likely face an unfamiliar operation interface. Unlike the Microsoft Windows OS or compatible software, most web maps do not have a common graphical user interface (GUI), vocabulary, or syntax. For example, in the Windows OS, mouse operations, such as click, double click, and drag, are defined clearly (Microsoft, 1999). However, their extension to the operation of web maps is usually not guaranteed.
A web map is a simplified GIS for non-expert end-users. The tasks that an end-user performs on a web map are usually simpler than those that an expert performs on a general GIS. Van Elzakker (2001) proposed modes of using web maps as: to explore, to analyze, to synthesize, and to present. However, most data processing, analyzing, and authoring functions are not available for web maps, because the main function of web maps is to present spatial information. Only some basic functions, such as zooming and panning, are available for users to browse the contents of such web maps.
In the report, Guidelines for best practice in user interface for GIS, zooming and panning are taken as basic operation functions for data visualization in GIS. Zooming is defined as “the process of magnifying or reducing the scale of a map or image displayed on the monitor.” Panning is defined as “the process of changing the position at which the view is displayed, without modifying the scale” (European Commission, 1998, p. 76). Different zoom modes are as follows: (a) original center: the new rendition is centered at the same location as the previous one; (b) re-center: the new rendition is centered on the point selected by the user; (c) by marquee: the user can magnify a sub-region by selecting the opposite corners of the rectangle encompassing the area of interest; and (d) by number: the user can assign the exact scale by typing the scale denominator. The different modes for panning are as follows: (a) by discrete movements of the view point using hot keys or buttons, (b) continuous through traditional scroll bars, and (c) by means dragging the cursor. However, not all modes of operation functions are available for all web maps, most likely due to technical or economic reasons.
As Harrower & Sheesley (2005) wrote, although millions of map users pan and zoom every day, few studies have been done to understand how panning and zooming should be designed to improve the usability of web maps. They thereby proposed a conceptual framework for evaluating both functionality and efficiency of pan/zoom functions. The conclusion is that no single pan or zoom method is both highly capable and highly efficient. A pan/zoom design is better only for particular users and tasks.
The elements of usability proposed by Nelson (1993) were used as criteria of usability in this study. They are (a) efficiency, (b) learnability, (c) memorability, (d) error rate, and (e) satisfaction. When considering the web map interface for efficiency of use, Fitts’ law can be used as a basic guideline for designing an interface to deal with time and distance factors. Fitts’ law models the relationship between movement time, distance, and accuracy for people engaged in rapid aimed movements (Soukoreff & MacKenzie, 2004). It is a model of human movement, predicting the time required to rapidly move from a starting position to a final target area as a function of the distance to the target and the size of the target (Fitts, 1954). It can be applied both in the physical world and on computers.
According to Fitts’ law, the movement will be faster when only a short distance is needed to manipulate the mouse to complete the operations of a function. Therefore, in theory, all controls should be put close to each other for efficiency. In a web map, for example, all pan buttons for different directions should be put together for quick pan operations. Similarly, zooming with original map center can be used again and again quickly, because it is not necessary to move the mouse.
When considering web map interface for learnability, it is natural to arrange controls according to the directions of the corresponding functions. For example, the pan buttons are put on the spatially-related positions according to the pan directions. Norman (1988) has explained the principle of mapping. It is not directly related to cartography or map design. The principle addresses the relationship between two things, such as controls and their movements and the results in the world. If the mapping is natural (i.e. visible, closely related to the desired outcome, and provides immediate feedback), it is easier to learn and remember. Following the principle of mapping, a designer may use a spatial analogy. For example, to move an object up, move the control up, and to control an array of objects, arrange the controls in the same pattern as the objects.
In a web map context, it is natural to put the pan buttons on the spatially-related positions corresponding to the directions of the pan functions. However, do users know the exact meaning of the functions that the designer assigned? When a pan button is clicked, does the user move the frame (or the window) around the map or the actual map itself? Although some may argue that this could be learned easily by trial-and-error, according to Norman (1988), different conceptual models are formed during the process that may mislead users into thinking that they are moving the map itself, even though the designer had intended the users to move the frame.
By just keeping buttons in accordance with the same directions as that of the functions is not sufficient for providing clues on the intended conceptual model. One solution can be found in many web maps, which is to distribute the pan buttons to the corresponding frame margin. It may help users form the conceptual model of panning by moving the map frame. Another solution is to use a move function with a hand icon as a pan function (European Commission, 1998). It hints to the users that they can move the map by dragging. Users may form the conceptual model of panning by moving the map itself. Zooming of re-center is also an example showing the alternative conceptual model of panning. With a magnifier icon as the button and the cursor of operation, it changes the scale and the center of map simultaneously. Using the magnifier metaphor, it is natural to learn the conceptual model of panning by clicking a new center.
The design of a web map interface is a trade-off between efficiency and learnability. In the zoom/pan example, Fitts’ law provides the fundamental understanding about the efficiency of layout and use of web map interfaces. Norman’s principle of mapping and conceptual model is a good guideline for designing interfaces that are easier to learn and remember. However, the use of larger and more closely placed buttons cannot always prove to match natural mapping. In many applications, the principles end up conflicting with each other. The designers then need to find an appropriate solution for resolving the conflict.
In addition to improving the performance of operation on computer displays, web map interfaces should also help people develop wayfinding knowledge. Although spatial cognition operates differently in manipulable (small scale) space and in geographic (large scale) space, people can interact with GIS or maps as if the geographic space is manipulable (Mark, 1995). Wayfinding knowledge develops from small scale to large scale, and as much of the literature has noted, it develops from landmark to route between landmarks to holistic spatial relationship (Siegel & White, 1975). Following good design concepts, the conceptual model of operation should match the physical space users manipulate. The interface of web maps can provide a manipulable context or objects to use in developing wayfinding knowledge for larger spaces. For example, not only maps, but the interface itself, can be a manipulable miniature world for users to touch, drag, rotate, and open. The cognition of scale, distance, and direction may be acquired from computer displays as from geographic space.
Case Study on Map Operation Interface
Survey of web maps
Existing web map sites were found through major local and international search engines (Yahoo! Taiwan and Google) using keywords, such as web map, electronic map, digital map, and map. Web maps with high page link ratings were selected to investigate their interface. To diversify the types of web maps in this research, web maps with similar interfaces were excluded. The screening process was as follows: (a) group web maps with similar interfaces (including functions and layout); and (b) exclude those web maps within the same group that use the same technology and have very similar functions and layout. At the end, 10 web maps were selected - 5 Taiwan-based and 5 US or worldwide-based - as shown in Table 1.
Table 1. Investigated web maps
|
Analysis of Map Operation Functions
The researchers tested map operation functions for the 10 selected sites with the main focus on basic map operations, such as zooming and panning. The procedure used was as follows: (a) search the same places (Taipei City for Taiwan maps, Manhattan, New York for worldwide maps) in all 10 web maps; (b) click the map operation buttons to navigate the area and learn the methods of use; and (c) record available functions, the methods of use, and the icon and layout design. All functions were collected and classified as shown in Tables 2a and 2b. In the tables, the default function is one that could be used on a map by clicking or dragging without first having to switch modes. The continuous function is one that could work repetitively without additional switching.
Table 2a. Zoom functions of web map operation interface
Table 2b. Pan functions of web map operation interface

With an original center zoom design, the center of the map remains the same as before a zoom, while a re-center zoom design uses a user-selected point as its new center to re-frame the zoomed section. In other words, in an original center zoom design, the map reacts directly as soon as the zoom button is clicked; however, in a re-center zoom design, a further click is required at the desired center point in the map following the click of the zoom button.
Zoom-in by marquee is used to select a rectangular area on the map, at which point the map changes its scale to fit the area to the frame. Zoom by fixed scale usually provides a linear scale with some fixed steps. Users can randomly select a scale or shift a step up or down each time.
The pan function can be triggered by clicking one of the directional pan buttons. Most web maps provide 8-direction pan buttons, which could be grouped together or distributed around the map frame (see Figure 1). Re-center panning changes the center of the map with a single click. This function is not so obvious, because it lacks a function button or a hint from the cursor with an icon. But the re-center movement and its conceptual model are easy to understand from trial-and-error.
Moving by dragging moves the map by dragging it with the mouse, usually with a hand icon and/or a cursor. Not only is it a very intuitive way to manipulate maps, it is also compatible with most other map operations, making it easy for designers to use such a function with other ones. For this reason, many web maps set it as the default function.
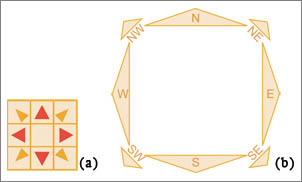
Figure 1. Modes of 8-direction pan buttons: (a) grouped and (b) distributed.
Analysis on Combinations of Functions
It was found that various combinations of functions were used on the interfaces. Some functions are used independently. For example, the move function (by dragging the map) is compatible with two main modes of zoom, re-center and original center. Some functions, such as zoom-in and zoom-out, must be paired together.
Since some functions share the same mouse operation, the user needs to first use a control to select the function. For example, zooming by marquee and moving by dragging use the same mouse operation. The user needs to select the proper function first.
Some functions for the same purpose work with exclusive operation modes. For example, designers have to pick one from the two zoom modes. The two operation modes are differentiated as original center vs. re-center, but such 2 modes could share exactly the same form in their layouts.
Some functions can be arranged in various styles. For example, the 8 directional pan buttons could be grouped together or distributed around the map frame. Although the two styles have the same function, they result in different cognitive mappings (see Figure 1).
Method
Many interface design factors affect the usability of web maps. For example, the move function, which is carried out by dragging the map, is compatible with most other functions. It is therefore reasonable to adopt it as the default function. That is why the move function was not tested in the following tasks. In this research, 2 factors of operation modes were selected as independent variables: (a) zoom center: original center vs. re-center, and (b) layout of the pan buttons: grouped together vs. distributed. The 2 factors were tested independently to evaluate overall usability. The dependent variables are the usability measured by user performance and subjective evaluation.
Simulated web maps were developed for different combinations of the main variables. Simulated web maps of the identified operation modes (independent variables) were then tested for operation performance (dependent variables) of tasks. 3 tasks were designed to evaluate the usability of a web map in acquiring the 3 kinds of spatial knowledge, i.e., landmarks, route, and survey knowledge. Task 1 tests the time required to identify the location of a landmark on a web map and is the basic test for the efficiency element of usability. Tasks 2 and 3 examine the effects to the spatial knowledge after map operations and are for testing the memorability element of usability.
Participants
There were 96 participants - 48 male and 48 female - that participated in the experiment. All participants were college students (undergraduate and post-graduate) from the authors’ university with age distribution as shown in Table 3. Most of them have had some experience in using web maps (see Table 4), but none had experience in designing them.
Table 3. Age of participants
Table 4. Web map experience of participants
Materials and Setting
From the 2 variables of operation modes, (a) zoom center: original center vs. re-center and (b) pan button layout: grouped together vs. distributed, 4 interfaces of simulated web map were developed (see Table 5). For example, Interface 1 consists of original center zoom with grouped pan buttons. Whereas the different pan button layouts are apparent (see Figure 2), interfaces with different zoom center functions share the same form. Users can only differentiate between them by using them.
Table 5. Interfaces of simulated web map
The interfaces of simulated web map were created with an interface prototyping tool - Macromedia Flash (see Figure 2). The same fictitious map was used in all simulated web maps but place labels were renamed for each. The map covered an area of 650×530 pixels, and the simulated interface covered an area of 960×700 pixels. The icons were designed as 52×52 pixels in size (see Figure 3). The icons representing landmarks on the map for Tasks 2 and 3 were designed as 32×32 pixels in size by the researchers (see Figure 4). The fonts were set in Dynafont HeiLight 20 points. The background color of the interface area was set as gray (#CCCCCC) and light gray (#E1E9F8). Due to cultural differences, some icons might not be familiar to worldwide users. For example, the icon used to represent a gift store resembles a Christmas tree. There were 2 icons, the train station and the gas station, that adopted the logos of two major companies owned by the Taiwan government.
The simulated interfaces can record the names and the time with events, the coordinates of map frame movement, and the zoom scale as users operated the map. The map was designed with content of which participants were unfamiliar. The map is based on a real map of Taichung City, but the names of places and streets were altered to random ones from other cities. The layout is similar to many cities in Taiwan with a main train station located in the center of the city and roads forming a radial network around the train station. Although some participants were familiar with the city, the target places chosen were common ones that could be found in other cities, such as post offices, schools, and hospitals.
The experiment was run on a 2.4G Hz Intel Pentium 4 computer with 512Mb of RAM. The 17-inch LCD display was set to a resolution of 1280×1024 pixels. The input device was a standard Logitech 3-button mouse. All experimental software ran under the Windows XP operating system. The experiment was conducted in a computer laboratory (DC327) that was equipped with sufficient lighting and air-conditioning.
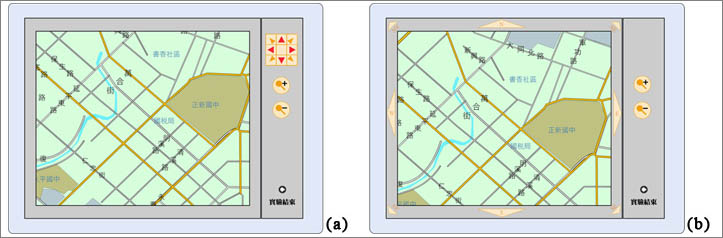
Figure 2. Simulated web map interfaces: (a) Grouped pan buttons (interfaces 1 and 3) and (b) Distributed pan buttons (interfaces 2 and 4).

Figure 3. Zoom icons in simulated web map interfaces: (a) Zoom-in and (b) Zoom-out.

Figure 4. Icons Representing Landmarks on the map for Tasks 2 and 3.
Procedure
Task 1: Landmark searching
The experiment is a within-subject design. All participants tested 4 interfaces. Maps for all 4 interfaces shared the same point location layout. The order of test interfaces varied among the participants in order to counterbalance the effect of practice and/or fatigue.
There were 5 red points (labeled from Point A to E) at different locations that acted as task targets in each interface. The tasks involved using simulated interfaces to find all 5 points and to write down the codes associated with them. The red points appeared one at a time for participants to find. The search order is fixed, from point A to E, for every participant. To prevent the participants from missing any of the points, the point of search is visible at all zoom scales. The points are clickable only when participants are close enough to see the attached numeric codes.
The data of operation performance was collected, such as the time required to find each target, the time of each step, the number of steps in using the function, and the correctness of code reading. The data of interface status was also collected, such as the movements of map frame center and the zoom scales.
Questionnaire:
After each test of a different interface for Task 1, each participant was asked to fill out a questionnaire as a subjective evaluation of interface use. The questionnaire was designed by the researchers to evaluate the learnability and satisfaction part of usability. The main purpose of the questionnaire was to determine user cognition and satisfaction both of which are not so explicitly measurable during interface testing. The questionnaire was filled out after completing Task 1. For Task 1, participants used all 4 interfaces, and the Likert scale was used to get the data. The subjective evaluation was rated from 1 to 5, with 1 for strongly disagree and 5 for strongly agree. The statements in the questionnaire are listed as follows:
- The icons clearly represent the function. [learnability]
- The interface is helpful in locating targets. [learnability]
- The pan directions of the map match your cognition. [learnability]
- The zoom function is easy to use. [learnability]
- You are satisfied with the interface. [satisfaction]
Task 2: Route memorizing
To prevent the practice effect, a between-subject design was used for Tasks 2 and 3. By the method of randomized block design, the participants were randomly assigned to 4 groups to test the 4 interfaces. Each participant tested only one interface.
The simulated web map first showed a route from a train station to a school with several landmark icons distributed over the map. After 1 minute, the route and icons disappear, and all icons transform into blue points located in the original positions. Participants had to operate the interface to pick the 5 landmarks located on the route by clicking the correct blue points from memory, and to read and write down the codes attached. It was not required to follow the order of landmark icons on the route. To force participants to use similar steps to operate the interfaces, the blue points were clickable only when the map was enlarged to the largest scale. After a point was clicked, the code would appear below the point.
The data of operation performance was collected as in Task 1. Errors were counted only when participants clicked points that were not on the route. The codes written down by participants would not be taken as criteria for the error rate. It is a design to force participants to use similar steps to operate the interfaces.
Task 3: Spatial environment memorizing
The simulated web map showed the environment around a train station. The participants could browse the area and try to memorize the locations of the landmark icons in the area by operating the interface for 3 minutes. The landmark icons would then disappear from its original location and reappear beside the map. At this point, the participants had to drag the icons back to their original locations on the map by operating the interface. To force participants to use similar steps to operate the interfaces, the icons could only be dragged when the map was enlarged to the largest scale.
The data of operation performance was collected as in Task 1. The errors were counted as the number of times that participants misplaced the icons.
Results and Discussions
Analysis of User Performance
Task 1: landmark searching
Table 6 shows the user performances of total time used in locating targets. It appears that an original center zoom design is more efficient than a re-center zoom design and that a grouped button design is more efficient than a distributed button design. Further statistical tests are necessary to verify the hypotheses.
Table 6. Task 1 user performance in time
To determine whether there are significant differences in the mean time among the combinations of the 2 factors of zoom center and pan button layout, a repeated measures two-way ANOVA was used (see Table 7). Using a .05 significance level, the effect of interaction was not significant (p = .30 > .05). That is, the 2 factors are independent of each other. Testing the main effect of factors, there is a significant difference between original center and re-center zoom (p = .02 < .05). That is, an original center zoom design should be more efficient than a re-center zoom design. There is no significant difference between grouped and distributed buttons (p = .14 > .05). Thus, a grouped button design is similar to a distributed button design in performance.
Table 7. Task 1 two-way ANOVA of user performance in time
To understand which pan button layout has more of an effect on the difference between an original center zoom design and a re-center zoom design, zoom modes with the same pan button layout were compared. A paired t-test with a .05 significance level was used (see Table 8). There was a significant difference between Interface 1 and Interface 3 (p = .02 < .05). That is, both with grouped pan buttons, an original center zoom design is more efficient than a re-center zoom design.
Table 8. Task 1 paired t-test of user performance in time
Task 2: Route memorizing
Table 9 shows the user performances of total time used in route memorizing. It appears that an original center zoom design is more efficient than a re-center zoom design and that a grouped button design is more efficient than a distributed button design in performance. Further statistical tests are necessary to verify the hypotheses.
Table 9. Task 2 user performance in time
To determine whether there are significant differences in the mean time among the combinations of the 2 factors of zoom center and pan button layout, a two-way ANOVA was used (see Table 10). Using a .05 significance level, the effect of interaction was not significant (p = .92 > .05). That is, the 2 factors are independent of each other. Testing the main effect of factors, there was no significant difference between original center and re-center zoom (p = .33 > .05). An original center zoom design is similar to a re-center zoom design in performance. There is no significant difference between grouped and distributed buttons (p = .90 > .05). Thus, a grouped button design is similar to a distributed button design in performance.
Table 10. Task 2 two-way ANOVA of user performance in time
Task 3: Spatial environment memorizing
Table 11 shows the user performances of total time used in spatial environment memorizing. It appears that a re-center zoom design is more efficient than an original center zoom design in performance and that a distributed button design is more efficient than a grouped button design in performance. Further statistic tests are necessary to verify the hypotheses.
Table 11. Task 3 user performance in time
To determine whether there are significant differences in the mean time among the combinations of the 2 factors of zoom center and pan button layout, a two-way ANOVA was used (see Table 12). Using a .05 significance level, the effect of interaction was not significant (p = .43 > .05). That is, the 2 factors are independent of each other. Testing the main effect of factors, there was no significant difference between original center and re-center zoom (p = .69 > .05). An original center zoom design is similar to a re-center zoom design in performance. There was no significant difference between grouped and distributed button layout (p = .69 > .05). Thus, a distributed button design is similar to a grouped button design in performance.
Table 12. Task 3 two-way ANOVA of user performance in time
Analysis of User Errors
Task 1 is a simple test of target search. The main purpose is to get data on efficiency. Almost all participants finished the task without errors. Analysis of user errors was done for Tasks 2 and 3.
Task 2: Route memory
When participants click on a landmark point located off of the route, it is counted as an error. Table 13 shows the user errors in route memorizing. It appears that an original center zoom design is better than a re-center zoom design and that a distributed button design is better than a grouped button design. Further statistical tests are necessary to verify the hypotheses.
Table 13. Task 2 user errors
To determine whether there are significant differences in the errors among the combinations of the 2 factors of zoom center and pan button layout, a two-way ANOVA was used (see Table 14). Using a .05 significance level, the effect of interaction was not significant (p = .70 > .05). That is, the 2 factors are independent of each other. Testing the main effect of factors, there was no significant difference between original center and re-center zoom (p = .70 > .05). An original center zoom design was similar to a re-center zoom design in user errors. There was no significant difference between grouped and distributed buttons (p = .11 > .05). Thus, a distributed button design is similar to a grouped button design in user errors.
Table 14. Task 2 two-way ANOVA of user errors
Task 3: Spatial environment memorizing
Table 15 shows the user errors in spatial environment memorizing. It appears that a re-center zoom design is better than an original center zoom design and that a distributed button design is better than a grouped button design. Further statistical tests are necessary to verify the hypotheses.
Table 15. Task 3 user errors
To determine whether there are significant differences in the errors among the combinations of the 2 factors of zoom center and pan button layout, a two-way ANOVA was used (see Table 16). Using a .05 significance level, the effect of interaction was not significant (p = .79 > .05). That is, the 2 factors are independent of each other. Testing the main effect of factors, there was no significant difference between original center and re-center zoom (p = .35 > .05). An original center zoom design is similar to a re-center zoom design in user errors. There was no significant difference between grouped and distributed buttons (p = .79 > .05). Thus, a distributed button design is similar to a grouped button design in user errors.
Table 16. Task 3 two-way ANOVA of user errors
Analysis of Subjective Evaluation
The answers to the 5 statements in the subjective evaluation questionnaire were rated from 1 to 5. The higher the rating, the more preferred the interface. To determine whether there are differences in the subjective evaluation among the combination of the 2 factors of zoom center and pan button layout, a repeated measures two-way ANOVA was used (see Table 17). Using a .05 significance level, the effect of interaction was not significant (p > .05). That is, the 2 factors are independent of each other. Only for Questions 3 and 5 was there a significant difference between the zoom designs.
Table 17. p-values of two-way ANOVA of subjective evaluation
Comparing the main effect of factors (see Tables 18 and 19), it is evident that an original center zoom design is preferred to a re-center zoom design in icon design (Question 1), and a re-center zoom design is preferred to an original center zoom design in its matching for panning directions of real map movement and mental cognition (Question 3).
Table 18. Score of question 1 of subjective evaluation questionnaire
Table 19. Score of question 3 of subjective evaluation questionnaire
The results of this experiment show that: 1) for zooming operations, according to the performance in time, an original center zoom design is better than a re-center zoom design; 2) the participants thought that original-center zoom matches the meaning of the zoom icon better than re-center zoom; and 3) the participants thought that re-center zoom is better than original-center zoom in the compatibility of movement directions between the map and user’s mental cognition.
Discussion
This research evaluated the common functions in web map interfaces, such as zoom and pan. The results show that an original center zoom design is more efficient than a re-center zoom design, but subjective evaluation does not agree with the above results. In particular, there is no significant difference among the 4 interfaces in terms of holistic satisfaction (Question 5).
In the analysis of subjective evaluation, only Questions 1 and 3 showed significant difference between the zoom modes. The participants thought that original center zoom matched the meaning of the zoom icon (a magnifier) better than re-center zoom. It is possible that users can get immediate feedback from the map scale changing while trying to click the icon of original center zoom. However, in the case of re-center zoom, the method of use is not as intuitive just from viewing the icon itself. The only feedback is the cursor that changes into a hand shape.
The participants also thought that re-center zooming was better than original-center zooming in the compatibility of movement directions between the map and user’s mental cognition. It is possible that re-center zooming includes a re-center panning function, emphasizing how to feel and be familiar with the relationship between operation and panning direction.
While using the pan buttons, inexperienced participants may suppose that they are to move the map, but not the frame. It could result in cognitive confusion of directions. This is because in most web maps, the conceptual model of panning is to move the frame virtually, and then the map shifts to the other direction. A possible solution is to adopt a design with distributed pan buttons. With buttons distributed near the frame margin, it carries a hint of moving the frame that may help users understand the intended conceptual model. But the distance among the distributed buttons will be longer than the grouped pan buttons. According to Fitts’ law, the longer the distance, the longer the time to move to a specific position. Thus, it may cancel out the benefit of distributed pan buttons for users.
Our research shows that the original center zoom design is more efficient than a re-center zoom design. When trying to compare the zoom modes with the same pan button layout, it was found that with grouped pan buttons, an original center zoom design is more efficient than a re-center zoom design. But with distributed pan buttons, their performances are similar. That is, the significant difference between the zoom modes mainly comes from those with grouped pan buttons.
In terms of user errors, there is no significant difference between the zoom modes or between pan button layouts. It is possible that the user errors in such tasks are not closely related to the interface factors investigated. Other external or internal factors, such as simulated map design, number and location of landmarks, or individual differences, may have influenced user performance in the experiments.
About the sampling of participants, the college students may not represent the general population exactly for their age and experience, especially experience in using the Internet. In this research, we preferred to investigate Internet users with some web map experience. College students were thought suitable.
Conclusion
The results of this experiment reveal some information about the usability of web map interface design. Two main factors of interface design were investigated in this research: zoom center modes and pan button layouts. Through performing tasks on simulated web maps, user performances were measured in time and by errors. The data of subjective evaluation to each interface were also collected. From the results, the main findings are as follow: (a) for zoom operations, an original center zoom design is more efficient than a re-center zoom design; (b) an original-center zoom design is preferred to a re-center zoom design in matching the meaning of the zoom icon; and (c) a re-center zoom design is preferred to an original-center zoom design in the compatibility of movement directions between the map and user’s mental cognition.
The results suggest that original-center zoom is a better operation interface for providing faster searches. But re-center zoom could provide an intuitive way to zoom-in, and further improvement and study may improve interface design of web maps.
Some suggestions to improve web map interface design follow:
- To help users get the conceptual model of panning as frame moving; the image of the frame could be emphasized.
- According to Fitts’ law, the distributed pan buttons can be extended in width or length for easier access, and the layout arrangement of buttons can be adjusted for shorter distances.
- Current status of the function in use by cursor changing or pop-up messages can be shown, especially for continuous or default functions.
Suggestions for further study follow:
- The test of functions could be more detailed. In this research, the zoom and pan scale was fixed as are with most web maps presently. The appropriate scale increment could be investigated for better user performance and experience.
- While interfaces were tested, the time, map coordinates, and map scales at all mouse events were recorded. A method of visualization can be adopted to analyze the data.
Acknowledgment
This study was partly sponsored with a grant, NSC94-2213-E-224-014, from the National Science Council, Taiwan.
References
- Cartwright, W., Crampton, J., Gartner, G., Miller, S., Mitchell, K., Siekierska, E., & Wood, J. (2001). Geospatial information visualization user interface issues. Cartography and Geographic Information Science, 28, 45-60.
- Chen, C.-w., You, M., Liu, H., & Lin, H. (2006). A usability evaluation of web map interface. Proceedings of the 16th World Congress of the International Ergonomics Association (CD ROM) (6 pp.), July 10-14, Maastricht, the Netherlands.
- European Commission. (1998). Section 7: Recommendations for the best use of key GIS UI functions. In European Commission, Guidelines for best practice in user interface for GIS (ESPRIT/ESSI project no. 21580) (pp. 69-84).
- Fitts, P. M. (1954). The information capacity of the human motor system in controlling the amplitude of movement. Journal of Experimental Psychology, 47, 381-391.
- Harrower, M., & Sheesley, B. (2005). Designing better map interfaces: A framework for panning and zooming. Transactions in GIS, 9(2), 77-89.
- Kraak, M. J. (2001). Setting and needs for web cartography. In M. J. Kraak & A. Brown (Eds.), Web cartography: Developments and prospectus (pp. 1-7). London: Taylor & Francis.
- Mark, D. M. (1995). Spatial concepts and cognitive model for geographic information use. In T. L. Nyerges, R. Laurini, M. J. Egenhofer & D. M. Mark (Eds.), Cognitive Aspects of Human-Computer Interaction for Geographic Information Systems (pp. 21-8). Dordrecht, The Netherlands: Kluwer Academic Publishers.
- Microsoft. (1999). Microsoft Windows user experience. Redmond, WA: Microsoft Press.
- Nielsen, J. (1993). Usability engineering. Cambridge, MA: Academy Press Professional.
- Norman, D. (1988). The psychology of everyday things. New York: Basic Book.
- Shneiderman, B. & Plaisant, C. (2005). Designing the user interface: Strategies for effective human-computer interaction (4th ed.). Boston: Pearson Education.
- Siegel, A. W. & White, S. H. (1975). The development of spatial representations of large-scale environments. In H. Reese (ed.), Advances in child development and behavior, Vol. 10 (pp. 9-55). New York: Academic Press.
- Soukoreff, R. W. & MacKenzie, I. S. (2004). Towards a standard for pointing device evaluation, perspectives on 27 years of Fitts’ law research in HCI. International Journal of Human-Computer Studies, 61, 751-789.
- Van Elzakker, C. P. J. M. (2001). Use of maps on the Web. In M. J. Kraak & A. Brown (Eds.), Web cartography: Developments and prospectus. London: Taylor & Francis.
- You, M., Chen, C.-w., & Lee, P. (2006). A study on the usability of wayfinding maps: Effects of views and landmark styles. Journal of Design, 11(1), 85-99.
