
Understanding Older Adults’ Post-adoption Usage Behavior and Perceptions of Mobile Technology
Qingchuan Li and Yan Luximon*
School of Design, The Hong Kong Polytechnic University, Hong Kong
Little is known about how older adults use and perceive mobile technology after their initial adoption. This study investigated older adults’ post-adoption usage behavior and user perceptions regarding advanced mobile technologies. It also examined the relationships among usage behavior, user perceptions, user characteristics, and technology features. Specifically, user characteristics of demographic factors and user capabilities were examined using self-report and performance measurements. Technology features, usage behavior, and user perceptions were investigated using semi-structured interviews. The results indicated that for post-adoption behavior, older adults were still in the early adoption stage. They generally demonstrated positive attitudes toward mobile technologies but also reported the complexity of technologies. User characteristics, such as age, and capability of processing speed and attention, significantly influenced older adults’ post-adoption usage behavior. Decreased visual abilities were observed to be critical factors related to older adults’ perceived usefulness and perceived efficiency of mobile technologies. Technology features also presented some noteworthy problems that influenced older adults’ perceived usability, particularly regarding navigation problems and icon design. This study provides a detailed understanding of how older adults use and perceive mobile technologies in the post-adoption phase from the perspectives of user characteristics and technology features to encourage further adoption.
Keywords – Mobile Technology, Older Adults, Post-adoption Behavior, Technology Features, User Characteristics.
Relevance to Design Practice – This study provides designers with a more comprehensive understanding of how older adults behave after adopting mobile technologies. By assessing user characteristics and technology features that facilitate or buffer older adults’ post-adoption behavior, this study can be the theoretical basis for designers to develop further guidelines encouraging upgraded adoption behavior.
Citation: Li, Q., & Luximon, Y. (2018). Understanding older adults’ post-adoption usage behavior and perceptions of mobile technology. International Journal of Design, 12(3), 93-110.
Received January 6, 2017; Accepted June 25, 2018; Published December 31, 2018.
Copyright: © 2018 Li & Luximon. Copyright for this article is retained by the authors, with first publication rights granted to the International Journal of Design. All journal content, except where otherwise noted, is licensed under a Creative Commons Attribution-NonCommercial-NoDerivs 2.5 License. By virtue of their appearance in this open-access journal, articles are free to use, with proper attribution, in educational and other non-commercial settings.
*Corresponding Author: yan.luximon@polyu.edu.hk
Qingchuan Li is a PhD candidate in School of Design at The Hong Kong Polytechnic University. She holds a Bachelor of Engineering in Industrial Design from Sichuan University and a Master’s degree in Industrial Engineering from The University of Hong Kong. Her research interests focus on human-computer interaction, usability and user experience, user-centered design, and universal design.
Dr. Yan Luximon is an Assistant Professor in School of Design at The Hong Kong Polytechnic University. She also serves as Lab Leader for Asian Ergonomics Design Lab and Deputy Discipline Leader for BA Product Design. She has published over 80 peer-reviewed journal papers, book chapters, patents, and international conference papers. Her research interests include ergonomics in design, anthropometry and its application in design, 3D digital human modeling and CAD, design tool and visualization, head and face related products, human computer interaction, cultural difference, statistical and mathematical models.
Introduction
Mobile technology use is becoming imperative for older adults to remain independent and active for longer (Mitzner et al., 2010). Older adults, it has been reported, perceive various benefits of mobile technology; it helps older adults maintain and develop social relationships, monitor and manage their health status, and benefit from security services (Gao, Ebert, Chen, & Ding, 2015; Jeong, Salvendy, & Proctor, 2010). Contemporary mobile technologies also offer smaller displays, direct manipulation interfaces, and numerous functions that can be accessed in any location and at any time; thus, they are much easier for older adults to use than earlier technologies. Nevertheless, the development of advanced mobile technologies has also introduced unprecedented challenges that may lead to unforeseen adoption and usage patterns for older adults (Zhou, Rau, & Salvendy, 2012). Firstly, while mobile technology has been implemented as a platform with high mobility, security, and functionality, the integration of such features makes all stages of mobile technology adoption more complicated than is required for general technologies, from the intention to use the technologies, to the early adoption of basic functions, and finally to the upgraded use of advanced functions. Secondly, from a user perspective, characteristics of the older adult population, such as subjective norms and age-related declines in capabilities, may influence how older adults use and perceive mobile technology in their daily lives (Pan & Jordan-Marsh, 2010; Wagner, Hassanein, & Head, 2014).
Related studies have investigated factors that potentially influence a typical user’s acceptance of general technologies. One focus of those studies has been to encourage acceptance through improving technology usability for older adults. Such studies have focused, primarily, on the effects of several technology components (Chung et al., 2015; Page, 2014) or age-related differences (Chevalier, Dommes, & Marquié, 2015; Dommes, Chevalier, & Lia, 2011; van der Wardt, Bandelow, & Hogervorst, 2010). These researchers investigated these effects by asking users to accomplish specific technology-based tasks and collecting measurement data such as task accuracy and speed. While such task-based research tells us a great deal about isolated activities it may not represent what the users actually experience in the usage of technologies. This difference is because the real-life usage context could be more complicated. Furthermore, higher technology usability may not result in increased technology acceptance. It has been shown that older adults use less advanced technologies even when the latter technologies are easy to use (Zhou et al., 2012). This has led to another area of study focused on internal perception attributes and external influential factors. Within this area of study, the most widely accepted models for predicting technology acceptance behavior include the technology acceptance model [TAM] (Davis, Bagozzi, & Warshaw, 1989) and unified theory of acceptance and use of technology [UTAUT] (Venkatesh, Morris, Davis, & Davis, 2003). Determinants and barriers that influence older adults’ adoption and acceptance of technologies have been discussed in different usage contexts such as assistive technology (Fischer, David, Crotty, Dierks, & Safran, 2014), information and communications technology (Elliot, Mooney, Douthit, & Lynch, 2014), computers and the Internet (Sheng & Simpson, 2015), and general technologies (Chen & Chan, 2014; Lee & Coughlin, 2015). Some crucial predictors have been identified, including personal attitudes and beliefs (e.g., perceived usefulness and perceived ease of use), individual characteristics (e.g., age, gender, and experience), and some external variables (e.g., facilitating conditions and social influence).
Acceptance is an attitude toward technology use, whereas adoption is a complicated process. Roger (1995) proposed the innovation diffusion theory to explain the product purchasing and adoption process. According to this theory, the production adoption process is divided into five stages, knowing the product, being persuaded of a need to buy the product, deciding to purchase the product, using the product, and accepting or regretting the decision to purchase the product. Focusing more on the domain of technology, Silverstone and Haddon (1996) proposed using the domestication of technology to describe the adoption process. Similar to, but not the same as, the innovation diffusion theory, the domestication of technology is more applicable for explaining technology adoption from the perspectives of possession and interaction instead of purchasing and buying. Based on the domestication of technology, Renaud and Van Biljon (2008) attempted to extend technology acceptance to the continued usage stage by distinguishing adoption stages. For their senior technology acceptance and adoption model [STAM], they focused mainly on the post-adoption behavior within three major phases: objectification, incorporation, and conversion. Specifically, objectification is the process of choosing and determining target functions and goals that will be used. This process is influenced by social influences and perceived usefulness. Incorporation is the process of implementing relevant functions by using technologies. Through experimentation and exploration users determine a product’s actual use, which is influenced by the confirmed usefulness, ease of learning and use, and facilitating conditions. Conversion is an interaction process and may lead to acceptance or abandonment. The STAM provides an example of how technology acceptance theory can be extended to the entire technology adoption process. Nevertheless, each factor of this theory has not been addressed and validated by multimethod investigations, greatly reducing its practical relevance for designers.
Based on the STAM, several studies have investigated the adoption as a continuous process. For instance, Gelderblom, Van Dyk, and Van Biljon (2010) suggested that even with many years of technology experience, older adults are still in a stage of limited use, which does not imply full adoption or rejection. Furthermore, Barnard, Bradley, Hodgson, and Lloyd (2013) attempted to explain the incorporation phase by identifying influential factors from a learning perspective. However, most previous studies have regarded the intention to use technology as a symbol of acceptance. Few studies have extended considerations of mobile technology acceptance to post-adoption behavior, a practice that is especially crucial regarding mobile technologies (Zhou et al., 2012). With numerous third-party applications provided for mobile technology, the adoption of mobile technology concerns not only starting to use it but also how people increase the number of functions that they use. Most older adults are still in the stage of initial adoption and use only elementary features and limited functions of mobile technologies (Li & Luximon, 2016). How older adults use and perceive mobile technologies after their initial adoption of these technologies remains unknown. Additionally, the aspects of user and mobile technology that designers must consider to encourage older adults who have adopted mobile technologies to learn and use more advanced functions remain to be determined.
Mobile Technology Usage Behavior
The rapid development of advanced mobile technologies that has occurred since Apple released the iPhone in 2007 (West & Mace, 2010) has made it necessary to distinguishing mobile technologies from general technologies, such as computers and feature phones. The unique feature of mobile technology acceptance and adoption lies in the adoption of functions. This fact further emphasizes the necessity to study mobile technology acceptance and adoption from a process perspective. Specifically, a possible method to further understand initial adoption and upgraded usage is investigating users’ exposure to technology and differentiating between the use of basic functions and advanced functions (Huh & Kim, 2008; Zhou et al., 2012). Specifically, users’ exposure to technology can be evaluated according to duration of use, intensity of use, and diversity of use (Hurtienne, Horn, Langdon, & Clarkson, 2013; Langdon, Lewis, & Clarkson, 2007).
Usage variety, which refers to the use of a product for different applications and in different situations, can also be an indicator of different mobile technology adoption stages. For example, Nimrod (2016) divided older adults’ mobile phone incorporation into four levels from the base to the apex of a pyramid: voice calling, basic functions, Internet-based functions, and media player functions. Older adults use mobile technologies for the same purposes and activities as younger users typically do; however, they do so in different manners and to different extents. The majority of older users are early leaners of mobile technologies who may use only basic and fundamental functions. For instance, younger users may embrace YouTube as a platform to search, watch, and share videos. Older adults may use YouTube to search for their favorite songs, but are less likely to comment or share information through this platform.
Mobile Technology User Perceptions
Many theoretical models, such as the TAM and UTAUT, suggest that an individual’s personal perceptions and attitudes are crucial predictors of technology acceptance (Venkatesh et al., 2003; Davis, Bagozzi, & Warshaw, 1989). In particular, perceived usefulness and perceived ease of use jointly determine user attitudes toward usage behaviors; these attitudes directly predict the intention to use and eventually influence actual usage. The UTAUT incorporates two more crucial factors that influence users’ behavioral intention and use behavior, namely social influence and facilitating conditions. Later, the computer self-efficacy, which refers to users’ judgments regarding their personal ability to perform a technological task, has also been considered as a determinant influencing perceived ease of use. Particularly, it is typically evaluated at two levels: the general level of using and learning mobile technologies and the specific level of using and learning new applications or functions (Mun & Huang, 2003).
Perceived usefulness and perceived ease of use determine user attitudes. Nonetheless, these effects may differ between older adults and younger adults (Chen & Chan, 2011; Pan & Jordan-Marsh, 2010). This difference can be explained by the fact that older adults and younger adults perceive a technology’s ease of use and usefulness differently. Older adults tend to perceive a technology as easy to use when they can complete a task effectively; by contrast, younger adults perceive a technology as easy to use when it helps them execute tasks efficiently (Sonderegger, Schmutz, & Sauer, 2016). Additionally, the role of perceived usefulness may become more relevant because older adults accept a technology only when they are fully aware of the technology’s usefulness and conveniences (Barnard et al., 2013). Thus, perceptions and attitudes regarding technologies have been demonstrated to be key predictors of post-adoption behavior. Perceived usefulness and social influence determine the intention to use technology in the objectification phase; whereas perceived ease of use and facilitating conditions are crucial for actual usage in the incorporation phase.
User Characteristics
Experimental research has given extensive consideration to the influence of user capability (Harada, Sato, Takagi, & Asakawa, 2013). For instance, studies have indicated that the aging process is associated with a decline in cognitive functions and visual faculties, including attention, memory, processing speed, visuospatial functioning, visual acuity, color discrimination, and contrast sensitivity, which are vital for learning new information and executing technology-based tasks (Dommes et al., 2011; Drag & Bieliauskas, 2010; Kamin & Lang, 2015). Spatial ability is believed to be particularly significant influence on menu navigation (Wagner et al., 2014; Ziefle & Bay, 2004). Processing speed and divided attention are relatively crucial for information-searching tasks that require processing information from multiple sources, especially when the tasks are related to memory involvement (Naveh-Benjamin, Guez, & Marom, 2003; Verhaeghen, Steitz, Sliwinski, & Cerella, 2003).
It is only recently that the powerful role of user characteristics has begun being highlighted in studies of technology acceptance. Czaja et al. (2006) proposed that aside from attitudinal factors, user characteristics, such as demographic characteristics, technology experience, fluid intelligence, and crystallized intelligence, are also important predictors. The UTAUT proposes a mediating role of gender, age, experience, and voluntariness in technology acceptance theories. Chen and Chan (2014) demonstrated that for older adults in Hong Kong, demographic factors, health status, capabilities, and facilitating conditions were more accurate predictors of technological acceptance than were attitudinal factors. Nevertheless, a long debate has endured between the use of self-report and performance measures to evaluate capability. The self-reporting approach used in the aforementioned studies has typically encompassed numerous subjective factors such as individual expectations and aspirations. By contrast, performance measures are more objective assessments of task ability; however, conducting them is also more complex (Johnson, Clarkson, & Huppert, 2010).
Technology Features
Studies have demonstrated that users may be initially attracted by technology features that enable them to improve their task efficiency or accomplishment rate (Birnholtz, 2010). After their initial adoption, users continually adapt their usage behavior to avoid drawbacks of the adopted technology. This continual adaptation may lead to further acceptance of the technology (e.g., users may use more functions) or to abandonment; for each user, this outcome depends on whether the technology can effectively support the user’s usage behavior and be adapted to his or her abilities. Specifically, successful technology adoption and usage depend on a satisfactory match between the user characteristics (e.g., demographic factors, technical experience, and well-being) and the specific task requirements of the technology (Fisk, Rogers, Charness, Czaja, & Sharit, 2009).
From a learning perspective, users typically start learning how to use a technology once they are aware of the advantages of using the technology to complete a specific task and have estimated the perceived difficulties of completing the task. Only when the advantages outweigh the perceived difficulties of learning do users typically begin learning and adopting a technology or function (Barnard et al., 2013). This process implies the necessity of emphasizing the usefulness of technology or lowering the perceived difficulties of the learning process. Despite this, the latter option is neglected by the theories of technology acceptance and adoption. Little is known about users’ perceived difficulties of technology features in their post-adoption behavior. Further exploring older adults’ perceived and actual learning difficulties in real-use situations is crucial.
Focus of the Current Study
The preceding discussion of the theories of technology acceptance and adoption reveals several relevant points: (a) the unique pattern of mobile technology acceptance and adoption emphasizes the importance of a process perspective; (b) scant research has investigated older adults’ usage and perceptions of mobile technology in the post-adoption stage; and (c) the roles of user capability and technology features have largely been neglected in previous studies related to technology acceptance and adoption; however, both are crucial to studying the specific population of older adults. Thus, studying the post-adoption use of mobile technology for older adults is essential.
Accordingly, this study focused on the stages of incorporation and conversion in the STAM. Three major objectives were pursued. First, the study investigated the current situations of post-adoption usage behavior among older adults by analyzing exposure to technology and usage variety in detail. Second, it investigated older adults’ perceptions and attitudes regarding post-adoption use of mobile technology by inviting participants to evaluate and discuss them freely based on several attitudinal factors derived from the acceptance models. Third, it examined the possible facilitators and barriers influencing older adults’ perceptions and usage by focusing on the influence of user characteristics and technology features. For this study, mobile technologies were defined as products providing advanced features and functions including touchscreen interfaces, Internet access, global positioning system navigation, Web browsing, downloading, and mobile apps; examples of such products include smartphones and tablets.
In contrast with the typical users of mobile technologies, older adults are generally characterized by poor literacy and declined capabilities. Thus, researchers should be cautious about the method adopted to study this specific population. In this study, both performance tests and a self-reporting method were employed to measure user capabilities. The self-reporting method was implemented in a semi-structured interview format to investigate usage behavior and user perceptions. The performance tests enabled researchers to collect plentiful of objective data. The semi-structured interview format enabled an in-depth conversation between the interviewer and participants that facilitated determining the real problems.
The study results can contribute toward refining theories of technology acceptance on the basis of adoption behavior to improve the user experience throughout the life cycle (Wyatt, 2003). This field investigation provides insights into how older adults use and perceive mobile technology in the continued usage stage. It can assist designers and practitioners in developing further design guidelines based on the critical user characteristics and technology features revealed. This is particularly crucial for encouraging older adults to begin full technology adoption, which can further help them enhance their quality of life in such areas as their social networks, security and safety, health, and entertainment.
Method
A semi-structured interview was employed to investigate participants’ mobile technology post-adoption behavior. Two interviewers who had training experience with usability studies, cognitive tests, and volunteer work with elderly people conducted the interviews. Because of the older adults’ physical limitations, the entire process took approximately 30 minutes for each participant.
Participants
Hong Kong Chinese adults who were older than 55 years and had experience using mobile technologies were recruited because studies have demonstrated that most cognitive capabilities start to decline as early as the mid-50s and then very quickly decline beginning in the 70s (Drag & Bieliauskas, 2010; Schaie, 2012). Participants were recruited from three local centers for elderly adults residing in domestic households in Hong Kong because this group is a representative sample (Census and Statistics Department, 2009). All participants reported being in good physical condition without any cognitive impairment and indicated that they could read Chinese characters.
Measurements
Four aspects were investigated during the interview: (a) user characteristics, comprising demographic factors of age, education level, and gender as well as user capabilities of short-term memory, spatial ability, processing speed and attention, and visual ability; (b) technology features; (c) usage behavior; and (d) user perceptions. The interview questions were asked in different forms and explained in detail when the older adults could not well understand them. All the interview questions are presented in the proceeding sections with different question forms demonstrated.
User Capabilities
The participants’ levels of cognitive capability and visual ability were measured through performance tests and self-reporting, respectively. First, the Mini-Cog, which is a brief test to assess older adults’ mental status, was employed because of its strong sensitivity (76%-99%) and low time requirement (3 minutes) (Borson, Scanlan, Brush, Vitaliano, & Dokmak, 2000). It comprised a clock drawing test (CDT) and a word recall test (WRT). Specifically, the CDT was used to measure the participants’ spatial dysfunction and neglect (Agrell & Dehlin, 1998) and the WRT was used to evaluate their short-term memory. The participants were first asked to memorize three unrelated words. Then, they were instructed to complete the CDT by writing appropriate numbers on a sheet with a circle to represent a clock and drawing the hands of the clock to display the time of 11:10 am. Subsequently, the participants were required to finish the WRT by repeating the three previously memorized words. The performance of all participants was recorded for further analysis. Performance in the Mini-Cog was scored from 0 to 5 points; 1 point was allotted for each recalled word and 2 points were given if all the numbers were presented in the correct sequence and position and the hands legibly displayed the requested time. In this study, a total score of 0-2 indicated that the participant had experienced a noteworthy cognitive decline.
Second, the Symbol Digit Modalities Test (SDMT) was employed to test the participants’ processing speeds and attention levels (Benedict et al., 2012). Specifically, this test involved presenting a coding key system in the format of a table to the participants. The coding table contained nine abstract symbols. Under the nine symbols, there was a paired number between one and nine, with each number being assigned to each symbol. During the test, the participants were provided a different test table with all the symbols randomly arranged within it. In 90 seconds, the participants were required to scan the abstract symbols in the coding table and fill in as many of the corresponding paired numbers as possible in the test table. The coding table was always presented to the participants during the test to reduce the influence of memory. The score was based on the number of correctly matched symbols.
Finally, a self-report visual ability evaluation was employed to determine the older adults’ daily visual abilities in reading texts and detecting targets on physical and display-based materials. It addressed three abilities, namely the visual ability to read texts on paper (VAP), the visual ability to complete tasks that require close observation (VAO), and the visual ability to read texts on digital displays (VAD).
Technology Features
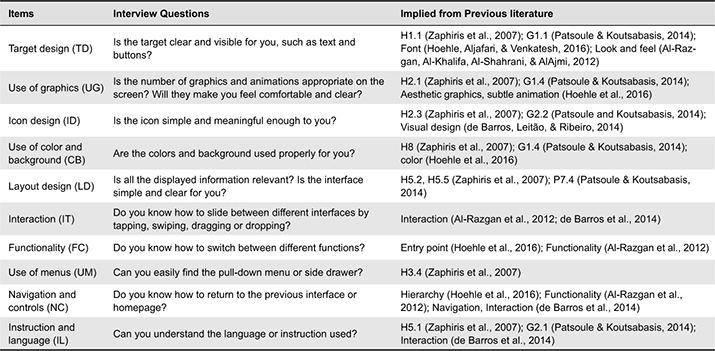
A major concern for designers is matching technology features with older adults’ unique characteristics and limitations. In consideration of older adults’ capabilities and requirements for technology use, numerous design guidelines have been proposed for different usage contexts and technologies (Kurniawan & Zaphiris, 2005; Zaphiris, Kurniawan, & Ghiawadwala, 2007). To further understand users’ perceived difficulties with technology features in their post-adoption behavior, we encouraged the participants to share their difficulties, concerns, and worries about mobile technology use and collected all explanations and comments for further analysis. To compensate for the possibility of missing any details caused by self-reporting, we summarized a set of problems and difficulties related to mobile technology use based on established guidelines. We also elaborated on the questions by reminding the participants of some related scenarios and cases they might experience in daily use. After selection and abstraction, 10 topics were extracted, namely target design, use of graphics, icon design, use of color and background, layout design, interaction, functionality, use of menus, navigation and controls, and instruction and language, as listed in Table 1. In response to the interview questions, the participants verbally evaluated each technology feature on a 5-point Likert scale from strongly disagree to strongly agree.
Table 1. Interview questions on technology features.
Usage Behavior
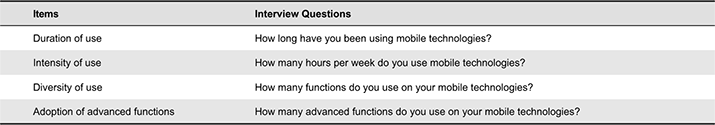
For usage behavior, four subcomponents were investigated, as listed in Table 2: duration of use, intensity of use, diversity of use, and adoption of advanced functions. Specifically, duration of use describes the length of time during which a product is used; the intensity of use describes the frequency with which a product is used; and diversity of use describes the number of different functions used or tasks completed with the product. Older adults’ adoption of advanced functions was also examined to further differentiate between the practices of initial adoption and upgraded usage. Specifically, basic functions mainly refer to native applications such as calls, messages, the camera, the daily alarm, and the calendar (Huh & Kim, 2008; Nimrod, 2016), whereas advanced functions refer to third-party applications, which were classified into five categories based on the most commonly used computer and Internet functions, namely social communication, leisure and entertainment, information searching, health care, and online purchasing (Wagner, Hassanein, & Head, 2010). Functions and applications used by the participants were identified and recorded.
Table 2. Interview questions on usage behavior.
User Perceptions
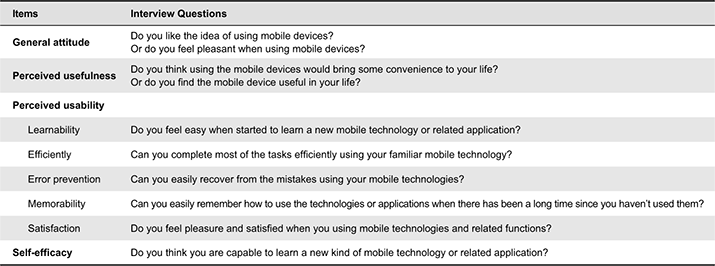
The older adults were invited to evaluate and discuss the following perception attributes, all of which were derived from the aforementioned models and theories (see Table 3): (a) general attitude referred to older adults’ positive or negative feelings about using mobile technologies and was related to the attitude toward use in the TAM; (b) perceived usefulness, which is similar to the construct of perceived usefulness from the TAM and STAM, as well as the performance expectancy of the UTAUT, was evaluated by asking the participants whether using mobile technologies could enhance their performance and bring convenience to their daily life; (c) perceived usability (learnability, efficiency, error prevention, memorability, and satisfaction), which is related to the perceived ease of use from the TAM, effort expectancy of the UTAUT, and ease of learning and use from the STAM, addressed the degree of ease of use in more detail based on five constructs; and (d) self-efficacy was evaluated in terms of the participants’ judgments of their capabilities in using and learning new mobile technologies or functions. The interview questions aimed to elicit a deeper understanding of how older adults perceive mobile technologies from the perspectives of personal feelings, beliefs, and technology themselves. The participants responded verbally on a 5-point Likert scale ranging from strongly disagree to strongly agree. All relevant comments were recorded for further analysis.
Table 3. Interview questions on user perceptions.
Data Analysis
A descriptive analysis was conducted on user characteristics, technology features, usage behavior, and user perceptions. A Spearman correlation analysis was then performed to evaluate the correlations between different variables of these four aspects. Furthermore, a multiple regression analysis with a stepwise inclusion specification was employed to ascertain factors of user characteristics and technology features associated with older adults’ post-adoption behavior.
Results
Characteristics of Participants
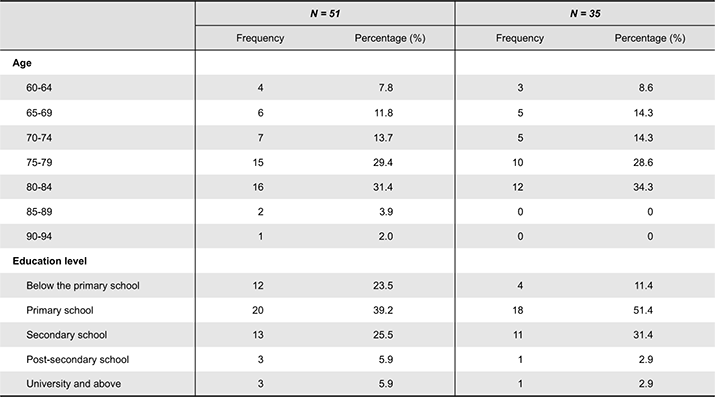
A total of 51 Hong Kong Chinese older adults (12 males and 39 females) with an average age of 75.92 years old (age range: 61 to 90 years; SD = 6.98) participated in the section of user characteristics investigation. The participants reported a range of education levels from below primary school to university and above, with a median education level of primary school. Among them, 35 older adults were willing to continue with the subsequent interview sections regarding technology features, usage behavior, and user perceptions. These 35 participants comprised 7 males and 28 females with an average age of 75.06 years old (age range: 61 to 84 years; SD = 6.58). The age distribution generally followed a similar pattern to that of the 51 participants. Their median education level was also primary school. The frequency distributions of age and education levels are presented in Table 4. Although the participants had a wide range of education levels, the majority of participants (62.7% for 51 participants and 62.8% for 35 participants) reported an education level of primary school or below, which conforms to the average for Hong Kong older adults (69.0%) reported by the Census and Statistics Department (2013).
Table 4. Age and education level distributions.
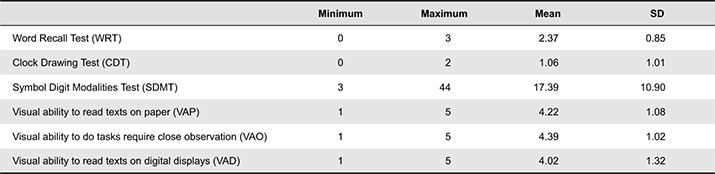
The descriptive statistics for the capability assessment are listed in Table 5. The results of the cognitive capability tests indicated that the WRT, CDT, and SDMT means were 2.37, 1.06, and 17.39, respectively. In addition, most participants reported no difficulty or only slight difficulties when reading texts on paper (82.3%), engaging in daily tasks (84.3%), and reading texts on digital displays (76.5%). Although the older adults tended to have more difficulties when recognizing characters on digital displays, they seemed to have no severe visual problems when wearing corrective lenses, with 23.5% of the participants reporting a medium to high level of difficulty.
Table 5. Descriptive statistics on the capability assessment (N = 51).
Based on the in-depth discussions, we determined several major problems that troubled older adults. First, one of the most frequently reported problems was related to declining vision. Although no severe problems were indicated from the self-report evaluations, some of the participants complained that the long-term use of digital screens made them feel uncomfortable and was inconvenient. Another frequently reported problem concerned poor memory. For example, some participants easily forgot the functions and uses of icons, buttons, and menus. In addition, several participants mentioned problems due to poor literacy.
Technology Features
The participants verbally evaluated ten categories of technology features on 5-point Likert scales. When discussing the problems and difficulties the older adults had experienced, we observed that the older adults had difficulty identifying specific aspects related to technology features. Most of the comments were related to technology features concerned perceptions of the features as too complex, such as “these technologies are too changeable and complex for us” or “the design should be simplified, otherwise it means nothing for us.” The older adults also tended to attribute their difficulties to personal reasons, for example, by stating, “I could not easily find the buttons or targets just because I don’t know how to.” Some of them also ascribed their difficulties to their cautiousness, stating, for example, “I’m afraid to click the button because I’m afraid to make mistakes” or “I don’t know what the buttons are used for and where I will go if I press them.” These results can help to reveal more details about different technology features.
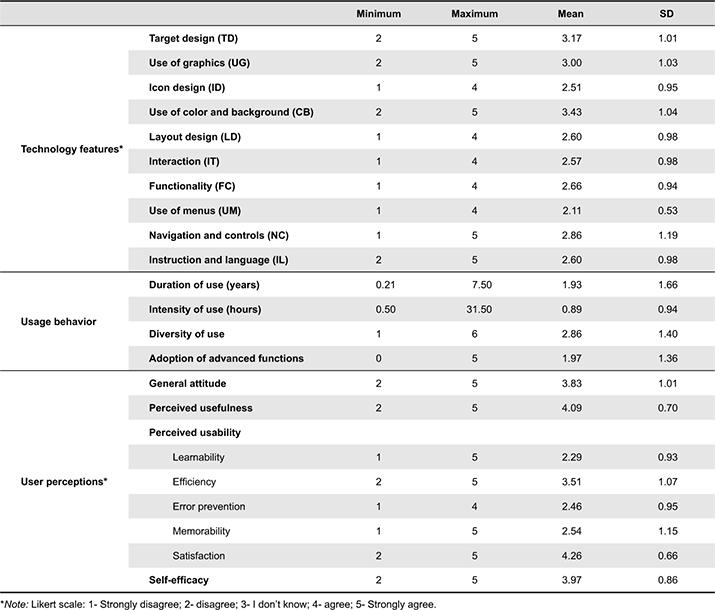
The lowest evaluation of technology features was related to the use of menus, with 91.4% of the participants reporting a high or medium level of difficulty for this feature. The second lowest evaluation was for icon design, with 68.6% of the participants perceiving a high or medium level of difficulty for this feature. The remaining features are listed in descending order of the percentage of participants experiencing a high or medium level of difficulty as follows: interaction difficulty related to sliding between interfaces (65.7%), difficulty understanding instructions and language (97.1%), difficulty with layout design (62.9%), functionality difficulty related to switching between functions (60.0%), navigation and controls difficulty related to returning to the home page (51.4%), difficulty with the use of graphics (54.3%), difficulty with target design (45.7%), and difficulty with the use of color and background (34.3%). The corresponding detailed statistics are listed in Table 6.
Table 6. Descriptive statistics on technology features, usage behavior, and user perceptions (N = 35).
Although the related comments from older adults were broad to some extent, some valuable insights were obtained. For example, some of the participants complained about having difficulty finding target functions such as specific menus or the point of entry of functions. Typical answers included “It’s difficult to find those menus and functions” or “I could not find the apps that other people have downloaded for me.” Another problem reported was related to mistakes and recovery. Many participants were worried that making mistakes by clicking the wrong buttons was easy and recovering from these mistakes by themselves was difficult.
Usage Behavior
As shown in Table 6, the results indicated a wide use of mobile technologies among older adults. Among the 35 participants interviewed, many used both smartphones (88.6%) and tablets (62.9%) in daily life. For these older adults, the duration of advanced mobile technology adoption was 1.93 years (SD = 1.67). A total of 77.3% of the older adults had adopted mobile technologies for less than two years. Regarding their current usage behaviors, the participants used mobile technologies 0.89 hours per day (SD = 0.94). Usage was categorized as low intensity, which was defined as usage for fewer than 0.5 hours per day (45.7%); medium intensity, which was defined as usage for 0.5-2 hours per day (40.0%); and high intensity, which was defined as usage for 2-5 hours per day (14.3%). On average, the participants used 2.86 (SD = 1.40) functions, including 1.97 (SD = 1.36) advanced functions. A total of 14.3% of the participants used only basic functions such as calls, messages, the camera, the daily alarm, and the calendar. Most of the participants (85.7%) had adopted the advanced functions for hobbies and entertainment (60.0%); social interaction (51.4%); information, learning, and education (51.4%); health care and wellness (28.6%); and other purposes (5.7%). Among the older adults who adopted the advanced functions, 30% of them used only one advanced function, 33.3% of them adopted two functions simultaneously, and 36.7% adopted three or more functions.
User Perceptions
For the interviews, four attributes of user perceptions were investigated using 5-point Likert scales, and the related comments were analyzed. Detailed descriptive statistics are listed in Table 6. Of the older adults, 80.0% indicated positive attitudes toward advanced mobile technology for reasons such as the willingness to learn new things or the enjoyment of playing games on mobile technology. Moreover, 91.5% of the participants believed that advanced mobile technologies offer a high degree of usefulness and convenience. These beliefs were primarily based on feelings of convenience instilled by friends and family, as indicated by statements such as “It seems to be very convenient because my family members can play games and search for traffic routes using smartphones, and I also want to learn.” Some older adults also perceived that mobile technologies are useful due to the so-called social tendency, as indicated by statements such as “It’s about the tendency to chase new technologies.”
Regarding perceived usability, the older adults’ evaluations were generally lower than those for perceived usefulness as well as their overall attitudes. As shown in Table 6, the participants gave the lowest evaluation to the learnability of technology, followed by error prevention, memorability, efficiency, and satisfaction. According to discussions, the usability problems were attributed to two aspects. First, as mentioned, the technologies seemed to be quite complicated for the older adults. Second, due to poor memory, decreased vision, and poor literacy, the older adults tended to perceive the technologies as difficult to use. When the participants were asked about their self-efficacy in learning and using technologies, most of them (85.8%) reported medium to high levels. However, some participants were hesitant about their capability to use and learn mobile technologies because of their declined capabilities and patience.
Correlations among Variables
Within User Characteristics and Technology Features
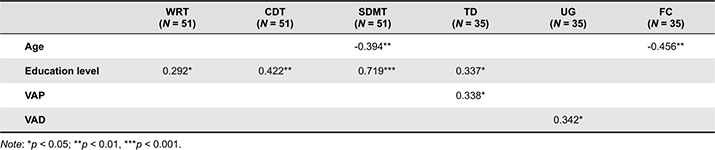
Before identifying the factors related to post-adoption usage and perceptions, possible interrelationships within user characteristics and technology features were examined using the Spearman test. The results indicated several significant correlations, including a moderate negative correlation between age and processing speed and attention (p = 0.004). Additionally, educational levels were weakly positively correlated with short-term memory (p = 0.038), moderately positively correlated with spatial ability (p = 0.002), and highly positively correlated with processing speed and attention (p = 0.000), as illustrated in Table 7. However, no significant correlation was observed between demographic factors and visual abilities. In addition, correlations between user characteristics and technology features were analyzed. Some significant correlations were identified, including several weak positive correlations between target design and VAP (p = 0.047), target design and education level (p = 0.048), and the use of graphics and VAD (p = 0.044), as well as a moderate negative correlation between functionality and age (p = 0.006).
Table 7. Significant correlation coefficients (r) for user characteristics and technology features.
Within Usage Behavior and User Perceptions
The relationships between usage behavior and user perceptions were analyzed using the Spearman test. The participants’ diversity of use was marginally and positively correlated with their general attitude toward mobile technologies (r = 0.332; p = 0.051). In addition, significant positive correlations were observed between usage behavior and perceived usability. For instance, perceived efficiency was moderately correlated with duration of use (r = 0.370; p = 0.028) and perceived memorability was moderately correlated with intensity of use (r = 0.364; p = 0.031).
Between User Characteristics, Technology Features, and Usage Behavior
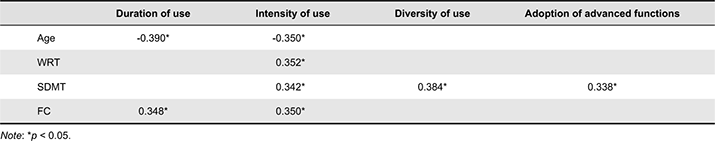
The Spearman test was also used to identify the relationships between demographic factors and usage behavior. Several significant correlations were identified. The results indicated that the participants’ duration of use (p = 0.020) was moderately negatively correlated with their age and intensity of use (p = 0.039) was weakly negatively correlated with their age. Because a marginally significant correlation was observed between education level and diversity of use, the Mann-Whitney test was employed to examine the differences between two educational groups: lower than high school and high school and above. The results indicated that diversity of use differed significantly (U = 78.500, p = 0.024) between these two groups. Specifically, older adults with higher education levels had a significantly greater diversity of use (mean rank = 22.960) compared with those with lower education levels (mean rank = 15.070).
With respect to user capability, the Spearman test indicated some significant correlations. For example, intensity of use was moderately positively correlated with strength of short-term memory (p = 0.038), and weakly positively correlated with processing speed and attention (p = 0.044). Diversity of use (p = 0.023) was moderately positively correlated with processing speed and attention and adoption of advanced functions (p = 0.047) was weakly positively correlated with processing speed and attention. The full statistics are listed in Table 8. However, the correlations between technology features and usage behavior were not significant, except for the significant but weak correlations between functionality difficulty and duration of use (p = 0.040) as well as functionality difficulty and intensity of use (p = 0.039).
Table 8. Significant correlation coefficients (r) between user characteristics, technology features, and usage behavior (N = 35).
Between User Characteristics, Technology Features, and User Perceptions
Correlations regarding user perceptions, including general attitude, perceived usefulness, perceived usability, and self-efficacy, were examined using Spearman correlation analysis. The results indicated some significant correlations between user perceptions and user capabilities (see Table 9). The perceived usefulness of mobile technologies was moderately positively correlated with the participants’ VAP (p = 0.022) and weakly positively correlated with the participants’ VAO (p = 0.048). Significant correlations were also observed among cognitive capability, visual ability, and perceived usability. Specifically, perceived efficiency was moderately positively correlated with processing speed and attention (p = 0.025) and VAP (p = 0.031), perceived memorability was weakly positively correlated with VAO (p = 0.045), and satisfaction was weakly negatively correlated with spatial ability (p = 0.044). Although demographic factors were significantly correlated with usage behavior and cognitive capabilities, no direct correlation was observed between the participants’ demographic factors and user perceptions regarding postadoption behavior.
Table 9. Significant correlation coefficients (r) between user characteristics, technology features, and user perceptions (N = 35).
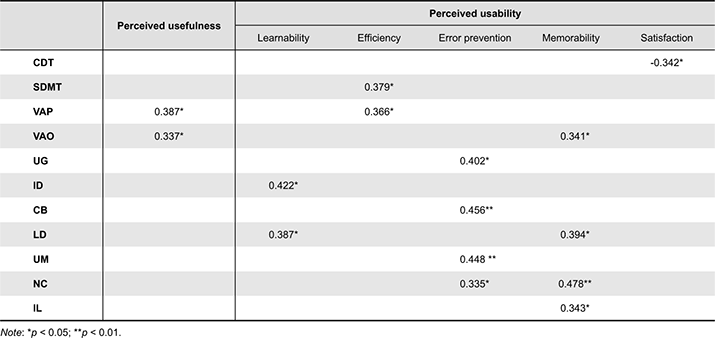
Significant correlations between user perceptions and technology features were also analyzed using the Spearman test, with the results being shown in Table 9. No significant relationship was reported between general attitude, perceived usefulness, self-efficacy, and technology features; however, some significant correlations existed between technology features and perceived usability. Particularly, learnability was moderately positively correlated with icon design (p = 0.012) and layout design (p = 0.022). Error prevention exhibited moderate to weak positive relationships with the use of color and background (p = 0.006), use of menus (p = 0.007), use of graphics (p = 0.017), and navigation and controls (p = 0.049). Additionally, memorability was moderately positively correlated with navigation and controls (p = 0.004) and layout design (p = 0.019), and weakly positively correlated with instruction and language (p = 0.044).
Factors Associated with Post-adoption Behavior
A stepwise multiple regression was performed to explore the set of variables that contributed most significantly to the variance in the dependent variables of usage behavior and user perceptions. The tolerance value and variance inflation factor (VIF) were used to detect the multicollinearity problem. The collinearity statistics indicated that none of the variables had a tolerance value lower than 0.01 and VIF higher than 5. This indicated that the regression models had no multicollinearity problem (Hair, Black, Babin, Anderson, & Tatham, 2006).
Four multiple regressions were performed for duration of use, intensity of use, diversity of use, and adoption of advanced functions; however, no regression equation was developed for the adoption of advanced functions. Table 10 presents the final regression models that indicated significant associations using standardized coefficients (β). The proposed user characteristics and technology features explained 36.1% of the variance regarding duration of use, 24.5% of the variance regarding intensity of use, and 11.6% of the variance regarding diversity of use. Specifically, the regression models indicated that age and the use of menus were significantly associated with the duration of use of mobile technology. The participants who were older tended to use mobile technologies for a short duration (β = -0.489, p = 0.003), and the use of menus (β = 0.349, p = 0.019) was significantly and positively associated with duration of use. Furthermore, the technology features of functionality (β = 0.462, p = 0.007) and use of menus (β = -0.334, p = 0.043) appeared to be the strongest factors associated with intensity of use of mobile technologies. In addition, the capabilities of processing speed and attention had a significant positive influence on diversity of use (β = 0.341, p = 0.045).
Table 10. Standardized coefficients of stepwise regression analysis concerning usage behavior and user perceptions (N = 35).
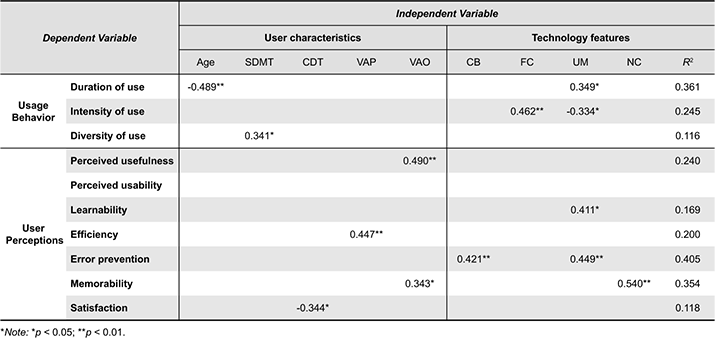
Eight multiple regressions were performed for general attitude, perceived usefulness, five constructs of perceived usability, and self-efficacy; however, no regression equation was developed for the general attitude and the self-efficacy. The final regression models that indicated significant associations are listed in Table 10. Specifically, VAO (β = 0.490, p = 0.003) was significantly and positively associated with perceived usefulness and could explain 24.0% of the variance in this dependent variable. Use of menus (β = 0.411, p = 0.014) positively influenced perceived learnability and could explain 16.9% of the variance in this dependent variable. Users with a more acute VAP (β = 0.447, p = 0.007) tended to perceive mobile technologies as more efficient, and VAP could explain 20.0% of the variance in perceived efficiency. Regarding the regression of perceived error prevention, use of menus (β = 0.449, p = 0.003) and use of color and background (β = 0.421, p = 0.004) were significantly and positively associated with users’ perceived error prevention and could explain 40.5% of the variance in this dependent variable. Navigation and controls (β = 0.540, p = 0.001) and users’ VAO (β = 0.343, p = 0.023) were observed to positively influence perceived memorability and explained 35.4% of the variance in this variable. Additionally, spatial ability (β = -0.334, p = 0.043) was determined to be significantly and negatively associated with perceived satisfaction and could explain 11.8% of the variance in this dependent variable.
Other Findings from the Interviews
This study also investigated any facilitators and barriers mentioned by the participants during discussions. We classified some typical topics mentioned by the participants into six categories: lifestyle, personal concerns, expected benefits of technology, concerns regarding technology, social influences, and facilitating conditions (Peek et al., 2014), as listed in Table 11. The frequently reported facilitators of adopting new mobile technologies or functions included a positive lifestyle, interest in technology, perceived benefits according to others’ or personal experience, and obvious improvements of technology. The influence of family and friends and requirements for independence were observed to encourage the older adults’ use of mobile technologies. Some related comments are listed as follows: “My grandchildren persuaded me to use this mobile application, so that they can send me pictures” and “Once I learned more about the mobile technologies, I could search for information by myself and no longer bother my daughter.”
Table 11. Additional findings from the interviews.
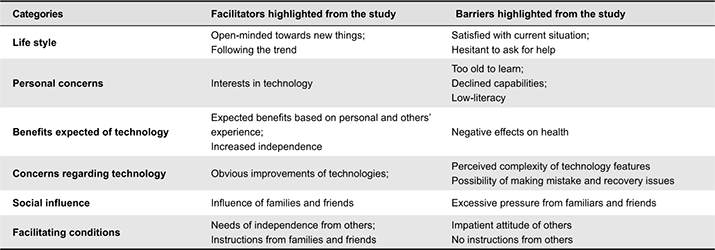
The older adults talked considerably more about their barriers and concerns than about the facilitators. Some of the comments are provided in the preceding sections and relate to topics such as decreased expectations regarding the technology’s applicability in life, the perceptions of being too old to learn, concerns about declined capabilities and poor literacy, and perceived difficulties related to using technology features. The findings highlight some noteworthy points. For instance, excessive pressure from family and friends can easily hamper older adults’ technology adoption. Older adults also tend to become frustrated when their family members are too busy or too impatient to teach them. In such cases, older men are hesitant to ask for help and talk about their difficulties. Some comments are listed as follows: “Sometimes I asked my son to help me. I felt frustrated when he was impatient,” “I felt embarrassed if I asked a lot questions. Gradually, I lost interest,” and “I feel annoyed because all of my family members asked me to learn how to use a smartphone.” Additionally, several older adults expressed concerns about the negative effects of mobile technologies.
Discussion
Mobile Technology Usage Behavior
Advanced mobile technology is commonly used by older adults in Hong Kong. In this study, more than 77.2% of participants were older than 70 years. Smartphones and tablets are the two major mobile technologies used in daily life. Although most of the older adults in the study were still in the stage of early adoption of less than two years, most of them had adopted advanced functions. They were aware of the opportunities to improve their quality of life that mobile technologies offer, mainly for entertainment, communication, and learning. This finding is consistent in part with that of previous studies focusing on everyday technologies (Chen & Chan, 2014; Mitzner et al., 2010) that indicated that older adults were willing to use technologies in a wide range of domains for home, work, and health. Nonetheless, the findings did not conform to the pattern of the traditional mobile phone usage (Renaud & Van Biljon, 2008), which is limited to a minimal set of functions. This may be due to the features of advanced mobile technologies, such as a simple interaction mode and high mobility and security, facilitate the use of mobile technologies by older adults. Social influences, particularly pressure from family and friends, may also affect older adults’ behavioral intention to adopt mobile technologies in the objectification stage (Renaud & Van Biljon, 2008; Venkatesh et al., 2003). However, compared with younger users who have embraced mobile technologies enthusiastically, the older adults did not spend as much time and did not adopt the same diverse range of functions. Thus, investigating possible factors involved throughout the post-adoption process is still necessary.
The role of user characteristics was investigated in the present study. Although the STAM considers only the factors of user context in the objectification phase, the influence of user characteristics on post-adoption behavior was determined in the current study (see Table 8 and Table 10). The results indicated that age was negatively associated with the duration of mobile technology use and negatively correlated with the intensity of mobile technology use. Furthermore, diversity of use was correlated positively with education level, which may be because people with higher education levels are typically more motivated to accept new concepts (Chen & Chen, 2014; Pan & Jordan-Marsh, 2010). In addition, the findings are consistent with those of previous studies that suggested that higher fluid and crystallized intelligence can predict a broader range of technology use (Chen & Chan, 2014; Czaja et al., 2006; Werner, Carlson, Jordan-Marsh, & Clark, 2011). Declining cognitive capabilities, such as memory and processing speed and attention, may inhibit older adults from frequently using mobile technologies. Particularly, declined processing speed and attention negatively influenced the older adults’ diversity of use of mobile technologies, thus slowing the progression from initial adoption to upgraded usage behavior.
Previous studies have undertaken extensive investigations of technology features that may affect usability through interviews and focus groups of users and designers, from which numerous research-based guidelines have been derived (Kurniawan & Zaphiris, 2005; Zaphiris et al., 2007). However, designers may be concerned more about critical features than they are about applying all the relevant guidelines. We investigated the relationships and associations between technology features and usage behavior to identify the possible influences of different features (see Table 8 and Table 10). Our findings indicated that functionality was especially influential on duration and intensity of use. If older adults can access or switch between different functions with ease, they may use mobile technologies longer and more frequently. The use of menus also matters. Older adults tend to use mobile technologies for a longer duration when they believe that the menus are easier to find. However, they may try more times when the menus are difficult to access because menus are an unavoidable feature of mobile technology usage. Thus, designers should treat the technology features related to navigation carefully, such as functionality and use of menus.
Mobile Technology User Perceptions
Stereotypically, older adults are negatively biased toward technology and are less likely to use advanced technologies (Cazja et al., 2006; Saunders, 2004). However, our results indicated that the older adults’ attitudes toward advanced mobile technologies were relatively positive (see Table 6 and Table 11). In accordance with some related studies, we determined that people with an active lifestyle tend to positively embrace technology acceptance (Werner et al., 2011). For instance, some participants stated that they enjoyed discovering new functions and playing games with their smartphone. To a large extent, the older adults perceived the usefulness and benefits of advanced mobile technologies, either based on their own use experience or on observations of others’ experience. However, some of the participants still reported that they were occasionally frustrated with mobile technology because it was very complex and easily damaged. Older males were not as positive as older females were toward technology use. This may be because Chinese older males are typically more unwilling to ask for help and are resistant to learning new things (Zhou et al., 2012). Together with the findings of other relevant studies (Goddard & Nicolle, 2012; Mitzner et al., 2010), the present study indicated that the majority of older adults were neither unable nor unwilling to use advanced technologies. Instead, they were considerably interested in and had positive attitudes toward technology use; however, they reported that mobile technology is not suitably designed for their requirements and capabilities. To further understand the reasons behind users’ perceptions of these technologies, this study analyzed in detail the influences of user characteristics and technology features.
Though most of the participants reported normal vision with corrective lenses, long-term use situations and the negative effects of wearing corrective lenses should be considered (see Table 10). The self-reported vision declines largely hampered the older adults’ perceived usefulness of mobile technologies; however, others’ positive experiences can increase older adults’ awareness of the advantages of using mobile technologies, such as completing tasks more efficiently. Nevertheless, no significant relationship was observed between age-related decline in capabilities and the older adults’ general attitudes and self-efficacy, in agreement with the findings of previous studies (Chen & Chan, 2014). This may be due to the general enthusiasm for all technology use and the wide use of mobile technologies among older adults in Hong Kong during recent years.
Researchers have suggested that perceived ease of use is highly influential in technology acceptance (Arning & Ziefle, 2007), especially for the progression from the usage to the conversion phases in the STAM (Renaud &Van Biljon, 2008). The present study provides details about older adults’ perceived usability based on five constructs: learnability, efficiency, error prevention, memorability, and satisfaction. Most of the older adults in this study reported difficulties and problems of varying extents in their post-adoption behavior, implying that current technologies are still not sufficiently inclusive. Specifically, obstacles to learnability, error prevention, and memorability were the most substantial difficulties pertaining to mobile technology. Mobile technology appears to be quite complex and changeable to older adults, which is especially problematic in their learning processes. A possible reason is that older adults are quite cautious in their operations and behavior when using technologies, causing them to seldom apply a trial-and-error strategy in learning. However, the older adults in the present study indicated high levels of perceived efficiency once they became familiar with advanced mobile technologies and reported high levels of satisfaction.
Age-related capability declines were found to be significantly related to the older adults’ perceived usability of mobile technologies in the present study (see Table 9 & Table 10). The results are consistent with those of previous studies that have shown physical and cognitive capabilities to be positive predictors of usage of computers and general technologies (Chen & Chan, 2014; Gell, Rosenberg, Demiris, LaCroix, & Patel, 2013; Werner et al., 2011). Particularly, declines in VAP and VAO were detrimental to the older adults’ perceived efficiency and memorability of mobile technologies, respectively. Declined processing speed and attention may also harm older adults’ perceived efficiency of mobile technologies, as indicated by these two being positively correlated. Nevertheless, diminished spatial ability was significantly associated with a higher level of satisfaction, which may be interesting to explore in a future study. This association may be attributable to two aspects. First, the older adults’ subjective feelings, such as satisfaction, strongly varied between individuals and may be mediated by other factors (Wagner et al., 2014). Second, the CDT is highly sensitive to severe spatial ability decline; thus, the scores become dichotomous and may not completely reflect the trend of spatial ability decline.
As suggested by a related study (Barnard et al., 2013), the learning process is a critical stage for older adults to move from the incorporation phase toward the conversion phase. Users adopt a technology only when their perceived advantages of using the technology outweigh their perceived difficulties of learning it. In the present study, the lowest evaluations of technology features were related to the use of menus and icon design; pull-down menu use was particularly problematic. The results also indicated that technology features were significantly associated with perceived usability (see Table 9 & Table 10). For example, icon design and layout design were significantly correlated with the older adults’ perceptions of difficulties in the learning process. If a design is intended to prevent system errors, the use of colors and graphics, use of menus, use of graphics, and the navigation and controls must be carefully considered because these technology features were significantly correlated or associated with perceived error prevention. To improve the memorability of systems and interfaces, designers should pay close attention to navigation and controls, layout design, and instructions and language, because these factors significantly influenced or correlated with older adults’ perceived memorability. The implications for designers regarding the specific technology features are discussed in the last section.
Usage Behavior and User Perceptions in the Post-adoption Behavior
This study obtained a unique perspective on older adults’ post-adoption behavior on the basis of usage behavior and user perceptions. This perspective corresponds with the incorporation and conversion stages in the STAM. For instance, through the STAM, Ranaud and Van Biljon (2008) confirmed the importance of perceived usefulness and ease of use to the actual use of mobile technologies. The results of this study partly support these findings. Significant correlations were observed between the participants’ perceptions and usage behavior in the post-adoption process. Older adults who perceived mobile technologies as offering high levels of efficiency used the mobile technologies for longer periods. Those who perceived mobile technologies as offering high levels of memorability used mobile technologies more frequently. In addition, a positive attitude may be related to the usage of more functions. These results are also consistent with those of related empirical studies, such as Arning and Ziefie (2007), who observed a significant correlation between performance and perceived ease of use.
The results also suggested that usage behavior regarding mobile technologies was not affected by the participants’ self-efficacy. This result is in disagreement with the finding by Chen and Chan (2014) that self-efficacy directly affects general technology usage and the UTAUT model (Venkatesh et al., 2003), which indicates that self-efficacy is mediated by perceived ease of use and indirectly affects the use of technology. In this study, most participants first reported that they were confident about learning new things. However, many reported negative attitudes during the interviews. This might be because older adults desire to contribute to their society (Sayers, 2004) and tend to have a positive mindset when expressing feelings about their experiences (Dickinson, Arnott, & Prior, 2007). In this context, interviews are useful for discovering participants’ real perspectives and feelings. If different approaches are used to ask each question and different approaches are employed to understand the answers, the validity and trustworthiness of the research can be enhanced in future studies (Seidman, 2013).
Usage behavior and user perceptions might interact. This interaction may not be a simple causal relationship but rather an iterative process. For instance, older adults’ initial adoption behavior first determines their perceptions of mobile technologies. These user perceptions in turn affect how the older adults plan to use the mobile technologies in the future, such as whether they continue the current usage behavior, upgrade usage behavior, or abandon the technology. Future studies should further confirm the causal relationships in this interaction.
Implication for Designers
Understanding user characteristics is a critical step for designers because design decisions affect later user tests and evaluations. This study indicates that user capabilities are critical for older adults’ perceptions and usage of mobile technology in the post-adoption process. Although efforts have been made to address the requirements and capabilities of older adult users, the evaluation process is still complicated because of low accessibility and numerous difficulties when conducting capability measurements for this specific population (Johnson et al., 2010; Tenneti, Johnson, Goldenberg, Parker, & Huppert, 2012). In the current study, demographic factors and cognitive capabilities exhibited some interactive relationships. Particularly, all the cognitive capabilities tested in this study were determined to be positively correlated with the participants’ education level. Therefore, after combining the current results with those of related studies (Biswas, 2015; Wagner et al., 2014), designers may consider age and education level to be predictors of older adults’ cognitive capabilities. Doing so can contribute toward the further prediction of mobile technology post-adoption behavior.
This study indicates that older adults experience numerous difficulties in the use of menus. Previous studies have mainly attributed the decline of spatial abilities as responsible for older adults being unable to accurately construct a mental model of menu structures (Wagner et al., 2014; Ziefle & Bay, 2006). Accordingly, researchers have suggested that a deep menu is not suitable for older adults and a menu with fewer than 2.1 levels may be more easily recalled. The results of the present study suggested that the older adults experienced difficulty in navigating pull-down menus and side menus. This may be because older adults typically have difficulty in finding navigation items (Etcheverry, Baccino, Terrier, Marquié, & Mojahid, 2012). Furthermore, previous studies have shown that older adults can maintain strong crystallized intelligence, causing them to focus more on the semantic meanings of content-oriented objects rather than on navigation items (Etcheverry, Terrier, & Marquié, 2012; Fang & Holsapple, 2007). They can perform as well as younger users can regarding content-oriented searching. Thus, a possible solution for improving use of menus for older adults is to first avoid the use of pull-down menus and sider drawers or to provide labeled information for the entry of these menus.
With the development of advanced mobile technologies, most navigation patterns have become flat and broad. The commonly used drill-down views keep the hierarchy at two levels (Hoehle et al., 2016). Although this pattern requires less from users regarding their building of correct mental models of application structures, it produces more distractions with more information being accessed simultaneously and requires higher processing speed and divided attention. Consequently, the older adults reported numerous difficulties regarding sliding between interfaces, switching between functions, and returning to homepages in the present study. Thus, we suggest that a linear navigation pattern is more suitable for older adults because it can reduce the amount of distraction and better facilitate their declined processing speed and attention (Castilla et al., 2016; Puerta Melguizo, Vidya, & van Oostendorp, 2012). In addition, the hierarchy of content is reflected not only by the hierarchy of applications but also by the application layout itself. Users perceive the navigation structures in the scene and layout when they first see the mobile interface (Koch & Oulasvirta, 2016). Thus, the layout design should guide older adults’ attention and focus appropriately. Future studies should further investigate how linear navigation could serve as a more suitable design pattern for older adults using mobile technology.
The older adults were observed as being very cautious about clicking the icons and buttons in this study. Although many related studies have suggested improving older adults’ performance by manipulating different icon characteristics, such as size, color, semantic distance, concreteness, and location (Kacmar & Carey, 1991; Leung, McGrenere, & Graf, 2011), the results of this study indicated that the older adults mainly experienced difficulties in accessing the functionality of the icons and buttons (Gudur, Blackler, Popovic, & Mahar, 2009). Accordingly, designers are suggested to use redundant information to describe the functionality of the buttons to reduce the cognitive load on older adults using mobile technologies (Feinberg & Murphy, 2000). Additionally, this study demonstrated that the use of simple wording in a native language is helpful for older adults with poor literacy (Zhou et al., 2012).
Conclusion
Previous research has mainly investigated how older adults use technologies from two distinct perspectives, namely technology acceptance before the objectification phase and usability problems after the conversion phase. Little research about older adults’ post-adoption behavior within the incorporation phase has been conducted. The examination of technology acceptance in the continued usage stage clarified which user characteristics may prevent older adults from full adoption and which technology features make mobile technology more likely to be perceived as easy to use and thus lead to advanced adaptation. Overall, the results provide a theoretical basis for researchers and designers to develop further guidelines to encourage full adoption behavior in older adults. Thus, designers can gain a more comprehensive understanding of older adults’ post-adoption use of mobile technology.
Some future research directions were identified in this study. First, different attitudes were noticed between males and female. However, the sample did not balance the numbers of males and females. Future research should explore the applicability of the results to different genders. Second, this study provides a starting point for studying older adults’ post-adoption behavior from a process perspective. We considered older adults in different adoption stages by evaluating their technology exposure and usage variety. Nevertheless, continuous investigation on different stages of the adoption process is lacking. Further research should investigate post-adoption behavior by tracking a specific user group and analyzing the users’ usage patterns and perceptions in different stages. Additionally, we employed the self-report method to evaluate older adults’ perceived difficulties regarding technology features in this study in order to capture a broad perspective of technology contexts and collect richer data on real-use situations. We acknowledge a lack of more details regarding each technology feature. On the basis of the current findings, future research should examine older adults’ post-adoption behavior for each specific technology feature.
Acknowledgments
The authors would like to thank The Hong Kong Polytechnic University for providing funding through the University Grants Commission funding scheme.
References
- Agrell, B., & Dehlin, O. (1998). The clock-drawing test. Age and Ageing, 27(3), 399-404.
- Al-Razgan, M., Al-Khalifa, H., Al-Shahrani, M., & AlAjmi, H. (2012). Touch-based mobile phone interface guidelines and design recommendations for elderly people: A survey of the literature. In Huang T., Zeng Z., Li C., Leung C. S. (Eds), Neural information processing. ICONIP 2012. Lecture Notes in Computer Science (vol 7666, pp. 568-574). Berlin, Germany: Springer. https://doi.org/10.1007/978-3-642-34478-7_69
- Arning, K., & Ziefle, M. (2007). Understanding age differences in PDA acceptance and performance. Computers in Human Behavior, 23(6), 2904-2927.
- Barnard, Y., Bradley, M. D., Hodgson, F., & Lloyd, A. D. (2013). Learning to use new technologies by older adults: Perceived difficulties, experimentation behaviour and usability. Computers in Human Behavior, 29(4), 1715-1724.
- Benedict, R. H., Smerbeck, A., Parikh, R., Rodgers, J., Cadavid, D., & Erlanger, D. (2012). Reliability and equivalence of alternate forms for the symbol digit modalities test: Implications for multiple sclerosis clinical trials. Multiple Sclerosis Journal, 18(9), 1320-1325.
- Birnholtz, J. (2010). Adopt, adapt, abandon: Understanding why some young adults start, and then stop, using instant messaging. Computers in Human Behavior, 26(6), 1427-1433.
- Biswas, P. (2015). Survey on inclusive human machine interaction issues in India. In P. Biswas, C. Duarte, P. Langdon, & L. Almeida (Eds.), A multimodal end-2-end approach to accessible computing (pp. 23-41). Berlin, Germany: Springer.
- Borson, S., Scanlan, J., Brush, M., Vitaliano, P., & Dokmak, A. (2000). The mini-cog: A cognitive ‘vital signs’ measure for dementia screening in multi-lingual elderly. International Journal of Geriatric Psychiatry, 15(11), 1021-1027.
- Castilla, D., Garcia-Palacios, A., Miralles, I., Breton-Lopez, J., Parra, E., Rodriguez-Berges, S., & Botella, C. (2016). Effect of web navigation style in elderly users. Computers in Human Behavior, 55(part B), 909-920.
- Census and Statistics Department (2009). Thematic household survey report - Report no.40 - socio-demographic profile, health status and self-care capability of older persons. Retrieved from http://www.censtatd.gov.hk/hkstat/sub/sp160.jsp?productCode=C0000071
- Census and Statistics Department. (2013). Thematic report: Older persons. Retrieved from http://www.census2011.gov.hk/pdf/older-persons.pdf
- Chen, K., & Chan, A. H. S. (2011). A review of technology acceptance by older adults. Gerontechnology, 10(1), 1-12.
- Chen, K., & Chan, A. H. S. (2014). Gerontechnology acceptance by elderly Hong Kong Chinese: A senior technology acceptance model (STAM). Ergonomics, 57(5), 635-652.
- Chevalier, A., Dommes, A., & Marquié, J. C. (2015). Strategy and accuracy during information search on the web: Effects of age and complexity of the search questions. Computers in Human Behavior, 53, 305-315.
- Chung, J., Chaudhuri, S., Le, T., Chi, N. C., Thompson, H. J., & Demiris, G. (2015). The use of think-aloud to evaluate a navigation structure for a multimedia health and wellness application for older adults and their caregivers. Educational Gerontology, 41(12), 916-929.
- Czaja, S. J., Charness, N., Fisk, A. D., Hertzog, C., Nair, S. N., Rogers, W. A., & Sharit, J. (2006). Factors predicting the use of technology: Findings from the center for research and education on aging and technology enhancement (CREATE). Psychology and Aging, 21(2), 333-352.
- Davis, F. D., Bagozzi, R. P., & Warshaw, P. R. (1989). User acceptance of computer technology: A comparison of two theoretical models. Management Science, 35(8), 982-1003.
- de Barros, A. C., Leitão, R., & Ribeiro, J. (2014). Design and evaluation of a mobile user interface for older adults: Navigation, interaction and visual design recommendations. Procedia Computer Science, 27, 369-378.
- Dickinson, A., Arnott, J., & Prior, S. (2007). Methods for human-computer interaction research with older people. Behaviour & Information Technology, 26(4), 343-352.
- Dommes, A., Chevalier, A., & Lia, S. (2011). The role of cognitive flexibility and vocabulary abilities of younger and older users in searching for information on the web. Applied Cognitive Psychology, 25(5), 717-726.
- Drag, L. L., & Bieliauskas, L. A. (2010). Contemporary review 2009: Cognitive aging. Journal of Geriatric Psychiatry and Neurology, 23(2), 75-93.
- Elliot, A. J., Mooney, C. J., Douthit, K. Z., & Lynch, M. F. (2014). Predictors of older adults’ technology use and its relationship to depressive symptoms and well-being. The Journals of Gerontology Series B: Psychological Sciences and Social Sciences, 69(5), 667-677.
- Etcheverry, I., Baccino, T., Terrier, P., Marquié, J. C., & Mojahid, M. (2012). Age differences in information finding tasks: Performance and visual exploration strategy with different web page layouts. Computers in Human Behavior, 28(5), 1670-1680.
- Etcheverry, I., Terrier, P., & Marquié, J. C. (2012). Are older adults less efficient in making attributions about the origin of memories for web interaction? Revue Européenne de Psychologie Appliquée, 62(2), 93-102. https://doi.org/10.1016/j.erap.2010.11.002
- Fang, X., & Holsapple, C. W. (2007). An empirical study of web site navigation structures’ impacts on web site usability. Decision Support Systems, 43(2), 476-491.
- Feinberg, S., & Murphy, M. (2000). Applying cognitive load theory to the design of web-based instruction. In Proceedings of the 18th Conference on Computer Documentation (pp. 353-360). Piscataway, NJ: IEEE. http://doi.org/10.1109/IPCC.2000.887293
- Fischer, S. H., David, D., Crotty, B. H., Dierks, M., & Safran, C. (2014). Acceptance and use of health information technology by community-dwelling elders. International Journal of Medical Informatics, 83(9), 624-635.
- Fisk, A. D., Rogers, W. A., Charness, N., Czaja, S. J., & Sharit, J. (2009). Designing for older adults: Principles and creative human factors approaches (2nd ed.). Boca Raton, FL: CRC press.
- Gao, Q., Ebert, D., Chen, X., & Ding, Y. (2015). Design of a mobile social community platform for older Chinese people in urban areas. Human Factors and Ergonomics in Manufacturing & Service Industries, 25(1), 66-89.
- Gelderblom, H., Van Dyk, T., & Van Biljon, J. (2010). Mobile phone adoption: Do existing models adequately capture the actual usage of older adults? In Proceedings of the Research Conference of the South African Institute of Computer Scientists and Information Technologists (pp. 67-74). New York, NY: ACM.
- Gell, N. M., Rosenberg, D. E., Demiris, G., LaCroix, A. Z., & Patel, K. V. (2013). Patterns of technology use among older adults with and without disabilities. The Gerontologist, 55(3), 412-421.
- Goddard N., & Nicolle C. (2012). What is good design in the eyes of older users? In P. Langdon, J. Clarkson, P. Robinson, J. Lazar, & A. Heylighen (Eds.), Designing inclusive systems (pp. 175-183). Berlin, Germany: Springer.
- Gudur, R. R., Blackler, A. L., Popovic, V., & Mahar, D. P. (2009). Redundancy in interface design and its impact on intuitive use of a product in older users. Paper presented at the IASDR Conference, Coex, Seoul, South of Korea. Retrieved from https://eprints.qut.edu.au/28513/1/28513.pdf
- Hair, J., Black, W., Babin, B., Anderson, R., & Tatham, R. (2006). Multivariate data analysis (Vol. 6). Upper Saddle River, NJ: Prentice hall.
- Harada, S., Sato, D., Takagi, H., & Asakawa, C. (2013). Characteristics of elderly user behavior on mobile multi-touch devices. In Proceedings of the Conference on Human-Computer Interaction (pp. 323-341). Berlin, Germany: Springer.
- Hoehle, H., Aljafari, R., & Venkatesh, V. (2016). Leveraging Microsoft’s mobile usability guidelines. International Journal of Human-Computer Studies, 89(C), 35-53.
- Huh, Y. E., & Kim, S. H. (2008). Do early adopters upgrade early? Role of post-adoption behavior in the purchase of next-generation products. Journal of Business Research, 61(1), 40-46.
- Hurtienne, J., Horn, A. M., Langdon, P. M., & Clarkson, P. J. (2013). Facets of prior experience and the effectiveness of inclusive design. Universal Access in the Information Society, 12(3), 297-308.
- Jeong, K. A., Salvendy, G., & Proctor, R. W. (2010). Smart home design and operation preferences of Americans and Koreans. Ergonomics, 53(5), 636-660.
- Johnson, D., Clarkson, J., & Huppert, F. (2010). Capability measurement for inclusive design. Journal of Engineering Design, 21(2-3), 275-288.
- Kacmar, C. J., & Carey, J. M. (1991). Assessing the usability of icons in user interfaces. Behaviour & Information Technology, 10(6), 443-457.
- Kamin, S. T., & Lang, F. R. (2015). Cognitive functions buffer age differences in technology ownership. Gerontology, 62(2), 238-246.
- Koch, J., & Oulasvirta, A. (2016). Computational layout perception using gestalt laws. In Proceedings of the Conference on Human Factors in Computing Systems (EA, pp. 1423-1429). New York, NY: ACM.
- Kurniawan, S., & Zaphiris, P. (2005). Research-derived web design guidelines for older people. In Proceedings of the 7th International Conference on Computers and Accessibility (pp. 129-135). New York, NY: ACM.
- Langdon, P., Lewis, T., & Clarkson, J. (2007). The effects of prior experience on the use of consumer products. Universal Access in the Information Society, 6(2), 179-191.
- Lee, C., & Coughlin, J. F. (2015). Older adults’ adoption of technology: An integrated approach to identifying determinants and barriers. Journal of Product Innovation Management, 32(5), 747-759. https://doi.org/10.1111/jpim.12176
- Leung, R., McGrenere, J., & Graf, P. (2011). Age-related differences in the initial usability of mobile device icons. Behaviour & Information Technology, 30(5), 629-642.
- Li, Q., & Luximon, Y. (2016). Older adults and digital technology: A study of user perception and usage behavior. In R. S. Goonetilleke & W. Karwowski (Eds.), Advances in physical ergonomics and human factors (pp. 155-163). Berlin, Germany: Springer.
- Mitzner, T. L., Boron, J. B., Fausset, C. B., Adams, A. E., Charness, N., Czaja, S. J., …Sharit, J. (2010). Older adults talk technology: Technology usage and attitudes. Computers in Human Behavior, 26(6), 1710-1721.
- Mun, Y. Y., & Hwang, Y. (2003). Predicting the use of web-based information systems: Self-efficacy, enjoyment, learning goal orientation, and the technology acceptance model. International Journal of Human-Computer Studies, 59(4), 431-449.
- Naveh-Benjamin, M., Guez, J., & Marom, M. (2003). The effects of divided attention at encoding on item and associative memory. Memory & Cognition, 31(7), 1021-1035.
- Nimrod, G. (2016). The hierarchy of mobile phone incorporation among older users. Mobile Media & Communication, 4(2), 149-168.
- Page, T. (2014). Touchscreen mobile devices and older adults: A usability study. International Journal of Human Factors and Ergonomics, 3(1), 65-85.
- Pan, S., & Jordan-Marsh, M. (2010). Internet use intention and adoption among Chinese older adults: From the expanded technology acceptance model perspective. Computers in Human Behavior, 26(5), 1111-1119.
- Patsoule, E., & Koutsabasis, P. (2014). Redesigning websites for older adults: A case study. Behaviour & Information Technology, 33(6), 561-573.
- Peek, S. T., Wouters, E. J., van Hoof, J., Luijkx, K. G., Boeije, H. R., & Vrijhoef, H. J. (2014). Factors influencing acceptance of technology for aging in place: A systematic review. International Journal of Medical Informatics, 83(4), 235-248.
- Puerta Melguizo, M. C., Vidya, U., & van Oostendorp, H. (2012). Seeking information online: The influence of menu type, navigation path complexity and spatial ability on information gathering tasks. Behaviour & Information Technology, 31(1), 59-70.
- Renaud, K., & Van Biljon, J. (2008). Predicting technology acceptance and adoption by the elderly: A qualitative study. In Proceedings of the Research Conference of the South African Institute of Computer Scientists and Information Technologists on IT Research in Developing Countries (pp. 210-219). New York, NY: ACM. http://doi.org/10.1145/1456659.1456684
- Rogers, E. M. (1995). Diffusion of innovations (4th ed.). New York, NY: Free Press.
- Saunders, E. J. (2004). Maximizing computer use among the elderly in rural senior centers. Educational Gerontology, 30(7), 573-585.
- Sayers, H. (2004). Desktop virtual environments: A study of navigation and age. Interacting with Computers, 16(5), 939-956.
- Schaie, K. W. (2012). Developmental influences on adult intelligence: The Seattle longitudinal study (2nd ed.). Oxford, UK: Oxford University Press.
- Seidman, I. (2013). Interviewing as qualitative research: A guide for researchers in education and the social sciences (4th ed.). New York, NY: Teachers college press.
- Sheng, X., & Simpson, P. M. (2015). Health care information seeking and seniors: Determinants of Internet use. Health Marketing Quarterly, 32(1), 96-112.
- Silverstone, R., & Haddon, L. (1996). Design and the domestication of information and communication technologies: Technical change and everyday life. In R. Mansell & R. Silverstone (Eds.), Communication by design: The politics of information and communication technologies (pp. 44-74). Oxford, UK: Oxford University Press.
- Sonderegger, A., Schmutz, S., & Sauer, J. (2016). The influence of age in usability testing. Applied Ergonomics, 52, 291-300.
- Tenneti, R., Johnson, D., Goldenberg, L., Parker, R. A., & Huppert, F. A. (2012). Towards a capabilities database to inform inclusive design: Experimental investigation of effective survey-based predictors of human-product interaction. Applied Ergonomics, 43(4), 713-726.
- van der Wardt, V., Bandelow, S., & Hogervorst, E. (2010). The relationship between cognitive abilities, well-being and use of new technologies in older people. In Proceedings of the 28th European Conference on Cognitive Ergonomics (pp. 333-334). New York, NY: ACM.
- Venkatesh, V., Morris, M. G., Davis, G. B., & Davis, F. D. (2003). User acceptance of information technology: Toward a unified view. MIS Quarterly, 27(3), 425-478.
- Verhaeghen, P., Steitz, D. W., Sliwinski, M. J., & Cerella, J. (2003). Aging and dual-task performance: A meta-analysis. Psychology and Aging, 18(3), 443-460.
- Wagner, N., Hassanein, K., & Head, M. (2010). Computer use by older adults: A multi-disciplinary review. Computers in Human Behavior, 26(5), 870-882.
- Wagner, N., Hassanein, K., & Head, M. (2014). The impact of age on website usability. Computers in Human Behavior, 37, 270-282.
- Werner, J. M., Carlson, M., Jordan-Marsh, M., & Clark, F. (2011). Predictors of computer use in community-dwelling, ethnically diverse older adults. Human Factors, 53(5), 431-447. https://doi.org/10.1177/0018720811420840
- West, J., & Mace, M. (2010). Browsing as the killer app: Explaining the rapid success of Apple’s iPhone. Telecommunications Policy, 34(5), 270-286.
- Wyatt, S. M. E. (2003). Non-users also matter: The construction of users and non-users of the Internet. In N. Oudshoorn & T. Pinch (Eds.), Now users matter: The co-construction of users and technology (pp. 67-79). Cambridge MA: MIT Press.
- Zaphiris, P., Kurniawan, S., & Ghiawadwala, M. (2007). A systematic approach to the development of research-based web design guidelines for older people. Universal Access in the Information Society, 6(1), 59-75.
- Zhou, J., Rau, P. L. P., & Salvendy, G. (2012). Use and design of handheld computers for older adults: A review and appraisal. International Journal of Human-Computer Interaction, 28(12), 799-826.
- Ziefle, M., & Bay, S. (2004). Mental models of a cellular phone menu. Comparing older and younger novice users. In Proceedings of the International Conference on Mobile Human-Computer Interaction (pp. 25-37). Berlin, Germany: Springer. http://doi.org/10.1007/978-3-540-28637-0_3
- Ziefle, M., & Bay, S. (2006). How to overcome disorientation in mobile phone menus: A comparison of two different types of navigation aids. Human-Computer Interaction, 21(4), 393-433.
