
Auditory and Visual Contributions to Affective Product Quality
Elif Özcan 1,*, Gerald C. Cupchik 2 , and Hendrik N. J. Schifferstein 1
1 Department of Industrial Design, Delft University of Technology, Delft, The Netherlands
2 Department of Psychology, University of Toronto at Scarborough, Scarborough, ON, Canada
A product has multiple sensory properties, each of which can be evaluated on its affective quality. In the current study, we investigated differences in the evaluation of the affective quality of auditory and visual product appearances and their potential contribution to the overall (auditory-visual) affective quality of domestic appliances. We used rating items based on theories of basic affect (pleasure, arousal and dominance). From the cognitive perspective, we further investigated whether memory performance (i.e., concretely recalling concepts pertaining to product use) also differed between individual unisensory product experiences (visual or auditory) and multisensory product experiences (auditory-visual). The results firstly indicate that users’ individual experiences of product appearances (auditory or visual) of daily domestic appliances evoke different affective and cognitive responses. Secondly, the results indicate that visual product appearance mainly influences how pleasing products are perceived while auditory product appearance mainly influences how powerful products are perceived. Thirdly, the results indicate that a product presented as a multisensory object (auditory-visual) can evoke as many memory associations as its auditory property alone. The implications for multisensory design are further discussed.
Keywords – Affective Quality, Auditory-Visual Interactions, Multisensory, Product Experience, Sensory Property, Sound Design.
Relevance to Design Practice – In design practice, affective product quality is investigated either holistically or through visual product properties. Auditory and visual product properties play a complementary, but different role in human-product interactions and product experiences. This study offers design practitioners and researchers a detailed account of how sensory product properties, either individually or in combination, shape affective reactions and cognitive responses to products.
Citation: Özcan, E., Cupchik, G. C., & Schifferstein, H. N. J. (2017). Auditory and visual contributions to affective product quality. International Journal of Design, 11(1), 35-50.
Received May 8, 2015; Accepted January 31, 2017; Published April 30, 2017.
Copyright: © 2017 Özcan, Cupchik, & Schifferstein. Copyright for this article is retained by the authors, with first publication rights granted to the International Journal of Design. All journal content, except where otherwise noted, is licensed under a Creative Commons Attribution-NonCommercial-NoDerivs 2.5 License. By virtue of their appearance in this open-access journal, articles are free to use, with proper attribution, in educational and other non-commercial settings.
*Corresponding Author: e.ozcan@tudelft.nl
Elif Özcan is an Assistant Professor in the Faculty of Industrial Design Engineering at the Delft University of Technology where she is connected to the Sound Design Lab, Perceptual Intelligence Lab and Delft Institute for Positive Design. Her research interests include the mental processes underlying product experiences involving sounds and sound-embedded objects. She has been part of several European doctoral research activities (Cognovo.eu, an EU Marie Curie initiative, DocARTES studies in music and arts) and commercial projects (auditory display design for Toyota Motors Europe, European Space Agency). She is an author of 40 peer-reviewed papers (a.o., Acta Psychologica, Journal of the Audio Engineering Society, Sound Effects and International Journal of Design) and in 2014 was a guest editor to the Journal of Sonic Studies. Her recent research focuses on alarm fatigue in medical contexts and auditory/multimodal display design for autonomous vehicles. She is a member of alarm coalition initiated by AAMI in the US and has European collaborations with St. Gallen Geriatric Hospital (CH) and Erasmus Medical Centre (NL) for innovation in alarm management. Özcan is co-chair for the 10th edition of DeSForM/2017, a conference on multisensory design and research.
Gerald Cupchik completed his undergraduate studies at the University of Michigan (1967), received his Masters (1970) and PhD (1972) from the University of Wisconsin and did postdoctoral research at the University of Toronto where he has been a professor of psychology since 1974. He was president of the International Association for Empirical Aesthetics (1990-94), APA Division 10 Psychology and the Arts (1996-97), the International Society for the Empirical Study of Literature and Media (1998-2000) and received the Rudolf Arnheim Award in 2010 from the APA. He recently published The aesthetics of emotion: Up the down staircase of the mind-body (Cambridge University Press). His research interests cover design and imagination processes, emotional experience and social communication.
Rick (H.N.J.) Schifferstein is Associate Professor at the Faculty of Industrial Design Engineering of Delft University of Technology. His topics of interest include (multi)sensory perception, food design and experience-driven innovation. He has contributed to more than 60 papers in international scientific journals, including Acta Psychologica, Food Quality and Preference, Chemical Senses, Materials & Design and International Journal of Design. He is principal editor of the International Journal of Food Design and co-editor of the books Food, People and Society (2001), Product Experience (2008), From Floating Wheelchairs to Mobile Car Parks (2011) and Advanced Design Methods for Successful Innovation (2013). With his company Studio ZIN, he facilitates workshops that stimulate the innovative and creative powers of people and organizations.
Introduction
Interactions with products inherently facilitate a multisensory experience with a certain quality (Özcan & van Egmond, 2009; Schifferstein & Spence, 2008). Based on this experience, people can exhibit an affective response. For example, if a person encounters a Harley Davidson motorbike going down the road with a wild roaring sound and colorful, adventurous look, they may get excited in response to their experience of the motorbike and feel a desire for it. What triggers these feelings during a multisensory product interaction may be unclear. With the example of the Harley Davidson, is it the wild sound, the adventurous look, or the combination of both that elicits ‘excitement’ and consequently ‘desire’? Recent studies propose the design for sensory experiences (e.g., visual design, sound design) as a suitable strategy for creating pleasurable products (Lageat, Czellar, & Laurent, 2003; MacDonald, 2002; Özcan, 2014; Peck & Childers, 2008; Schifferstein & Desmet, 2008). A common assumption is that a carefully designed product sound or product image will tackle the sensory pleasure and thus positively influence the overall appreciation of the product. However, combining a number of pleasant stimuli does not necessarily result in a desirable product experience (Schifferstein, Otten, Thoolen, & Hekkert, 2010). Therefore, it is essential for designers to be aware of the fundamental differences in the way potential users affectively respond to single sensory properties of a product and the product as a whole (Schifferstein & Cleiren, 2005; Schifferstein & Desmet, 2007).
In this paper, we empirically study the affective qualities of auditory and visual product experiences, particularly how the affective qualities of unisensory product experiences contribute to the affective quality of the overall product experience. A further interest is discovering whether modality interactions (auditory-visual) take place when evaluating the affective quality of the multisensory product experience. Our scope for auditory product appearance (i.e., product sounds) is limited by consequential sounds, which are defined as machinery sounds that are an immediate consequence of active and functioning products (shavers, cars, espresso machines, water kettles) as well as human-product interactions (Fog & Pedersen, 1999; Langeveld, Egmond, Jansen, & Özcan, 2013; van Egmond, 2008). Within this category, we choose to study the sounds of small sized domestic appliances such hairdryers, mixers and toothbrushes.
Product Sounds & Sound Design
Sound is an integral part of a product, being considered a product property in design terms. Since any product with moving parts can produce sounds, designers have the freedom and possibilities to design the sound of a product through engineering solutions (e.g., mechanical). Some sound relevant product design decisions might include replacing a gear mechanism with a quieter one, using foam and tight closures for dampening or noise cancelling, or altering the product mechanism for less friction in moving parts. The practice of sound design is more commonly seen if the sound is thought to threaten the overall desired impression that a product needs to make on the user (Özcan & van Egmond, 2006; van Egmond 2008). Traditionally, sound has been considered as noise to be either canceled or improved through mechanical and acoustical analyses and construction (Lyon, 2000; Sottek, 2008; Susini, McAdams, Winsberg, Perry, Vieillard, & Rodet, 2004). Recently, with the increasing knowledge and tools in the field of experience-driven design, the sounds of products are being designed to be pleasant and congruent with a desired product experience (Alt & Jochum, 2003; Fenko, Schifferstein, & Hekkert, 2011; Ludden & Schifferstein, 2007). The application of sound design can be found in a wide range of designed objects such as foods (e.g., cracking sound of chocolate covered ice-creams), their packaging (e.g., crunchy crisp packages), car interiors (e.g., electric cars using synthesized engine sound for informing car drivers), car engines (e.g., sportscars denoting power), car doors (e.g., a full body impact sound indicating sophistication in engineering), household appliances (e.g., vacuum cleaners that are powerful, but silent or noise management of air-conditioning devices) and even architectural spaces such as lecture or music halls (e.g., their acoustic quality and how it should fit in the function of the room) (Altinsoy, Gül, & Kuyumcuoglu, 2016; Horvat, Domitrovi, & Jambrošić, 2012; Ih, Lim, Shin, & Park, 2003; Kantono et al., 2016; Kortchmar, Vorländer, & Slama, 2001; Nor, Fouladi, Nahvi, & Ariffin, 2008; Ohtomi, & Hosaka, 2012; Parizet, Guyader, & Nosulenko, 2008; van Dorp Schuitman, 2011; Västfjäll, Gulbol, & Kleiner, 2003; Vickers, 1983).
Product sounds are largely characterized with negative user emotions, that is, many machinery sounds such as shavers, vacuum cleaners and hand blenders are described as unpleasant (more specifically, irritating, disturbing and intrusive) due to their inherent spectral-temporal structure being constant, long, loud, noisy, or sharp and rough. Accordingly, the primary task of design teams is often to investigate and determine first what in the sound evokes an unpleasant experience and secondly trace the unpleasant sound back in the product mechanism or its functional architecture. Several methods are suggested to evaluate the pleasantness and the semantic associations of products (Blauert & Jekosch, 2012; Hülsmeier, Schell-Majoor, Rennies, & van de Par, 2014; Lyon, 2003; Susini, Lemaitre, & McAdams, 2012). With such efforts, designers aim to increase auditory pleasantness and the perceived quality of the sounds so that the ‘product’ can be appreciated, highly valued and is eventually usable.
The sensory properties of a product are almost always simultaneously experienced, more specifically, perceived, attributed meaning to and emotionally responded. Accordingly, a well-designed product sound elevates brand value, making it more sophisticated and trustworthy (Lageat et al., 2003; Miller & Mills, 2012; Thomson, 2016). Visit, for example, http://www.bmwblog.com to read how BMW as a company benefits from the special attention given to designing a sporty car-door closing sound. In the BMW example, it is evident that designers base their sound-relevant decisions on the semantic characteristics of the visual product appearance. However, such inherent relationships between the sensory product properties can sometimes be misleading for designers as they may believe that visual product property plays the most important part in determining design decisions pertaining to semantic associations and affective quality (i.e., sensory pleasure and emotions). Furthermore, in their daily interactions with products, users do not attempt to distinguish the source of feelings and associations if both auditory and visual product properties are designed to be semantically and affectively congruent; if the sensory product properties evoke incongruent experiences, users may more clearly identify the source of the more (un)pleasant experience. Such blended experience is especially a concern for sensory profiling and sensory evaluation of products, as designers lack insights and tools that can guide them in granular analysis of product experiences and their potential to systematically influence and determine the quality of affective product experiences. This paper aims to demonstrate to the (sound) design and research community the distinct, but complementary nature of sensory experiences.
Affective Quality
Similar to the Harley Davidson motorbike example, people encounter countless man-made objects (e.g., cars, air-conditioners, epilators, mixers) that have the potential to evoke affective experiences as a result of the (multi)sensory processing of the product. There is empirical evidence supporting that any sensory property of a product (e.g., auditory loudness, shape, flavour of food) can modulate affective experiences (Asutay et al., 2012; Schifferstein & Hekkert, 2011; Spence & Gallace, 2011; Seo & Hummel, 2011). For example, round shapes are found to be more gentle and harmonious than angular shapes (Becker, van Rompay, Schifferstein, & Galetzka, 2011; Zhang, Feick, & Price, 2006). Highly saturated colors are associated with perceptions of stimulus intensity (Schifferstein & Tanudjaja, 2004; Valdez & Mehrabian, 1994). Sharp sounds enhance the crispiness of potato crisps and make them more enjoyable (Zampini & Spence, 2004). Affective experiences mainly pertain to valenced feelings (i.e., pleasure) towards a certain stimulus and eventually influence behaviour (Russell, 2003). For example, the rough sound of an epilator scares people (i.e., avoidance in behavior) regardless of how pleasant and approachable its visual appearance is (i.e., soft and calm) and the loud and piercing sound of an espresso machine is considered positive (i.e., powerful) and invites for interaction.
Pleasantness is agreed to be the main component of affective responses to objects, arousal (excitement, activity, stimulation) and dominance (potency, power) being the other two characteristic components indicated by a long history of research (Mehrabian, 1996; Osgood, 1966; Russell, 1980; Russell, 2003; Wundt, 1896). Accordingly, Russell and Mehrabian’s (1977) PAD model (Pleasure, Arousal, Dominance) not only explains how affect is physically experienced and bodily expressed, but also how people verbally communicate the affective attributes of objects, events and people. Pleasure indicates how pleased a person feels and refers to positive/negative assessment (i.e., valence or hedonic tone) of a feeling caused by a person’s current condition. For example, hearing harmonic sounds or touching soft textures can make people feel pleasant; therefore, such objects/events can be described as pleasant or pleasing. Arousal indicates how intense the experienced feeling is and how this feeling stimulates a person and refers to the extent of being active in and responsive to a situation. For example, loud and piercing alarm sirens or a fast approaching car have the ability to startle people and put them in a defensive or active position, whereas soft rustling leaves or smoothly closing doors may go unnoticed and thus require no action. Dominance indicates how powerful a person feels and refers to the feelings of being in control of or influential towards a situation. For example, the constant and determined sound or heavy weight of a drill can empower people to operate the device more confidently. In our experimental set-up, we are interested in measuring the affective quality of the products through the pleasure, arousal and dominance dimensions of affect.
The affective quality in this sense refers to the potential of the product to elicit an affective experience through its (multi)sensory properties. Thus, we are interested in the affective quality of products and the affective quality of their auditory and visual appearances (i.e., the product is …) rather than “I feel …” statements pertaining to affective experiences. In the remainder of the paper, we adjust the terminology for product evaluation purposes. Accordingly, pleasure (how pleased a user feels) becomes ‘pleasing’ (how pleasing a product or its sensory property is), arousal (how intense and stimulated a user feels) becomes ‘stimulating’ (how stimulating a product or its sensory property is) and dominance (how powerful a user feels) becomes ‘powerful’ (how empowering a product or its sensory property is).
Affective Qualities Attributed to (Multi-)Sensory Stimuli
The affective quality of product sounds (mixers, dental-drills, shavers) is generally situated on the negative side of the pleasantness dimension (Özcan & van Egmond, 2012; Özcan, van Egmond, & Jacobs, 2014). The sensory unpleasantness caused by products can be explained as the following; the sounds of domestic appliances are predominantly experienced as loud and noisy and sometimes sharp and sometimes rough. Similarly, sounds that have high values of loudness, sharpness, roughness and noisiness are generally shown to cause unpleasant sensations (Zwicker & Fastl, 1999). Bergman, Sköld, Västfjäll, and Fransson (2009) state that auditory (un)pleasantness is primarily determined by the perceived loudness, whereas arousal is mainly determined by perceived sharpness. Product sounds (e.g., drills, mixers, espresso machines) inherently have such undesirable acoustical qualities. However, Özcan (2014) argues that more positive affective evaluation could be facilitated either by improved sound quality (e.g., less loud or less rough) or by associations to positively laden meanings, which trigger additional cognitive processes. For example, the sounds of a Nespresso machine can be highly praised due to prior exposure to advertisements promoting the ‘sophisticated’ nature of Nespresso brand, although the internal auditory properties of the Nespresso machine would psychoacoustically indicate an unpleasant sensation.
For visual product properties, it is more complicated to aggregate the causes of the affective evaluation of structural product properties. Visual product properties are organized in more complex ways than auditory product properties in the sense that visual product properties may contain many variables to be considered at the same time (e.g., shape, geometry, colour, texture, etc.). Basically, people seek pleasure in sensory experiences (for sound see Bregman, 1990) and prefer visual objects that comply with perceptual rules (proportion, unity, symmetry, etc.) of object organization and visual aesthetics (Ramachandran & Hirstein, 1999).
Research into the multisensory interactions between sound and vision is scarce for products. Schifferstein and Cleiren (2005) demonstrated that each sensory product property serves a different function and sensory impressions are often complementary (although maybe redundant in sensory information provided) in the way users deal with products on a daily basis. For example, when preventing people from seeing a product, a considerable proportion of the product-related information is lost and task difficulty and duration typically increase up to the point at which simple tasks can no longer be completed without help from another person (Schifferstein & Desmet, 2007). For instance, when blind-folding participants, the time needed to vacuum a carpet increased on average from 78 to 152 s, whereas when they wore earplugs and headphones playing white noise, the task duration did not significantly increase. Overall, visual information is very useful for people in indicating how they can operate and interact with a product. In general, visual information seems to be linked most directly to factual knowledge stored in the memory about a product, such as information about the way it has been produced, region of origin and safety considerations (e.g., Hinton & Henley, 1993). As regards auditory perception, Schifferstein and Desmet (2007) found that blocking the sense of hearing primarily resulted in communication problems in that people felt cut-off from the outside world. Analogously, one might perhaps expect that sounds play an important role in communicating factual information about products, but the empirical studies indicate that product sounds play only a limited role in our functional interaction with products (Schifferstein & Cleiren, 2005; Schifferstein & Desmet, 2007). Nonetheless, product sounds may affect the emotional product expression.
In a study on lamps employing Osgood’s three dimensions of affective meaning, Schifferstein et al. (2010) found indications that sound manipulations (hearing either colliding bells or nuts in the lamp’s body during movements) can affect both pleasantness and potency judgments, whereas colour manipulations (blue versus green appearance) affected all three dimensions, including the activity dimension. Özcan and Schifferstein (2014) demonstrated that varying the auditory quality of products altered both the visual and the overall pleasantness of the products. These authors increased/decreased the auditory pleasantness of the sounds by altering the frequency component and overall loudness and verified the respective positive/negative change by participants through psychoacoustic measurements. When products (domestic appliances) were presented with the original, the pleasant or the unpleasant versions of the sounds, the visual pleasantness of products increased with the presence of sounds, where overall (auditory-visual) pleasantness of products decreased. While the original and the unpleasant sounds had a negative effect, the pleasant sounds generally had a positive effect on visual and overall pleasantness. One reason for this effect is that with the addition of more sensory properties, perhaps the image of the products became more alive, that is, realistic and believable. In other words, the addition of sound increased the baseline for the visual pleasantness of the products. However, overall pleasantness judgments needed to rely on the quality of the sound as well as the image of the product. Thus, inherently unpleasant product sounds decreased the baseline for the overall pleasantness judgments.
As regards the effects of product sounds on overall product evaluations, Spence and Zampini (2006) conclude in their review that sounds provide semantic contributions to the overall product experiences based on auditory quality judgments. In the review, several examples are given, varying from the food and beverages to domestic appliances. For example, the sound quality of the crunchy crisps, the hard breaking sound of the chocolate topping of Magnum ice-creams, or the hissing sound of soda cans partly define the quality of the product. In these examples, semantically, crunchiness indicates freshness, hard breaking indicates sophistication, while hissing indicates being refreshing. These associations become prominent in momentary encounters, hence shaping the expectations of users for a distinct product experience. Furthermore, the authors discuss a top-down semantic influence derived from the users’ expectations of what the function of the product ought to be. For example, a vacuum cleaner’s sound provides major feedback on the suction power of the apparatus, where the suction power largely determines the quality and the efficiency of the product. Thus, expectations and sound as feedback are coupled in the experience of the product. Similarly, Özcan and van Egmond (2012) suggest that psychophysical changes in sound can elicit certain meanings, which in turn feed the attribution of meaning to the overall product. For example, loudness may correlate with power and a loud vacuum cleaner may be perceived as more powerful and therefore reliable, which will indirectly influence its pleasantness evaluation.
To summarize, much of the evidence on audio-visual interactions is demonstrated through conceptual and semantic processes both bottom-up and top-down. That is, either sound plays a prominent role in shaping a semantic experience, or the visual impression of a product activates information about the identity and function of the product, which in turn affects the auditory experience. The aforementioned studies indicate a strong relationship mainly on a perceptual and sometimes on a cognitive level (conceptual or semantic) between the sensory and the overall (i.e., multisensory) product experiences and it is worthwhile to study the individual contribution of sensory product experiences to the multisensory product experiences, especially for the evaluation of affective product quality.
In the present study, we predict an asymmetry in the affective evaluation of auditory and visual properties of products. A visual product property is more likely to be perceived as pleasing than an auditory product property, whereas an auditory product property is more likely to be stimulating and empowering than a visual product property. Such asymmetry is also likely to influence the affective quality of the overall product experience (i.e., multisensory). We expect that in terms of its effect on the overall, multisensory evaluation, the sensory property that is affectively rated higher will be more influential and thus will positively influence the affective quality of the overall product experience. It is challenging to make individual predictions on the product level because of the varying roles of sensory properties on various product functions and identities. Without further predictions, we acknowledge there may be individual differences between products in how they are affectively evaluated.
Sensory Memory and Affect
A memory advantage has been shown for objects that are encoded in a multisensory fashion. Paivio (1991, 2007; see also Bartlett, 1977 especially for sounds) suggests that multisensory encoding makes the concept of objects stronger by building multiple paths to sensory and semantic memory. As a consequence, recalling objects and their names from memory becomes easier. Furthermore, Özcan and van Egmond (2007a) demonstrated that the intrinsic properties of sounds as well as the additive effect of product image influenced memory performance. More specifically, product sounds that have a certain structure in their spectral-temporal content facilitated better memory performance. For example, the cyclic sound of a washing machine centrifuge, or an alarm clock sound with a musical structure is better recalled than the continuous whirring of a hairdryer or the constant rough sound of a shaver. In addition to the auditory structure, a text label presented with a sound improved the recognition performance and a product image presented with a sound improved the matching and a free recall performance.
In a subsequent study, Özcan and van Egmond (2009) demonstrated when contextual information is discarded how difficult it was to correctly identify the product from the sound it makes. However, additional visual information conceptually and specifically related to the sound and its product improved the correct auditory identification substantially. For example, the source of a hair dryer sound is difficult to identify due to the ambiguity of the sound source; i.e., a hairdryer sound activates several sources in the absence of product image, such as a hand-held vacuum cleaner, a hand dryer, a hand mixer, etc.. However, if users are presented with the image of an appropriate usage context (e.g., bathroom) or the image of an appropriate object that is commonly used with the product (e.g., hairbrush), then the identification accuracy of the sound source increases. The findings of Özcan and van Egmond contrast with a previous study on the effect of context on sound identification. Ballas and Mullis (1991) showed that the auditory context consisting of sounds of other objects, whether semantically congruent or not, mainly had a negative effect on the identification of the target sounds. For example, food preparation sounds (e.g., slicing, chopping) were expected to activate the concept of a ‘bacon frying’ sound, but not a ‘fuse burning’ sound. However, the double ambiguity caused by target sounds and the context sounds seemed to hinder the positive effects because if one cannot correctly identify or even recognize the context sound, then identifying the target sound becomes almost impossible. These studies provide evidence for the difference between the visual and auditory identification of products and their potential to activate previously stored concepts in memory. Again, visual information may have stronger and viable links to semantic memory than auditory information. On the other hand, auditory information can multiply the number of concepts activated in memory due to ambiguity, even though these concepts will not have strong perceptual and semantic links.
Affect and its basic components pleasure, arousal and dominance also play an important role in memory. For example, highly arousing emotional materials in pictures have a positive impact on memory, regardless of how (un)pleasant they are (Bradley, Greenwald, Petry, & Lang, 1992). Furthermore, participants can recall more details from an emotionally arousing story compared to an emotionally neutral story (Cahill & McGaugh, 1995). Bradley and Lang (2000) showed that an increase in arousal and either an increase or decrease in valence enhanced the recall performance of a large collection of environmental sound events (e.g., screams, bombs, baby crying) heard during the experiment. Thus, both perceptual and cognitive factors influence memory performance for sensory objects. While sensory properties need to be coupled to the object concept and possibly to a corresponding label in order to be remembered and/or recalled, multisensory objects presented as a whole can activate more direct links to the semantic memory and object concept. As a result, single sensory properties may activate more memory associations (i.e., specific concepts), but less viable links to memory stores compared to multisensory objects. It is also possible that product-relevant concepts activated through visual memory will be more specific in comparison to product-relevant concepts activated through auditory memory (Özcan & van Egmond, 2007a).
The Present Study
This study investigates the differences in the affective quality of auditory and visual product properties and the potential contribution of a unisensory (Visual or Auditory) product experience to the affective quality of a multisensory product experience (Auditory-Visual). From the cognitive perspective, the memory performance, that is, the ability to concretely recall any episode of product use was also investigated to compare whether the amount of concepts pertaining to product use activated by unisensory product properties (Visual or Auditory) differ from the amount of concepts activated by multisensory presentations (Auditory-Visual). We employed domestic appliances that are inherently multisensory objects as stimuli eliciting affective response and evoking memories in potential users.
Method
Experimental Design
The experiment consisted of three main conditions: Visual-only condition (Vo), Auditory-only condition (Ao) and a combined Auditory-Visual condition (AV). In each of these conditions (i.e., within-subjects), participants were asked to rate four questions regarding the affective product quality, that is, the extent to which a sensory product property is evaluated as Pleasing, Stimulating, Powerful and the amount of Memories, that is, relevant conceptual associations with the product use activated by sensory product properties. One half of the participants started with the Vo condition followed by the Ao condition, while the other half received the opposite sequence (Ao condition first and Vo condition second). In each case, ratings were collected for Pleasing, Stimulating, Powerful and Memories (i.e., product use relevant conceptual associations). The Auditory-Visual condition always took place as the last condition following both the Ao and the Vo conditions.
For each of the Vo and Ao conditions, participants performed two sequences of item ratings in two consequent sessions: practice ratings for the training session directly followed by main ratings for the experimental session. The training session helped the participants to get acquainted with the rating items/scale and become more sensitive towards the sensory stimuli by practicing how to listen to sounds or how to look at products with affective quality in mind. That is, the participants focused on the affective quality of the auditory and visual appearances of products through listening or seeing. The training session offered 16 products (i.e., the digitized sounds and images of the products) for practice ratings. The experimental session offered a subset of eight of these products, but now coming from real products presented on shelves in a room.
Participants
Thirty-four participants (18 male and 16 female), students of industrial design engineering at Delft University of Technology, took part in the experiment. The mean age was 24 years old (24 for males and 25 for females). All participants reported normal hearing and normal or corrected-to-normal vision. Participants received course credits for their contribution.
Apparatus & Set-up
For the training session, a Macintosh iMac Intel Core 2 Duo with 19” screen and built-in speakers was used to present the auditory and visual stimuli. The stimuli used in the training session were presented using a specially designed application developed using the Trolltech Qt (Mac OS X—free edition) tool kit. For the experimental session, eight functioning products were presented on a waist-high shelf. The products were covered and placed on the shelf about 50 cm apart from each other. The material of the shelf was light oak wood and the background colour on the wall was white in order to have enough visual contrast between product and wall.
The entire experiment took place in the HomeLab at the Faculty of Industrial Design Engineering of Delft University of Technology. HomeLab is a furnished room imitating a living context. Such a room was seen as appropriate in order to create more natural circumstances that facilitate everyday sensory experiences. The windows and doors were shut to prevent environmental noise. The curtains were drawn to cancel out natural light fluctuations. Instead, four spotlights were mounted on the ceiling to create stable lighting conditions for the products.
Stimuli
The products, their images and sounds were used as stimuli for the entire experiment. Table 1 shows the products names and their corresponding images. Sixteen products were selected in total, representing multiple domestic appliances. The stimuli were selected to have similar visual quality and the colour range was restricted to mainly black and white tones. A subset of these, the eight experimental stimuli, were all chosen from the same brand (Philips) to avoid the influence of brand identity on the participants’ judgments. The products used in the experimental session were required to be hand-held domestic appliances to allow participants observe the entire product either on a shelf or functioning when held in hand.
Table 1. Sixteen products and their images used in the training and experimental sessions.
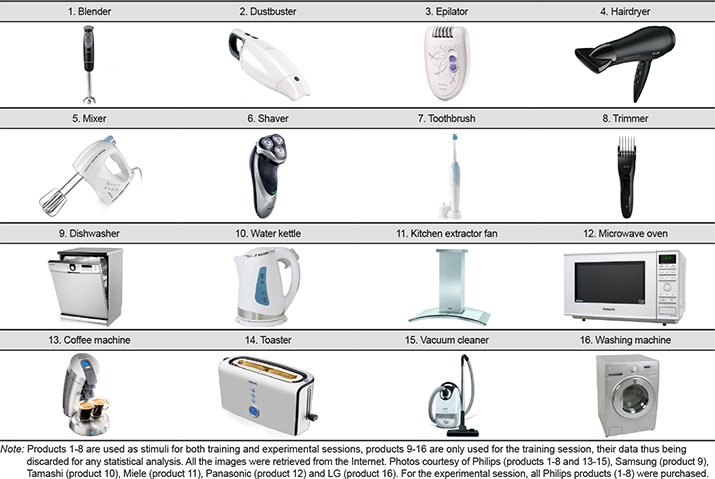
The hand-held products were also chosen for the experimental session because they provide more possibilities for close physical interactions and are widely available in everyday environments. For example, the sounds of mechanical products (e.g., shavers, toothbrushes) are shown to be more attention seeking and more familiar to users by comparison with products that require little attention and stay in the background such as washing machines or tumble-dryers (Özcan & van Egmond, 2012). Moreover, small, hand-held products make it easier for users to evaluate their affective quality in allowing more involvement and possibility for close inspection. The possibility for action with small products may also evoke more memories related to product use or interaction by comparison with washing machines, because the actual duration and the intensity of interaction is rather limited.
Visual Stimuli
For the training session, product photos with a white background were collected from the manufacturers’ catalogues available online. All images were saved in jpg format having a canvas of 500 × 500 pixels with 150 dpi resolution. The images were presented on a computer screen at a distance of 50 cm. For the experimental session, the eight experimental products were presented on a waist-high shelf. All products were covered with a piece of cotton cloth. Each product was unveiled and exposed to the participants to be rated one at a time while the other products stayed covered. Participants were allowed to closely inspect the visual qualities of the presented product without touching it at a distance of about 25 cm. All the visual stimuli used for the training and the experimental sessions can be found in Table 1.
Auditory Stimuli
For the training session, the stimuli were sound recordings reflecting the main functioning mechanisms of the products that were played on a computer. All sounds were recorded in stereo format with a sampling rate of 44.1 kHz and 16 bits with a 50 cm distance from the microphone. The duration of each sound used in the experiment was 3 s and they were played on a computer. The sounds were presented through computer speakers at a similar, comfortable listening level preserving the natural variation in the loudness of sounds. The loudness levels ranged between 65 dB and 75 dB. The participants were not allowed to change the sound levels during the experiment. For the experimental session, the actual sounds of functioning products were presented. Participants were asked to turn their backs to the products that were previously covered by a cotton cloth so as not to see the products. A product was turned on for 6 s during a rating task. For the mixer, hairdryer, epilator and blender the highest setting was always used to provide participants with the full potential of the products. The loudness levels again ranged between 65 dB and 75 dB at a distance of about 50 cm. Sounds were always presented anonymously to the participants.
Environmental sounds can usually be identified in less than 150 ms (Guillaume, Pellieux, Chastres, & Blancard, 2004). As such, 3 or 6 seconds are long enough for users to identify and affectively evaluate the sounds. Sounds for the main ratings were kept longer in order for participants to pay more attention to the presented stimulus, the data of which would be used for the analysis phase.
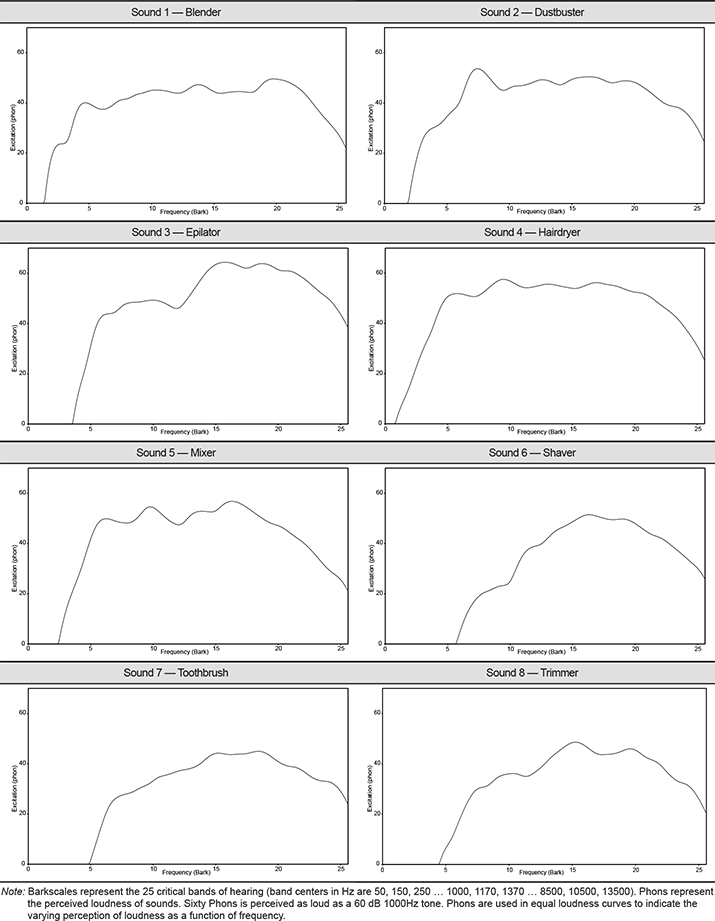
Table 2 shows the auditory content of the product sounds in terms of frequency distribution (Bark scales) and perceived loudness (Phons). The combination of Bark scales and Phons indicate how loud certain frequency bandwidths are perceived (the intensity of the excitation of the cells in the inner ear). For example, the epilator sound is perceived as rather loud and sharp due to high excitations in higher bandwidths while the hairdryer sounds seems to have higher loudness due to high excitation in all bandwidths in comparison to the toothbrush sound, which has no excitation in lower bandwidths and has low loudness with a maximum of 40 Phons.
Table 2. Frequency (Bark scales) and loudness (Phons) representation of eight products used in the experimental session.
Auditory-Visual Stimuli
For the training session, product photos used in the Visual-only condition were presented together with a corresponding sound used in the Auditory-only condition for a maximum of 3 s via a computer screen and built-in speakers (Macintosh iMac Intel Core 2 Duo with 19” screen). The multisensory stimuli were presented at a distance of 50 cm. For the experimental session, the products were presented on a waist-high shelf. All products on the shelf were covered with a piece of cotton cloth; a single product was unveiled and exposed to the participants to be rated one at a time while the other products stayed covered. Each uncovered product was turned on for 6 s during a rating task. Participants were allowed to closely inspect the auditory and visual qualities of the presented product without touching it at a distance of about 25 cm. Participants simultaneously saw and heard a product for rating.
Procedure
The instructions for the experiment were provided both spoken and written on an A4 paper. The main task was to observe the occurring sensory product experiences and rate the questionnaire items on a scale of 0-100 on another A4 paper sheet. While rating, participants were allowed to hear the sounds twice if they wanted or to see the products within a 15-second time period.
The experiment was designed to measure four items during three experimental conditions: Auditory-only (Ao), Visual-only (Vo) and Auditory-Visual (AV) with the help a questionnaire. Questionnaire items for basic affect were inspired by the aforementioned PAD model (Russel & Mehrabian, 1977) used for measuring affective quality (Pleasure, Arousal and Dominance dimensions). However, in order to fit the practical purpose of evaluating products by potential users, the wording was reformulated into Pleasing, Stimulating and Powerful. In addition, we added a cognitive item to assess the number of ‘Memory’ associations (i.e., product use relevant concepts). Participants responded to the following questions depending on the unisensory condition (Ao or Vo) and indicated a number on a scale of 0-100 (0 = not at all, 100 = extremely):
Q1—How pleasing is the sound/image of this product to you?
Q2—How stimulating is the sound/image of this product to you?
Q3—Does this product sound/look powerful to you?
Q4—Does the sound/image of this product evoke any memories of using this kind of product?
For the Auditory-Visual condition the questions were:
Q1—How pleasing is this product to you?
Q2—How stimulating is this product to you?
Q3—How powerful do you think this product is?
Q4—Does this product evoke any memories of using this kind of product?
A maximum of three participants were randomly assigned to one experimental session, which contained practice and main ratings of sensory experiences. For the practice ratings (i.e., training session), participants were seated in front of the computer screen at a distance of approximately 50 cm and either saw a photo of the product or heard its sound without being aware of its source. Main ratings in the experimental session took place while participants stood in front of a shelf on which products were presented auditorily and/or visually. Only one product was perceptible at a time, the others were covered with cotton cloths. All stimuli were randomly presented (within a condition). Randomization was done using an online random number generator in which each number from one to eight represented a single product, its sound or image. The entire experiment was guided by the experimenter and there were no pauses between the rating trials. The duration of the entire experiment was maximum 30 min.
Results
Analysis of the rating data was conducted in two major steps: comparison of the different sensory product experiences and the different products for the various item ratings (by means of ANOVA) and multiple regression analysis to determine the contribution of each unisensory product experience (i.e., Auditory or Visual) to the multisensory product experience (i.e., Auditory-Visual).
ANOVA of Item Ratings
We performed a doubly multivariate analysis of variance with the ratings on the four different dimensions (Pleasing, Stimulating, Powerful, Memories) as dependent variables, repeated measures over sensory condition [3 levels: Auditory-only (Ao), Visual-only (Vo), Auditory-Visual (AV)] and product (8 levels: blender, dust-buster, epilator, hairdryer, mixer, shaver, toothbrush, trimmer) and presentation order (Auditory-Visual versus Visual-Auditory) as between-participant variable. None of the effects involving presentation order were significant (p > 0.05) so this variable will not be discussed further.
The multivariate tests of sensory condition, product and their interaction based on Wilks’ Λ were all highly significant (all F > 6.8, p < 0.001). To investigate these effects further, we also performed repeated measures analyses for the dimensions Pleasing, Stimulating, Powerful and Memories separately. In accordance with Stevens (2002), we corrected the degrees of freedom of univariate F-tests with the Greenhouse-Geisser ε if ε < 0.7. We averaged the ε values from Greenhouse-Geisser and Huynh-Feldt, when ε > 0.7. Differences between individual samples were investigated by a posteriori t-tests with Bonferroni adjustment.
For all dependent variables, we found a significant main effect of product (all F > 8.1, p < 0.001) and a significant Product × Condition interaction (all F > 2.3, p < 0.05). In addition, the condition main effect was significant for Pleasing (F = 18.8, p < 0.001), Stimulating (F = 3.8, p < 0.05) and Memories (F = 18.3, p < 0.001), but not for Powerful (F = 0.6, p > 0.20). Figure 1 presents the mean ratings as a function of sensory condition and product. The interaction effects indicate that the ratings of the affective quality of products depend on the combination of the product and the type of sensory stimulus provided. For example, an epilator can be perceived as pleasing mainly because of its visual property, whereas a toothbrush can be pleasant mainly due to its auditory property.
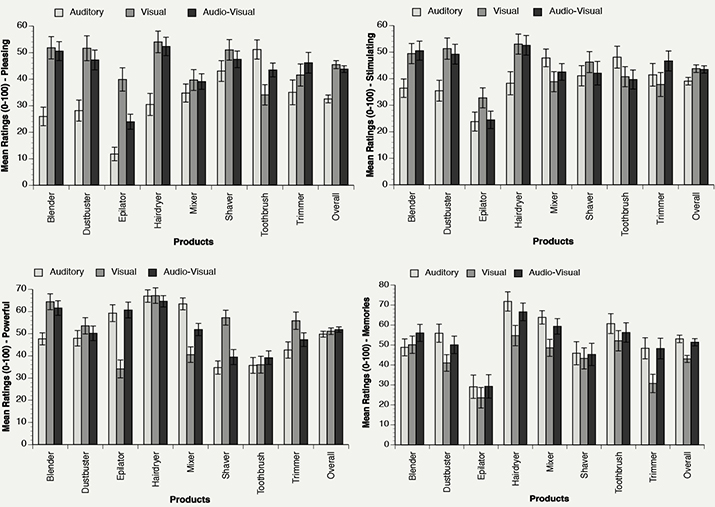
Figure 1. Mean ratings for each item (Pleasing, Stimulating, Powerful, Memories) presented as a function of sensory condition (Auditory-only, Visual-only and Auditory-Visual) and products. (Error bars are the standard error of the mean).
We also averaged these ratings over products to focus on differences between sensory conditions (Ao, Vo and AV) for the four dependent variables (Figure 2). For Pleasing the Vo ratings (M = 45.5) were the highest and the Ao ratings (M = 32.5) were the lowest. The AV ratings were similar to the Vo ratings (M = 43.8). Similarly, for Stimulating the Vo ratings (M = 43.8) were the highest and the Ao ratings (M = 39.0) were the lowest. The Vo ratings and AV ratings (M = 43.5) were similar. For Powerful the Ao ratings, Vo ratings and AV ratings were all similar (M = 51.1, M = 49.8 and M = 51.9, respectively). For Memories, the Ao ratings (M = 53.0) were the highest and the Vo ratings (M = 43.0) were the lowest. Here the Ao ratings and AV ratings (M = 51.4) were similar. These aggregate analyses suggest that the mean rating for the AV condition is close to the highest rating of a unisensory condition, independent of the presentation order.
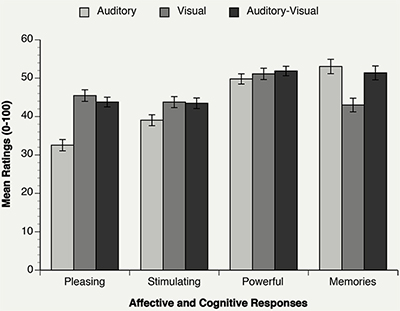
Figure 2. Mean ratings for affective and cognitive responses (Pleasing, Stimulating, Powerful, Memories) presented as a function of sensory condition (Auditory-only, Visual-only and Auditory-Visual). (Error bars are the standard error of the mean).
A post-hoc analysis with Bonferroni adjustment was conducted to reveal which levels of the main effects differed significantly. Earlier assumptions were mainly confirmed. For Pleasing, the ratings of the Ao condition were significantly lower than of the Vo and AV conditions (p < 0.001). For Stimulating, the ratings of the Ao condition were marginally lower than of the AV condition (p ≤ 0.05). For Memories, the ratings of Ao condition and AV condition were significantly higher than the Vo condition (p < 0.001). None of the other differences were significant in paired comparisons (p > 0.10).
Regression Analysis
In order to observe the possible contributions of each unisensory product property to the evaluation of the affective quality of multisensory products, multiple regression analyses were conducted. We estimated one regression equation for each item, using the ratings of the 34 participants for the 8 products as replications (N = 272). For these analyses, we used the Auditory-Visual ratings (AV) as dependent variable with Auditory-only ratings (Ao) and Visual-only ratings (Vo) as predictors.
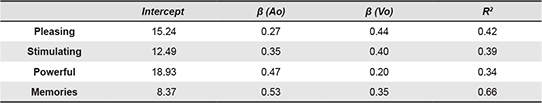
The results, which are presented in Table 3, indicate that both Ao and Vo evaluations of the affective quality of products contribute to the multisensory (AV) evaluation of the affective quality of products. All regression coefficients were significantly different from zero (p < 0.001), with standard errors for β ranging from 0.04 to 0.05. However, for some items the Ao evaluation has more leverage (e.g., Powerful and Memories), whereas for other items, the Vo has more leverage (e.g., Pleasing). Overall, the results are in line with the main effects for sensory ratings found in ANOVAs except for the item Powerful. ANOVAs for Powerful ratings did not distinguish between the sensory evaluations, whereas regression analysis reveals that Ao evaluation has more effect on how powerful products are perceived compared to the Vo evaluation.
Table 3. Results of regression analyses for the four items (Pleasing, Stimulating, Powerful and Memories) predicting Auditory-Visual evaluations on the basis of ratings of Auditory-only (Ao) and Visual-only (Vo) evaluations.
We were also interested to see whether the magnitude of basic affective evaluations (Pleasing, Stimulating, Powerful) had a different effect on the amount of concepts evoked by unisensory (Auditory/Visual) product properties. Thus, multiple regression analyses have been conducted for Ao and Vo evaluation of evoked Memories with the basic affective ratings (Pleasing, Stimulating, Powerful) as predictors. For evoked Memories in the Ao evaluation, the three predictors explained 33% of the variance (R2 = 0.33, F(3, 268) = 10.89, p < 0.001). Only the effect of the item Powerful was significant (β = 0.24, t(268) = 2.84, p < 0.001). For evoked Memories in the Vo evaluation, the three predictors explained 32% of the variance (R2 = 0.32, F(3, 268) = 9.83, p < 0.001), with only the item Stimulating producing a significant effect (β = 0.47, t(268) = 4.30, p < 0.001).
Discussion
Our main finding is that users’ individual sensory product experiences (auditory or visual) of daily domestic appliances evoke different affective responses regarding how pleasing/stimulating/powerful a product can be. Similarly, users’ cognitive responses (i.e., memory associations) are also found to be dependent on the sensory product property (auditory or visual) used as input. Furthermore, the contribution of these individual sensory product experiences to the multisensory product experience of domestic appliances is dependent on the magnitude of the affective/cognitive response that a unisensory product experience evokes. Our study showed that the higher the magnitude of the response to a unisensory product experience, the stronger its contribution to the response to a multisensory product experience. The analyses of overall means in Figure 2 show that the mean for Auditory-Visual ratings is generally close to the highest of the means of the two modalities (auditory or visual). Furthermore, the regression analyses based on individual product means (see Figure 1 and Table 3) generally show the same pattern. Accordingly, the Visual experience mainly affected the Auditory-Visual experience for Pleasing and Stimulating and the Auditory experience mainly affected the Auditory-Visual experience for Memories. In the case of the Powerful dimension, the means of the three conditions do not differ significantly (Figure 1), but the regression coefficients indicate that the variation between individual product means for Auditory-Visual follow the Auditory product means more closely (Table 3).
On a cognitive level, sensory product properties activate memory associations pertaining to product use and the auditory product appearance seems to activate more associations than the visual product appearance. Furthermore, we have found evidence that the affective quality of products also influences memory. To be more specific, for products to be remembered either their auditory property should be powerful or their visual property should be stimulating. However, we have no additional evidence as to how strong and specific the activated associations are.
These results demonstrate a main trend observed when judging the affective quality of products in a multisensory fashion (auditory and visual in this case). That is, users’ affective responses to multisensory products are influenced by the salient sensory experience. In addition, Figure 1 shows a detailed account of the affective responses to individual products. For example, overall, the auditory product appearance is found less pleasing than visual product appearance. However, this is not the case for the toothbrush, for which the sound is more pleasing than its image. In another example, the sound of the epilator and the mixer are evaluated as more powerful than their image. The reverse is the case for the shaver, its image being evaluated as more powerful than its sound, although the overall ratings would indicate no differences in the evaluation of how powerful an auditory or visual product appearance can be. These data thus show that not all products or their sensory properties comply with the main trend.
Figure 1 also indicates that the evaluations per product for the dimensions Pleasing and Stimulating result in similar rating patterns for five out of the eight products (blender, dustbuster, hairdryer, shaver and trimmer) and that the auditory property of these products is rated slightly higher for Stimulating, which is in line with our expectations. These products are more likely to dominate the main trend for Pleasing and Stimulating ratings. For the Powerful dimension only, three products (dustbuster, hairdryer and toothbrush) comply with the main trend and majority of the products either appear more powerful (blender, shaver and trimmer) or sound more powerful (epilator and mixer). The participants rated the Pleasing and Stimulating dimensions similarly when evaluating the affective quality of products, which indicates that these two dimensions are experientially more closely related to each other than the third dimension (Powerful) of basic affect.
Taken together, the results of ANOVAs and regression analysis indicate that the auditory and visual evaluations of the affective quality of products operate through separate systems and are not directly linked to the cognitive evaluation of products (i.e., memories evoked through the sound and image of the product). The results of the regression analysis further confirm that the visual product appearance has a strong effect on how pleasing and stimulating a product can be and the auditory product appearance has a strong effect on how powerful a product can be.
All in all, we suggest that users may be employing at least three strategies when evaluating the affective quality of products and their sensory properties: visual and overall evaluation of the affective quality (how pleasing, stimulating, powerful a visual product appearance is and how pleasing and stimulating a product is), the auditory evaluation of affective quality (how pleasing and stimulating an auditory product appearance is) and the evaluation of the product power through sounds (how powerful a product and its auditory appearance is). In addition, on a cognitive level, the affective quality can be determinant of how well the product is remembered.
Affective Responses
The results for affective responses are as expected for Pleasing and Powerful dimensions. The visual property of domestic appliances is one of most explored product properties among designers and much effort is put into creating good visual impressions (Blijlevens, Creusen, & Schoormans, 2009; Hekkert, Snelders, & van Wieringen, 2003; Hung & Chen, 2012). In contrast, the inherent auditory properties of domestic appliances are not considered pleasing and sound designers can do little to create very pleasant sounds in comparison to very pleasant musical sounds, for example (Özcan, 2014). However, it is in line with the expectations that users rely more on product sounds in evaluating how powerful products are (see, e.g., Bisping, 1997). Product sounds inherently signal event quality and the sound is a consequence of energy release in an event (Gaver, 1993; Zampini, Guest, & Spence, 2003). Therefore, product sounds are reliably informative about how a product functions and how powerful a product can be, provided that such sounds are experienced in semantically congruent visual or auditory contexts.
Similarly, Schifferstein et al. (2010) provide evidence for the mutual relationship between the sound of a product and the power of a product, but they also mention that a visual product property (i.e., colour) also influenced power judgment. Looking at overall ratings and some individual products, we also found traces of how a visual product property can be perceived as powerful as an auditory product property (e.g., dustbuster, hairdryer and toothbrush) or even more powerful (e.g., trimmer, shaver and blender). However, it is important to mention that these results are based on comparing group means in which individual differences in response patterns are lost; regression analysis indicated that participants who rate sound as more powerful have the tendency to similarly rate the overall product as more powerful too.
For Stimulating, it could be expected that product sounds would have more arousing quality than product images due to their arousing auditory qualities (e.g., psychoacoustically sharp sounds). However, our regression results indicate almost equal impact from both Visual and Auditory experiences (Table 3). Possibly, the meaning of the word ‘stimulating’ was unclear to the participants, who may have confused it with ‘encouraging’ or ‘supporting’. Furthermore, this semantic mismatch could also incite a discussion about whether judging the intensity of feelings is relevant where product assessment is conducted passively. That is, in our study, users actually did not act like users as in utilizing products and their sensory properties. They were merely asked to rate affective quality based on a distal interaction. Thus, the dimension Stimulating may have been fundamentally irrelevant due to the way the study was conducted.
We found the two dimensions of affect (Pleasing and Stimulating) to be similarly rated for products and their sensory properties (low ratings for auditory product appearance, higher ratings for visual product appearance and similarly high ratings for overall product). Pleasure and arousal are historically the most studied dimensions of basic affect (e.g., Bradley et al., 1992; Bradley & Lang, 2000; Lang, Bradley, &, Cuthbert, 1999; Mehrabian, 1996; Osgood 1966; Västfjäll Gulbol, Klieiner, & Garling, 2002). Through these studies, it has been demonstrated and modeled that people show preference for or display approach tendency towards events/objects (including images and sounds) that are found highly pleasing and arousing (e.g., lovemaking, roller-coaster). For example, Västfjäll et al. (2002) showed that with vehicle sounds, preference is determined by valence and activation in which valence is negatively affected by the loudness of the sound and activation is positively affected by the roughness and noisiness of the sound. Thus, this inherent relationship between pleasure and arousal was present in our results too, although we were not concerned with preference.
Memory Associations
The results for the memory associations indicate that the Auditory experience evokes more associations than the Visual experience and the Auditory-Visual experience seems to evoke as many associations as the Auditory experience. For the unisensory experiences, we may account for these differences by the difference in identification ability. That is, product sounds are by nature quite ambiguous (Özcan & van Egmond, 2007a, 2007b; Schifferstein & Cleiren, 2005) because hearing a sound in the absence of the source can activate multiple plausible sound sources (i.e., between three to eight products). Moreover, each of these activated products as sound sources could further activate context frames pertaining to the use of the products (Bar, 2004; Özcan & van Egmond, 2009), which might elicit even more memory associations. With product image, the identity of the product is instantly clear to the user, because object identification through the visual sense provides more reliable results (Schifferstein & Cleiren, 2005). Therefore, the number of memories evoked by the Visual experience may have been limited, but these memories were likely more precise.
The Auditory-Visual experience evoked as many associations as the Auditory experience. This could be explained by the main function of the auditory system. The auditory system is tuned to monitoring events and actions, because sound usually accompanies the occurring actions (Fabiani, Kazmerski, Cycowicz, & Friedman, 1996; Gaver, 1993; Giard & Peronnet, 1999; Lemaitre, Heller, Navolio, & Zúñiga-Peñanda, 2015; Marcell, Borella, Greene, Kerr, & Rogers, 2000; Saldaña & Rosenblum, 1993). Similarly, human-product interactions pertaining to product use can be considered highly auditory events and sound becomes part of the product use rituals (Özcan & van Egmond, 2009). It is possible that in our experiment, listening to product sounds activated not only the sound source, but also the vivid human-product interactions and relevant activities taking place during product use. Regression analyses confirmed the strong influence of Auditory experience in the Auditory-Visual experience with respect to Memory responses. Thus, in the Auditory-Visual experience, sound may have had an extra effect in addition to clear object identification caused by Visual experience.
Furthermore, we were interested in understanding whether the affective quality of the products could have an effect on the amount of memory associations evoked by unisensory experiences. Regression analyses indicate the possibility that the more Powerful a product sound is, the more auditory memories it evokes while the more Stimulating the product image is the more visual memories it evokes. The latter finding is in line with the study of Bradley at al. (1992) that regardless of how pleasant they are, arousing (i.e., stimulating) images are remembered better. For the auditory experience, however, Bradley and Lang (2000) found that both pleasantness (Pleasing in our study) and arousal (Stimulating in our study) had an impact on memory performance, excluding dominance (Powerful in our study) as an essential factor. Because the ratings of Pleasing and Stimulating were consistently low for product sounds without much variety in these judgments in our study, these affective qualities of product sounds may not have influenced auditory memory in our case.
Individual Products and Their Sensory Properties
Although we discussed the general trends above, the results also indicate that the inherent properties of products play an important role in the way we experience products through the senses and respond to them affectively. Some products were salient among the others due to their affective qualities. For example, the epilator was the least pleasing and stimulating, the hairdryer was the most powerful and the toothbrush was the least powerful of all products. Not only did products as a whole differ in their affective qualities, their individual sensory properties were also judged independently of each other. While the image of the epilator was significantly the most pleasant feature, for the toothbrush it was the sound. The sound of the mixer or the image of the shaver was evaluated to be the most powerful. These individual cases not only demonstrate the importance of each sensory property and their unique contribution to the affective experience of a product, but also pinpoint the need to examine each product, their sensory properties and the extent to which they can evoke affective experiences. It will be interesting to see how judgments of the three affective qualities relate to the importance people attribute to the different senses in their interactions with these products (Schifferstein, 2006; Fenko, Schifferstein, & Hekkert, 2010).
Figure 2 further demonstrates the issue of (im)balance in the affective evaluation of sensory product experiences. In some cases, auditory and visual product properties seem in perfect balance in the way they elicit an affective response in the user. For example, the sound and the image of a mixer or a shaver are rated equally pleasant and stimulating respectively although the rating trend would indicate lower ratings for product sounds for Pleasing or Stimulating dimensions. In other cases, auditory or visual product properties stand out as significant, indicating a noticeable imbalance while being noncompliant with the trend. For example, the image of an epilator or the sound of a toothbrush is perceived evidently more pleasant in comparison to the other sensory property; or the image of a shaver or trimmer is more powerful than their sound and the images of an epilator and mixer are less powerful than their sound. This finding raises the question for designers whether different sensory properties should have similar affective quality or whether the imbalance can be strategically used to compensate for possible negative affective responses to sensory product property (e.g., juxtaposing extremely unpleasant sound with a highly pleasant image). Özcan (2014) had theoretically suggested that a pleasant visual appearance, a utilitarian function of the product or a positively-laden context (e.g., brand values or trendsetter users) can compensate for the unpleasant auditory experience either by increasing the perceived pleasantness of the sound or increasing the pleasantness of the overall product experience (see also Özcan & Schifferstein, 2014).
Implications for Design Practice and Manufacturers
We conclude that auditory and visual experiences are complementary experiences taking on different roles during human-product interactions. This finding should be well considered during product development. This study has practical implications for designers. Design teams should be reminded of the multisensory nature of products and realize that any relevant sensory experience has a specific contribution to the overall product experience (e.g., Schifferstein, 2011). It is also advisable to check the sensory experiences separately to be able to predict their contribution to the overall product experiences. However, in current practices of product design, visual product appearance is often the first product aspect to develop in order to create pleasurable experiences with products. Given that the present study shows that auditory inputs seem to dominate particular parts of the affective and cognitive experience (powerful, memories), it seems plausible to put similar effort in the development of product sounds for even more engaging product experiences. Furthermore, as the auditory system plays a functional role in product experiences, product sounds could be further exploited to communicate certain operational stages taking place in product use.
Every product is uniquely designed. Some products are small, some are loud, others have bright colours or smooth shapes. Our results show that users are sensitive to the physical properties of products and affectively react to them. They are aware of the odd qualities and qualities that are congruent with each other. Users react to (in)congruence in concurrent sensory perception and overall judgment of the product may suffer or benefit from it. Thus, if a product is being redesigned, design teams may need to do a thorough sensory analysis in order to pinpoint the strengths and weaknesses in the physical constitution of the product. Early analysis may include spectral-temporal analysis of the sounds and determining their psychoacoustical quality (Özcan & van Egmond, 2008) or visual analysis whether a product image complies with the rules of visual aesthetics. Later analysis can include users’ affective responses to sensory product properties as was conducted in this study. If a product is being designed from scratch, then sound design should take place parallel to the design of the visual product appearance and functionality.
In general, our results show that an auditory product appearance can either be perceived as pleasant or as powerful, whereas visual product appearance can be both. For example, the sound of an epilator sound may be the most unpleasant feature in contrast to its image, but it can be perceived as the most powerful feature of the product. Epilator sound is inherently loud, sharp and rough due to its function and mechanism (see the Barkscales in Table 2 for the content of the epilator sound, which has little information in the low frequencies and much information in the very high frequencies coupled with high intensity). So, how can designers compensate for the auditory unpleasantness without compromising powerfulness of the product? A safe way for obtaining auditory pleasantness is to structurally change the product, its materials and mechanism (see Langeveld et al., 2013). However, there needs to be an optimum level for improvement as designing a very quiet and low-pitched sound can harm users’ perception of the powerfulness of a product. For example, in Figure and Table 2, we can see that the toothbrush sound is perceived as very pleasant due to its auditory content, but the same sound is perceived as rather weak (i.e., not powerful). Similarly, the sound of a hairdryer is perceived very powerful in contrast to how pleasant it is perceived. Again custom solutions such as iterative design cycles, sensory measurements and semantic evaluations may serve as potential tools to optimize the desired effect (i.e., powerful yet pleasant) as existing literature and good design examples provide conflicting knowledge with regards to the inherent relation between pleasure and power judgments (see the review of Spence & Zampini, 2006).
We acknowledge that multisensory design is of an intricate nature as designers have many degrees of freedom to design a product that needs to be both functional and desirable. However, we believe that users will benefit from the efforts companies put in the design process, manufacturing and product evaluation that carefully considers the sensory aspects of products either individually or as a whole. Products resulting from a multisensory design process will be noticed by the user, perceived as more sophisticated, remembered better and preferred more often. In general, multisensory design offers more possibilities for designers to enhance product experiences by tackling sensory liking and also conceptual associations linked to sensory product properties.
Limitations & Future Studies
We asked participants to reflect on the amount of memory associations the uni- and multisensory product experiences evoked. However, our experimental design did not further investigate the clarity of the associations as was the case in Schifferstein and Cleiren (2005). We did not investigate the participants’ certainty on the correct associations with their sensory product experiences. Having more data on clarity and certainty would provide us with more insights into links between the memory associations evoked by ambiguous product sounds and product as a whole.
A future study could also investigate how meanings attributed to products influence the affective responses. For example, is the epilator found to be an unpleasant product because of its functional meaning or because of the sensory experiences it facilitates? That is, as much as we tried to keep the judgment of the affective quality of products at a sensory level, we cannot be sure that the product meaning did not interfere with the judgments.
Acknowledgments
We would like to thank Reinier Jansen for his help in running the experiments, Alexandre Vieira for voluntarily programming the experimental software in his free time and the members of the Product Sound Design Lab and Perceptual Intelligence Lab (Pi-Lab) at the Faculty of Industrial Design Engineering (TU Delft) for in-depth discussions during the preparation of the experiment and the manuscript. We also thank the two anonymous reviewers and the editor for their valuable comments and suggestions.
References
- Altinsoy, E., Gül, M., & Kuyumcuoglu, A. (2016). Washing machine sound quality. Retrieved February 25, 2017, from http://www.iiav.org/archives_icsv_last/2016_icsv23/content/papers/papers/full_paper_868_20160523230830798.pdf
- Alt, N. W., & Jochum, S. (2003). Sound design under the aspects of musical harmonic theory (Tech. Rep. No. 2003-01-1508). Warrendale, PA: SAE International.
- Asutay, E., Västfjäll, D., Tajadura-Jiménez, A., Genell, A., Bergman, P., & Kleiner, M. (2012). Emoacoustics: A study of the psychoacoustical and psychological dimensions of emotional sound design. Journal of the Audio Engineering Society, 60(1/2), 21-28.
- Ballas, J. A., & Mullins, T. (1991). Effects of context on the identification of everyday sounds. Human performance, 4(3), 199-219.
- Bar, M. (2004). Visual objects in context. Nature Reviews: Neuroscience, 5(8), 617-629.
- Bartlett, J. C. (1977). Remembering environmental sounds: The role of verbalization at input. Memory and Cognition, 5(4), 404-414.
- Blauert, J., & Jekosch, U. (2012). A layer model of sound quality. Journal of the Audio Engineering Society, 60(1/2), 4-12.
- Becker, L., van Rompay, T. J. L., Schifferstein, H. N. J., & Galetzka, M. (2011). Tough package, strong taste: The influence of packaging design on taste impressions and product evaluations. Food Quality and Preference, 22(1), 17-23.
- Bergman, P., Sköld, A., Västfjäll, D., & Fransson, N. (2009). Perceptual and emotional categorization of sound. Journal of the American Acoustical Society, 126(6), 3156-3167.
- Blijlevens, J., Creusen, M. E. H., & Schoormans, J. P. L. (2009). How consumers perceive product appearance: The identification of three product appearance attributes. International Journal of Design, 3(3), 27-35.
- Bisping, R. (1997). Car interior sound quality: Experimental analysis by synthesis. Acustica, 83(5), 813-818.
- Bradley, M. M., Greenwald, M. K., Petry, M. C., & Lang, P. J. (1992). Remembering pictures: Pleasure and arousal in memory. Journal of Experimental Psychology: Learning, Memory, and Cognition, 18(2), 379-390.
- Bradley, M. M., & Lang, P. J. (2000). Affective reactions to acoustic stimuli. Psychophysiology, 37(2), 204-215.
- Bregman, A. S. (1990). Auditory scene analysis: The perceptual organization of sound. Cambridge, MA: MIT Press.
- Cahill, L., & McGaugh, J. L. (1995). A novel demonstration of enhanced memory associated with emotional arousal. Consciousness and Cognition, 4(4), 410-421.
- Fabiani, M., Kazmerski, V. A., Cycowicz, Y. M., & Friedman, D. (1996). Naming norms for brief environmental sounds: Effects of age and dementia. Psychophysiology, 33(4), 462-475.
- Fenko, A., Schifferstein, H. N. J., & Hekkert, P. (2010). Shifts in sensory dominance between various stages of user-product interactions. Applied Ergonomics, 41(1), 34-40.
- Fenko, A., Schifferstein, H. N. J., & Hekkert, P. (2011). Noisy products: Does appearance matter? International Journal of Design, 3(5), 77-87.
- Fog, L., & Pedersen, T. (1999). Tools for product optimization. Retrieved February 25, 2017, from http://citeseerx.ist.psu.edu/viewdoc/download?doi=10.1.1.201.4264&rep=rep1&type=pdf
- Gaver, W. W. (1993). What in the world do we hear? An ecological approach to auditory source perception. Ecological Psychology, 5(1), 1-29.
- Giard, M. H., & Peronnet, F. (1999). Auditory-visual integration during multimodal object recognition in humans: A behavioral and electrophysiological study. Journal of Cognitive Neuroscience, 11(5), 473-490.
- Guest, S., Catmur, C., Lloyd, D., & Spence, C. (2002). Audiotactile interactions in roughness perception. Experimental Brain Research, 146(2), 161-171.
- Guillaume, A., Pellieux, L., Chastres, V., & Blancard, C. (2004). How long does it take to identify everyday sounds. Retrieved February 25, 2017, from https://smartech.gatech.edu/bitstream/handle/1853/50857/GuillaumePellieux2004.pdf
- Guski, R. (1997). Psychological methods for evaluating sound quality and assessing acoustic information. Acta Acustica united with Acustica, 83(5), 765-774.
- Hekkert, P., Snelders, D., & van Wieringen, P. C. W. (2003). ‘Most advanced, yet acceptable’: Typicality and novelty as joint predictors of aesthetic preference in industrial design. British Journal of Psychology, 94(1), 111-124.
- Hinton, P. B., & Henley, T. B. (1993). Cognitive and affective components of stimuli presented in three modes. Bulletin of the Psychonomic Society, 31(6), 595-598.
- Horvat, M., Domitrovi, H., & Jambrošić, K. (2012). Sound quality evaluation of hand-held power tools. Acta Acustica united with Acustica, 98(3), 487-504.
- Hung, W. K., & Chen, L. L. (2012). Effects of novelty and its dimensions on aesthetic preference in product design. International Journal of Design, 6(2), 81-90.
- Hülsmeier, D., Schell-Majoor, L., Rennies, J., & van de Par, S. (2014). Perception of sound quality of product sounds a subjective study using a semantic differential. In Proceedings of the International Congress on Noise Control Engineering (pp. 843-851). Reston, VA: Institute of Noise Control Engineering.
- Ih, J. G., Lim, D. H., Shin, S. H., & Park, Y. (2003). Experimental design and assessment of product sound quality: Application to a vacuum cleaner. Noise Control Engineering Journal, 51(4), 244-252.
- Kantono, K., Hamid, N., Shepherd, D., Lin, Y. H. T., Yakuncheva, S., Yoo, M. J., & Carr, B. T. (2016). The influence of auditory and visual stimuli on the pleasantness of chocolate gelati. Food Quality and Preference, 53, 9-18.
- Kortchmar, L., Vorländer, M., & Slama, J. G. (2001). Sound quality evaluation for the workplace: Research on the influence of spatial sound distributions. Acta Acustica united with Acustica, 87(4), 495-499.
- Lageat, T., Czellar, S., & Laurent, G. (2003). Engineering hedonic attributes to generate perceptions of luxury: Consumer perception of an everyday sound. Marketing Letters, 14(2), 97-109.
- Lang, P. J., Bradley, M. M., & Cuthbert, B. N. (1999). International affective picture system (IAPS): Instruction manual and affective ratings. Retrieved February 25, 2017, from https://www2.unifesp.br/dpsicobio/adap/instructions.pdf
- Langeveld, L., van Egmond, R., Jansen, R., & Özcan, E. (2013). Product sound design: Intentional and consequential sounds. In D. Coelho (Ed.), Advances in industrial design engineering (pp. 47-73). Rijeka, Croatia: InTech.
- Lemaitre, G., Heller, L. M., Navolio, N., & Zúñiga-Peñaranda, N. (2015). Priming gestures with sounds. PloS One, 10(11), e0141791.
- Ludden, G. D. S., & Schifferstein, H. N. J. (2007). Effects of visual-auditory incongruity on product expression and surprise. International Journal of Design, 1(3), 29-39.
- Lyon, R. H. (2000). Designing for product sound quality. New York, NY: Marcel Dekker.
- Lyon, R. H. (2003). Product sound quality – From perception to design. Sound and vibration, 37(3), 18-23.
- MacDonald, A. (2002). The scenario of sensory encounter: Cultural factors in sensory-aesthetic experience. In W. S. Green & P. W. Jordan (Eds.), Pleasure with products: Beyond usability (pp. 113-123). London, UK: Taylor & Francis.
- Marcell, M. E., Borella, D., Greene, M., Kerr, E., & Rogers, S. (2000). Confrontation naming of environmental sounds. Journal of Clinical and Experimental Neuropsychology, 22(6), 830-864.
- Mehrabian, A. (1996). Pleasure-arousal-dominance: A general framework for describing and measuring individual differences in temperament. Current Psychology, 14(4), 261-292.
- Miller, K. W., & Mills, M. K. (2012). Probing brand luxury: A multiple lens approach. Journal of Brand Management, 20(1), 41-51.
- Nor, M. J. M., Fouladi, M. H., Nahvi, H., & Ariffin, A. K. (2008). Index for vehicle acoustical comfort inside a passenger car. Applied Acoustics, 69(4), 343-353.
- Ohtomi, K., & Hosaka, R. (2012). Home appliance sound design in consideration of home environment. In Proceedings of the International Congress on Noise Control Engineering (pp. 910-923). Reston, VA: Institute of Noise Control Engineering.
- Osgood, C. E. (1966). Dimensionality of the semantic space for communication via facial expressions. Scandinavian Journal of Psychology, 7(1), 1-30.
- Özcan, E., & van Egmond, R. (2006). Product sound design and application: An overview. In Proceedings of the 5th International Conference on Design and Emotion (pp. 2-19). Gothenburg, Sweden: Chalmers University of Technology.
- Özcan, E., & van Egmond, R. (2007a). Memory for product sounds: The effect of sound and label type. Acta Psychologica, 126(3), 196-215.
- Özcan, E., & van Egmond, R. (2007b). How well do we identify product sounds? In Proceedings of the 13th International Conference on Auditory Display (pp. 234-241). Montreal, Canada: ICAD.
- Özcan, E., & van Egmond, R. (2008). Product sound design: An inter-disciplinary approach? In Proceedings of the Conference on Design Research Society (pp. 306/1-306/14)., Sheffield, UK: Sheffield Hallam University.
- Özcan, E., & van Egmond, R. (2009). The effect of visual context on the identification of ambiguous environmental sounds. Acta Psychologica, 131(2), 110-119.
- Özcan, E., & van Egmond, R. (2012). Basic semantics of product sounds. International Journal of Design, 6(2), 41-54.
- Özcan, E., & Schifferstein, H. N. J. (2014). The effect of (un)pleasant sound on the visual and overall pleasantness of products. In Proceedings of the 9th International Conference on Design & Emotion (pp. 601-606). Bogota, Colombia: Ediciones Uniandes.
- Özcan, E. (2014). The Harley effect: Internal and external factors facilitating positive experiences with product sounds. Journal of Sonic Studies, 6(1), A07.
- Özcan, E., van Egmond, R., & Jacobs, J. J. (2014). Product sounds: Basic concepts and categories. International Journal of Design, 8(3), 97-111.
- Paivio, A (1991). Dual coding theory – Retrospect and current status. Canadian Journal of Psychology – Revue Canadienne De Psychologie, 45(3), 255-287.
- Paivio A. (2007). Mind and its evolution: A dual coding theoretical approach. Mahwah, NJ: Erlbaum.
- Parizet, E., Guyader, E., & Nosulenko, V. (2008). Analysis of car door closing sound quality. Applied Acoustics, 69(1), 12-22.
- Peck, J., & Childers, T. L. (2008). Sensory factors and consumer behavior. In C. P. Haugtvedt, P. M. Herr, & F. Kardes (Eds.), Handbook of consumer psychology (pp. 193-220). New York, NY: Psychology Press.
- Ramachandran, V. S., & Hirstein, W. (1999). The science of art: A neurological theory of aesthetic experience. Journal of Consciousness Studies, 6(6-7), 15-51.
- Russell, J. A. (1980). A circumplex model of affect. Journal of Personality & Social Psychology, 39(6), 1161-1178.
- Russell, J. A. (2003). Core affect and psychological construction of emotion. Psychological Review, 110(1), 145-172.
- Russell, J. A., & Mehrabian, A. (1977). Evidence for a three-factor theory of emotions. Journal of Research in Personality, 11(3), 273-294.
- Saldaña, H. M., & Rosenblum, L. D. (1993). Visual influences on auditory pluck and bow judgments. Perception and Psychophysics, 54(3), 406-416.
- Schifferstein, H. N. J., & Tanudjaja, I. (2004). Visualising fragrances through colours: The mediating role of emotions. Perception, 33(10), 1249-1266.
- Schifferstein, H. N. J., & Cleiren, M. P. H. D. (2005). Capturing product experiences: A split-modality approach. Acta Psychologica, 118(3), 293-318.
- Schifferstein, H. N. J. (2006). The perceived importance of sensory modalities in product usage: A study of self-reports. Acta Psychologica, 121(1), 41-64.
- Schifferstein, H. N. J., & Desmet, P. M. A. (2007). The effects of sensory impairments on product experience and personal well-being. Ergonomics, 50(12). 2026-2048.
- Schifferstein, H. N. J., & Desmet, P. M. A. (2008). Tools facilitating multisensory product design. The Design Journal, 11(2), 137-158.
- Schifferstein, H. N. J., & Spence, C. (2008). Multisensory product experience. In H. N. J. Schifferstein & P. Hekkert (Eds.), Product experience (pp. 133-161). Amsterdam, the Nerthlands: Elsevier.
- Schifferstein, H. N. J., Otten, J. J., Thoolen, F., & Hekkert, P. (2010). The experimental assessment of sensory dominance in a product development context. Journal of Design Research, 8(2), 119-144.
- Schifferstein, H. N. J., & Hekkert, P. (2011). Multisensory aesthetics in product design. In F. Bacci & D. Melcher (Eds.), Art and the senses (pp. 529-555). Oxford, UK: Oxford University Press.
- Schifferstein, H. N. J. (2011). Multi-sensory design. In Proceedings of the Conference on Creativity and Innovation in Design (pp. 361-362). New York, NY: ACM.
- Seo, H. S., & Hummel, T. (2011). Auditory-olfactory integration: Congruent or pleasant sounds amplify odor pleasantness. Chemical Senses, 36(3), 301-309.
- Sottek, R. (2008). Advanced methods and tools for sound quality evaluation. In Proceedings of the 23rd National Conference on Noise Control Engineering and Sound Quality Symposium (pp. 1573-1583). Red Hook, NY: Curran Associates.
- Spence, C., & Gallace, A. (2011). Multisensory design: Reaching out to touch the consumer. Psychology & Marketing, 28(3), 267-308.
- Spence, C., & Zampini, M. (2006). Auditory contributions to multisensory product perception. Acta Acustica united with Acustica, 92, 1009-1025.
- Spence, C., & Zampini, M. (2007). Affective design: Modulating the pleasantness and forcefulness of aerosol sprays by manipulating aerosol spraying sounds. CoDesign, 3(S1), 107-121.
- Stevens, J. P. (2002). Applied Multivariate Statistics for the Social Sciences (4th Edition). Mahwah, NJ: Lawrence Erlbaum Associates.
- Susini, P., Lemaitre, G., & McAdams, S. (2012). Psychological measurement for sound description and evaluation. In B. Berglund, G. B. Rossi, J. T. Townsend, & L. R. Pendrill (Eds.), Measurements with persons: Theory, methods, and implementation areas (pp. 227-253). New York, NY: Psychology.
- Susini, P., McAdams, S., Winsberg, S., Perry, I., Vieillard, S., & Rodet, X. (2004). Characterizing the sound quality of air-conditioning noise. Applied Acoustics, 65(8), 763-790.
- Thomson, D. M. (2016). Sensory branding: Using brand, pack, and product sensory characteristics to deliver a compelling brand message. In B. Piqueras-Fiszman & C. Spence (Eds.), Multisensory flavor perception: From fundamental neuroscience through to the marketplace (pp. 313-336). Cambridge, UK: Woodhead.
- Valdez, P., & Mehrabian, A. (1994). Effects of color on emotion. Journal of Experimental Psychology: General, 123(4), 394-409.
- van Dorp Schuitman, J. (2011). Auditory modelling for assessing room acoustics (Doctoral dissertation). Delft University of Technology, Delft, the Netherlands.
- van Egmond, R. (2008). The experience of product sounds. In H. N. Schifferstein & P. Hekkert (Eds.), Product experience (pp. 69-89). Amsterdam, the Netherlands: Elsevier.
- Västfjäll, D., Gulbol, M. A., Klieiner, M., & Garling, T. (2002). Affective evaluation of reactions to exterior and interior vehicle auditory quality. Journal of Sound and Vibration, 255(3), 501-518.
- Västfjäll, D., Gulbol, M. A., & Kleiner, M. (2003). “Wow, what car is that?”: Perception of exterior vehicle sound quality. Noise Control Engineering Journal, 51(4), 253-261.
- Vickers, Z. M. (1983). Pleasantness of food sounds. Journal of Food Science, 48(3), 783-786.
- Wastiels, L., Schifferstein, H. N. J., Wouters, I., & Heylighen, A. (2013). Touching materials visually: About the dominance of vision in building material assessment. International Journal of Design, 7(2), 31-41.
- Wundt, W. (1896). Grundriss der psychologie [Outline of Psychology]. Leipzig, Germany: Engelmann.
- Zampini, M., Guest, S., & Spence, C. (2003). The role of auditory cues in modulating the perception of electric toothbrushes. Journal of Dental Research, 82(11), 929-932.
- Zampini, M., & Spence, C. (2004). The role of auditory cues in modulating the perceived crispness and staleness of potato chips. Journal of Sensory Studies, 19(5), 347-363.
- Zhang, Y., Feick, L., & Price, L. J. (2006). The impact of self-construal on aesthetic preference for angular versus rounded shapes. Personality and Social Psychology Bulletin, 32(6), 794-805.
- Zwicker, E., & Fastl, H. (1999). Psychoacoustics: Facts and models. Berlin, Germany: Springer.
