Understanding the Attributes of Product Intervention for the Promotion of Pro-Environmental Behavior: A Framework and Its Effect on Immediate User Reactions
Minjung Sohn and Tek-Jin Nam*
Department of Industrial Design, KAIST, Daejeon, Republic of Korea
Product design has become increasingly influential in changing user behaviors in order to reduce resource consumption. Among various contexts, users waste resources which they do not pay for. Influencing users’ immediate behavior can be an effective strategy for sustainable design. In this perspective, we aimed to investigate the method of designing products to induce users’ immediate reaction, especially to understand the design attributes of product intervention. Through analytic interviews regarding 40 representative intervention concepts, we identified four attributes of cognitive intervention and three attributes of physical intervention. We then created a framework that included these two types of intervention, their attributes, and scales thereof. Design workshops using the suggested framework revealed its usefulness in the concept development process for the determination of design direction and the enhancement of communication among designers, leading to an increase in ideas. An online user survey verified that the seven design attributes were critical elements for inducing users’ immediate reactions in a water-use context. We expect that the intervention framework can be used as a basis for knowledge in the field of design for sustainable behavior.
Keywords – Pro-environmental Behavior, Product Intervention, Design Attributes.
Relevance to Design Practice – Understanding the design attributes of product intervention helps designers to develop a structural approach to promote pro-environmental behaviors. The intervention framework and survey results can be used as references in the concept development process in design practices.
Citation: Sohn, M., & Nam, T. -J. (2015). Understanding the attributes of product intervention for the promotion of pro-environmental behavior: A framework and its effect on immediate user reactions. International Journal of Design, 9(2), 55-77.
Received July 18, 2013; Accepted February 13, 2015; Published August 31, 2015.
Copyright: © 2015 Sohn and Nam. Copyright for this article is retained by the authors, with first publication rights granted to the International Journal of Design. All journal content, except where otherwise noted, is licensed under a Creative Commons Attribution-NonCommercial-NoDerivs 2.5 License. By virtue of their appearance in this open-access journal, articles are free to use, with proper attribution, in educational and other non-commercial settings.
*Corresponding Author: tjnam@kaist.ac.kr.
Minjung Sohn is a PhD student in the Department of Industrial Design at KAIST, Korea. She received a Bachelor and a Master of Science degree from the same department at KAIST. She researches the design methods for sustainable interaction since she was inspired by Norwegian lifestyle when she was in Norway as an exchange student. She recently conducted a series of user studies to reduce water consumption with various design alternatives which are created based on the intervention framework.
Tek-Jin Nam is a Professor in the Department of Industrial Design at KAIST, Korea. He received a B.S. and a M.S. in Industrial Design from KAIST, and a PhD from the Department of Design, Brunel University. He leads Co.design:Inter.action Design Research Laboratory at KAIST. He have been an executive director of Korea Society of Design Science and worked as a program committee member and an editorial board member in international conferences and journals including IASDR, CHI, and Archive of Design Research. He is interested in generating knowledge for design practice and advancing design as an academic discipline. His main research areas are augmented design, co-design, interaction design, and creative design methods and tools.
Introduction
The environmental effects that occur when users interact with products have become a serious problem due to the increasing number of interactive products that consume resources such as energy and fuel. Thus, the importance of design studies that focus on reducing environmental impact in the use phase has increased (Charter & Tischner, 2001). If, as Norman (2002) tells us, the design of a product causes users to react to it in particular ways, then product design should be able to induce users to act in a sustainable way (Rodriguez & Boks, 2005). The use of public goods, with which multiple uses interact, is one of the main areas in which user behavior impacts on the environment. Users tend to waste public resources because the results of their consumption are not directly visible to them: they are not responsible for the impacts of their consumption. For example, people waste water in public toilets and consume a great deal energy in their offices, even though they attempt to save these resources in their homes. In these situations, the design of a given product will act as the primary means for providing an immediate stimulus for users’ decision-making. It is vital to make users react to the product and make correct decisions while they interact with it.
In the field of design for sustainable behavior, there have been suggestions for various design methods and studies of the design cases have verified their effectiveness. Such findings have mainly focused on how to design products that stimulate users to behave in a sustainable way. These research outcomes, including design strategies and tools (Lockton, Harrison, & Stanton, 2010b; Lofthouse, 2006), are helpful references for design practice insofar as. Strategies based on the design theories and cases can be used as references for determining concept directions in design processes. At the same time, these theories mostly consist of high-level strategies that are difficult to apply to the guidance of detail designs, such as what kind of information should be delivered in a specific context or how strong feedback needs to be. On the other hand, several studies have been undertaken to identify the product dimensions that affect users’ sustainable behaviors. These studies provide detailed design elements that can help designers more easily develop product ideas (Pousman & Stasko, 2006). However, the scope of these studies is largely limited to eco-feedback and displays, which do not include the physical aspects of a product. In order to apply the research outcome to design practice it is necessary to provide both design attributes and ways in which those attributes can be used. In order to achieve this, the research needs to investigate broader aspects of user-product interaction.
In this paper we focus on how to design products that can induce sustainable behaviors immediately. We created a knowledge framework by identifying design attributes and their design directions for the promotion of sustainable use. We then verified how the framework and design attributes are applicable to design activity and outcomes. Product design that induces sustainable use can be understood as a kind of intervention, which is explained in the field of environmental psychology as a stimulus that changes behaviors. Design researchers also use the terms product intervention or design intervention to express an intervention that occurs through a product (Lilley, 2009). In this study, we use the term product intervention, which corresponds with the range of our research.
This research was conducted in three phases. Firstly, to identify the design attributes, we conducted semi-structured interviews with designers and comprehensively analyzed existing design cases. Secondly, to verify the usefulness of the intervention framework, we conducted design workshops and explored how the contents of the framework affect the concept development process. Lastly, through an online user survey, we evaluated design alternatives that were developed by applying each attribute. We measured an immediate impact on users’ awareness of water consumption, willingness to save water, and so on, according to the intervention level of each attribute. Based on the results of our study, we discuss the implications of using the design attributes and framework in effective ways within design practice.
Literature Review
Interventions for Sustainable Behavior
The design of product interventions for pro-environmental behaviors has been researched sporadically in various fields such as design, environmental psychology, human-computer interaction (HCI), and ergonomics.
A stimulus that encourages users’ pro-environmental behavior is often called an intervention in the field of environmental psychology (Abrahamse, Steg, Vlek, & Rothengatter, 2005; De Young, 1993; Steg & Vlek, 2009). Steg and Vlek (2009) use the term to indicate various stimuli that affect behavioral determinants and promote energy-saving behaviors. Recently, researchers in the design and HCI fields have begun to regard artifacts and interactions that serve to make users’ behavior environmentally friendly as types of intervention. While the meaning of this term in an environmental psychology context covers a wide area—including regulations, policies, and education—its meaning has been translated in the design and HCI fields as design intervention or product intervention (Lilley, 2009). Likewise, eco-feedback is often called feedback intervention in HCI studies (Fidler et al., 2012; Foster, Lawson, Wardman, Blythe, & Linehan, 2012; Froehlich, Findlater, & Landay, 2010; Pierce, Fan, Lomas, Marcu, & Paulos, 2010). Consequently, the term intervention is commonly used to refer to a product itself or the way in which a product changes user behaviors in a sustainable way. In several ergonomics studies, researchers have tried to decrease resource consumption by increasing the usability of a product with detailed design changes. For example, Sauer, Wiese, and Ruttinger (2004) conducted an experiment to examine the effects on users’ behaviors when using a cup scale and a liter scale for an electric kettle. They referred to this as ecological performance and the design stimuli can be understood as an indirect form of product intervention.
Related studies in the design field have derived from the concept that a product can be designed to make users behave in an environmentally friendly way (Rodriguez & Boks, 2005). These studies are based on the theory that user behavior can be changed by a reaction to the shape, mechanism, or function of the product itself (Norman, 2002). Several studies, such as script approach (Jelsma & Knot, 2002) or forced-functionality strategy (Wever, van Kuijk, & Boks, 2008), have shown that users behave in different ways according to the functions of a product that enable or constrain users in regard to sustainable behaviors. Recent studies have also attempted to include these structural design strategies by analyzing design examples or referencing prior studies (Bhamra, Lilley, & Tang, 2011; Lidman & Renström, 2011; Lockton et al., 2010b; Tromp, Hekkert, & Verbeek, 2011; Zachrisson & Boks, 2012).
Previous research has reported that interventions can be classified according to their level of intrusiveness (Lockton, 2013). In the reports of Nuffield Council on Bioethics (2007), the intervention ladder was proposed which divided intervention into eight levels according to the intensity from the least to the most intrusive step. In the design field, Zachrisson and Boks (2012) classified product intervention into three levels according to the subject of control. This is aligned with the force posited as one of the influential types of intervention in Tromp et al.’s (2011) recent study. It indicates that the strength of intervention can be classified as ranging from weak to strong. Although subtle differences exist among these studies, they commonly assert that the strength of intervention differs across product designs. This also means that interventions vary in strength according to product design, accordingly it is important to set the intensity at an appropriate level by considering a product’s use context.
Methods for Designing Product Interventions
Research on design methods for inducing sustainable behavior can be classified into three types according to outcome: i) studies that propose design strategies, ii) studies that develop design tools, and iii) studies that identify design attributes.
The research of Zachrisson and Boks (2012) is representative of the studies that have suggested design strategies for product intervention. In accordance with the distribution of control, they divided design strategies into three types: informing, persuading, and determining. This category includes most design strategies that were created based on the results of existing studies. More specific strategies are proposed by Bhamra et al. (2011), who found seven types of design intervention strategies: eco-information, eco-feedback, eco-spur, eco-choice, eco-steer, eco-technical intervention, and clever design. The strategies proposed in prior studies are also included in the above seven. For example, Lilley’s (2009) behavior steering is nearly identical to the strategies steer (Lidman & Renström, 2011), eco-steer (Bhamra et al., 2011), and steering (Zachrisson & Boks, 2012). Conversely, a different approach has been taken in several papers that borrow knowledge from other fields, such as psychological theories or persuasive technology (Arroyo, Bonanni, & Selker, 2005). Froehlich et al. (2010) argued that there is a need to apply the theories of behavioral psychology to design for behavior change. They offered the most popular motivation techniques from behavioral psychology. Thus, many design strategies and principles can be used as good references for designers in the product design process.
Several studies (Lofthouse, 2006; Zachrisson, Storrø, & Boks, 2012) have proposed tools for designers, such as Lockton’s Design with Intent (Lockton, Harrison, & Stanton, 2010a). These tools are differentiated from traditional eco-design tools, including life cycle assessment (LCA) (Bovea & Pérez-Belis, 2012; Wimmer, Ostad-Ahmad-Ghorabi, Pamminger, & Huber, 2008). Traditional eco-design tools in the form of checklists and tables are used at the beginning of a product development process to find and solve problems, however, user behaviors are not generally considered in these kinds of tools. On the other hand, several design researchers have proposed tools that can be directly used for developing design concepts that lead to sustainable behavior. In particular, Lockton et al. (2010a) provides six lenses for design with related principles and cases. They also discovered that the tool could help designers to develop concepts for sustainable behaviors. Similarly, Lofthouse (2006) suggested a web-based tool that provides strategic categories and design examples for designers to use intuitively. Additionally, Zachrisson et al. (2012) proposed a tool that can help designers to determine which strategy to use in a design process.
While these design strategies deal with how to design products that change user behaviors, few studies focus on identifying what to design for the promotion of sustainable behaviors. The studies of Fang and Hsu (2010) and Froehlich et al. (2012) are the most similar in purpose to the present study, although their scopes differ. Fang and Hsu (2010) suggested four design dimensions—ambient, aesthetic, emotionally-engaged, and metaphorical—by analyzing prior studies of persuasive feedback systems. Froehlich (2011) identified design spaces for eco-feedback, including interactivity, motivational and persuasive strategies, social aspects, comparison, data representation, display medium, information access, and actionability. Each design space includes very detailed design strategies. However, in another study, Froehlich et al. (2012) discussed data granularity, time granularity, comparison, and measurement unit as design dimensions of eco-feedback displays. Compared to his prior study of design spaces, this one reduced the dimensions for a specific product. Studies on information systems and peripheral displays in the HCI field must also be reviewed, as many designs for sustainable behavior have been and can be developed in the form of information systems such as eco-feedback. Pousman and Stasko (2006) suggested information capacity, notification level, representational fidelity, and aesthetic emphasis as design elements of ambient information systems based on Matthews, Rattenbury, Carter, Dey, and Mankoff (2003)’s study.
As we have shown, existing studies on product intervention design have mainly suggested design strategies, but have not focused much on what to design. In addition, studies identifying design dimensions or spaces have limited scopes, such as feedback and display design. However, as argued in various studies in the design field, constraining or forcing strategies have also been known to effectively change user behaviors. Overall, possible design attributes need to be explored from a holistic perspective. Another limitation of existing studies is that it is difficult to systematically analyze the effects of design cases on user behaviors and the environment. Although the results of prior studies indicate the effects of design strategies in terms of independent products and certain contexts, they are not effective for comparing the main and side effects of these strategies. It will be easier for designers to determine concept directions in design practice if they are given a framework for comparing the effects of several design alternatives. Thus, the field requires a framework that can provide the design attributes of product intervention and associated design directions. This will help us to accumulate study outcomes from various research fields.
Understanding the Attributes of Product Intervention
Aim and Method
The first aim of the research was to identify what kinds of design attributes were related to product intervention. We conducted semi-structured interviews with designers to identify the attributes of product intervention that affect user behaviors. To help the interviewees easily discuss design attributes, we provided various design cases as starting points. This was achieved through two tasks: analyzing design cases and transforming the cases into new ideas. The first task was to identify the existing attributes applied in the design cases, and the second task was to explore more attributes that were not applied in the existing cases but had the potential to be designed in the future.
Design Case Selection
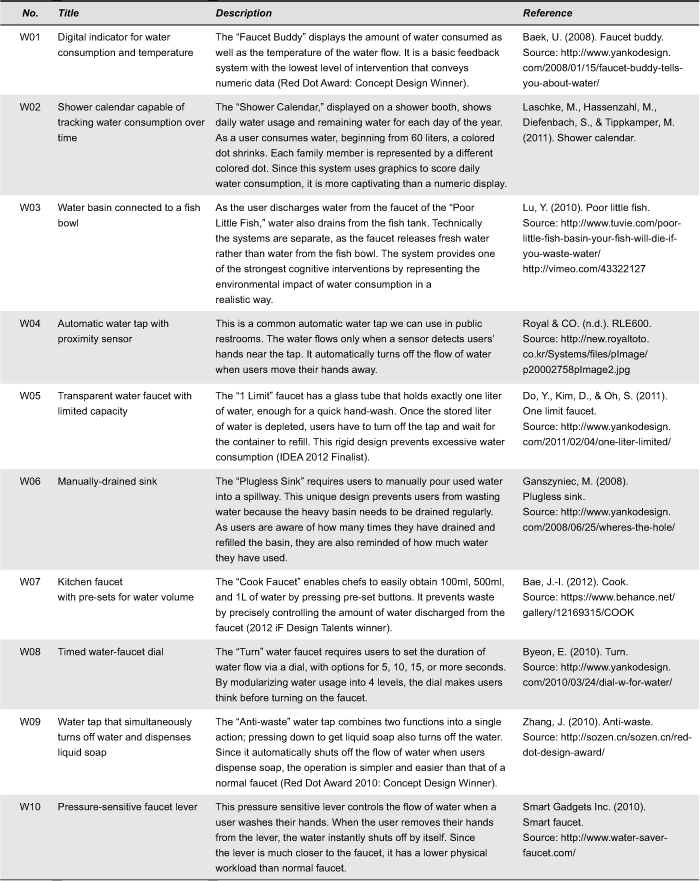
The design cases were collected from various areas, including academic fields and design practices. From the academic area, we collected design cases suggested in conference proceedings and journal articles in the fields of design and HCI. To collect practical design cases, we investigated commercial products as well as design award winners spanning a period of ten years, as well as design concepts introduced in popular design web pages. Cases were selected based on whether or not they were appropriate for the scope of this research, using the following criteria: i) The purpose of the design case was to reduce environmental impact in product-user interaction, ii) the case promoted changes in user behavior, and iii) the case was a product design concept. We collected 86 product design cases that fit these criteria, and 40 were selected as representative cases after eliminating similar concepts. Each representative case was presented as a concept card with a graphic image and a one-sentence explanation (Figure 1). The cases were classified into three groups according to the purposes of the respective concepts. The point of this was to help the interviewees focus on the reasons for intervention in terms of the differences among the designs and not to evaluate them according to their needs regarding the product. The three groups consisted of 15 water-saving concepts, 15 energy-saving concepts, and 10 concepts for other resources (Appendix). Among the three groups, only one randomly chosen group of cases was used for each interview, as the participants easily lost focus after being interviewed about one set of design cases in the pilot study.
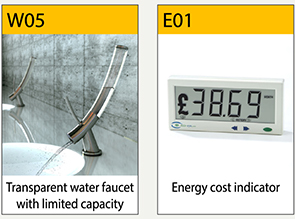
Figure 1. Examples of concept cards. (Copyright: Yonggu Do, Dohyung Kim & Sewon Oh (W05) / Eco-eye Ltd. (E01) Reprinted with permission.)
Interview Tasks
The interviews consisted of two sessions: analysis and design exploration. The task of the first session was to discuss each case in a set by following the triadic elicitation method (Hanington & Martin, 2012). The participants were asked to divide the cases into three groups according to the strength of intervention and explain why the three groups were different from each other. The moderator identified two or three cases in different groups and asked why one case had a different degree of intervention from another case (or cases). In the second session, the participants were asked to transform several design cases in more intervening and less intervening ways (Figure 2). While developing new ideas based on the existing design cases, they were permitted to discuss which design attributes were related to the product intervention.
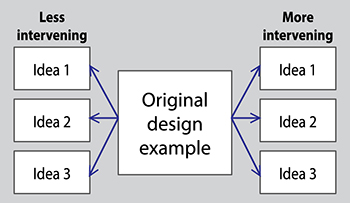
Figure 2. Task of the second interview session.
Participants
In order to successfully complete the two interview tasks, we recruited 20 designers (13 females; average age: 27.5; average design experience: 3.5 years post-graduation), including graduate students in an industrial design department and professional designers. The participants were required to possess the following abilities: i) to discuss usage contexts with futuristic concepts that they had not experienced, ii) to critically analyze the form and function of any product, and iii) to design new concepts for the second interview task.
Analysis
The results of the interviews were iteratively analyzed using the grounded theory method (Muller & Kogan, 2010). All of the interview contents were scripted and about 700 properties were collected. After selecting the valid properties, the attributes were derived through open coding, axial coding, and selective coding.
Only 494 properties corresponded to our research questions and were deemed valid. These included properties such as “the representation was too cruel,” “it shows negative results with a dying tree,” and “because this is too big [in size].” Excluded properties included answers that repeated the question (e.g., “too intervening”), repeated the concept of the design case (e.g., “because it shows the electric charges”), or were related to design considerations (e.g., “[this product] makes me want to test the function”).
Through open coding, the properties were grouped into similar patterns without any preset assumptions and were sorted into 50 patterns that made interventions stronger or weaker. For example, from the property “presenting an energy charge bothers me,” we could derive “interpreting data in monetary value” as a pattern in a strong intervention. We then analyzed what kinds of product elements were related to each pattern and grouped them through axial coding in terms of how the patterns derived user behaviors. In this way, we identified two dimensions containing seven attributes of product intervention. For example, the patterns of “interpreting data in monetary value” and “presenting exact data in numeric expression” were both related to the “contents of information.” Thus, interventions vary according to “how to interpret the data into the contents of information,” and we derived “interpretation” as one of the main attributes of intervention.
Results: Two Types of Interventions and Their Seven Attributes
From the interviews we identified two types and seven attributes of product intervention. The two types were cognitive intervention and physical intervention. Cognitive intervention motivates users to behave in sustainable ways by intervening in their decision-making processes. This includes not only feedback interventions but also information about product usage and user behaviors. Physical intervention, on the other hand, occurs when users operate a product with constraining or enabling functions. This changes user behaviors as they react to the forms or functions of the product’s physical features, but it does not necessarily motivate users to change their behaviors.
Attributes of Cognitive Intervention
Interpretation
Our research identified “interpretation” as one of the most important attributes of cognitive intervention. The strength of intervention and its behavioral effects are related to “how to interpret information,” whether the information delivers factual data or a corresponding data value. We identified four steps of interpretation: i) a fact that is not interpreted at all, ii) judgment of a grade or score, iii) evaluation with a new type of value, and iv) instruction that directly commands the user’s behavior. These types of content are related to the concept of a product or a metaphor for information.
Some design cases deliver “factual data” that include identical information regardless of the usage context, such as national standards or cultural differences. Such facts include “100 liters,” “50 watts,” “15 degrees Celsius,” and whether or not energy is charged. Presenting a fact can be a helpful intervention because it helps users to become aware of how much they consume (Figure 3, W01). Factual data can be interpreted into a grade or score that is judged in terms of the standards of each usage context. For example, the size of a circle can show whether the amount of consumption (factual data) is large or small (W02), and the color of an LED light can show whether or not a user drives efficiently (R01). Users generally tend to interpret the meaning of factual data on their own, but their judgments could differ according to their own characteristics and their basic knowledge about environmental impacts. Presenting judgments helps users perceive their usage behaviors more easily.
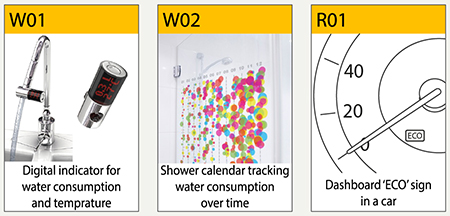
Figure 3. Factual (W01) and judged (W02 & R01) information. (Copyright: KPD Inc. (W01) / Laschke, Hassenzahl, Diefenbach, & Tippkamper (W02). Reprinted with permission.)
Another type of interpretation involves presenting the value of the consumption amount. The evaluation results can differ in terms of culture and regulations. The data can be interpreted as a monetary value (Figure 4, E01) or an environmental value (E03). Comparing oneself to one’s neighbors is an example of evaluation. The participants reacted very differently to this type of information because each person has different values. While many of the participants were sensitive to the interventions presented as monetary advantages and disadvantages, some derived strong motivation from interventions interpreted as environmental impacts, such as disappearing polar bears or dying trees.
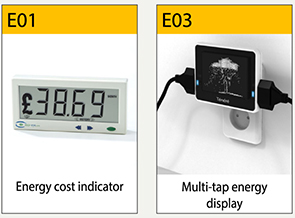
Figure 4. Evaluated information (E01 & E03). (Copyright: Eco-eye Ltd. (E01). Kim, Kim, & Nam (E03). Reprinted with permission.).
The most intervening information was discussed as giving “instructions” that directly commanded users to take action. Based on the interviews, it seems that the participants’ biggest problem was that, even though they noticed that they were wasting resources, they did not know how and when to react to that information. Instructing users to complete the next action is the easiest way for interventions to help users decide what to do, although there was no example of this type of information among the design concepts in our cases.
Orientation
The orientation of interpreted content was identified as one of the attributes of cognitive intervention. There are two perspectives that represent half a cup of water: “half empty” and “half full.” In this way, the amount of consumption can be presented as a positive direction (e.g., a recovering forest), a negative direction (e.g., a disappearing polar bear), and bidirectional (e.g., E05 in Figure 5—a smiley face when the light button is off and a sad face when it is on).
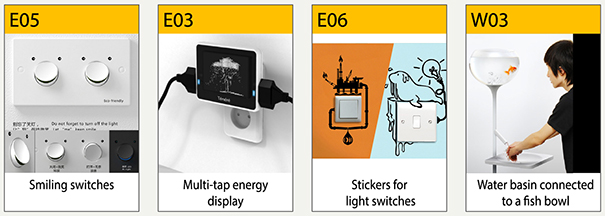
Figure 5. Bidirectional (E05) and negative (E03, E06,& W03) interpretations. (Copyright: Lite-on Award (E05). / Kim, Kim, & Nam (E03). / Antoine Tesquier Tedeschi, Hu2 Design 2015 (E06). / Yan Lu (W03). Reprinted with permission.)
We found that the participants perceived contents which were expressed with metaphors as stronger interventions because empathic metaphors, such as animals and plants, made them feel guilty and strongly intervened in their behaviors. Participants said that a sweating seal (E06) was more empathic than a dying tree (E03) because they found an animal more pitiful than a plant (Figure 5). Participants also mentioned that the negative metaphors were more intervening than positive metaphors. When a product evokes positive emotions, as with humor (e.g., E05), the intervention is bearable for users. However, participants stated that the sweating seal (E06), dying tree (E03), and goldfish in a bowl (W03) were strongly intervening because the content of the information was related to maleficence (Figure 5).
Representation Fidelity
Representation fidelity was also revealed as one of the important attributes of cognitive intervention. It indicates how realistically content is expressed and is one of the common design elements suggested in previous research about ambient information systems. Representation fidelity is explained as “a system’s display components and how the data from the world is encoded into patterns, pictures, words, or sounds” (Pousman & Stasko, 2006). Based on semiology, there are three levels of representation fidelity: symbolic, iconic, and indexical (Mullet & Sano, 1995).
In the results of the interviews, representation fidelity was also revealed as a main attribute of cognitive intervention. Participants said that interventions were more intrusive with specific and realistic graphics than with abstract expressions. Information presented with physical substance, such as W03 and R02 (Holstius, Kembel, Hurst, Wan, & Forlizzi, 2004), is expected to be more intervening because it is visually more realistic (Figure 6). For example, E03 expressed a tree in iconic graphics using white dots on a black background. Participants thought that the message of the content would be stronger if the tree looked like a photo of a real tree with leaves (indexical representation). Beyond the graphical expression, the participants transformed this concept of a stronger intervention into a monitor that was physically interactive–moving, bending, or falling down according to energy consumption. They also mentioned that W03 was too intrusive because there was a living creature in the product, and the intervention could be weakened if the fish were shown in a graphic instead of in reality.
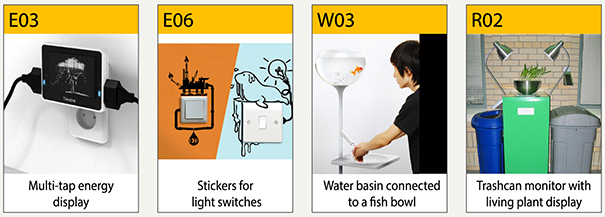
Figure 6. Representation fidelity from low (iconic, E03 & E06) to high (realistic, W03 & R02). (Copyright: Kim, Kim, & Nam (E03). / Antoine Tesquier Tedeschi, Hu2 Design 2015 (E06). / Yan Lu (W03) / Holstius, Kembel, Hurst, Wan, & Forlizzi (R02). Reprinted with permission.)
The interviews demonstrated that representation fidelity is not limited to visual reality, but also extends to sound. We can expect stronger interventions to occur with more realistic sounds. From the concept of E06, participants developed the new idea of adding sound effects to the sticker, which would be more intrusive if the sound effects were very realistic, such as the sound of machines in a factory or the crying of a seal.
Degree of Exposure
Degree of exposure—the amount of information to which users are exposed—was identified as one of the attributes of cognitive intervention. It includes strength of expression, frequency, and duration. Strength of expression is how strongly information attracts users’ attention; frequency is how often that information is displayed; and duration is how long users are exposed to the information. This attribute is similar to the notion of “notification levels,” which is one of the design dimensions of ambient information systems (Pousman & Stasko, 2006). “Frequency and duration” were also suggested as elements of feedback in a prior study (Froehlich et al., 2012). In our interviews, participants were able to envision those detailed attributes while transforming an existing design concept by imagining a specific usage context.
Strength of expression was found to be the easiest element with which to control the degree of exposure of cognitive intervention. Participants changed the colors of graphic elements, strengthened the intensity of light, or resized the product itself to attract more attention from the user. They added sound to visual information to create stronger interventions, increasing the volume to make them even stronger. For example, if E07 (Figure 7) were expressed in bright red and accompanied by a sound alert, it would intervene more.
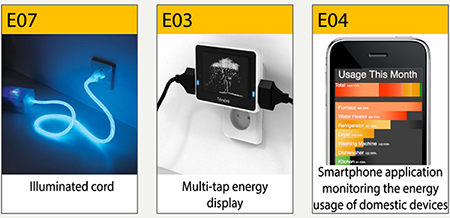
Figure 7. Design examples of different degrees of exposure. (Copyright: Gustafsson & Gyllenswärd (E07) / Kim, Kim, & Nam (E03) / Petersen, Steele, & Wilkerson (E04). Reprinted with permission.)
Controlling frequency is another way to control the degree of exposure to cognitive intervention. The participants said that E04 was more intervening than E03 because they could get information “more often” with the portable device (E04) than with the standalone device (E03). They also came up with ideas for stronger interventions based on E07 with a light that flickers often, flows faster, or is installed in several places to make users pay more attention to the product.
Regarding the duration of exposure to information, users tend to be accustomed to long and continuous visual stimuli, while they cannot cope with longer audio stimuli. For example, participants transformed E07 with the idea of providing a flickering light and a sound effect that would last until the user reacted to the product. This is an example of controlling the duration of information to change the level of intervention.
Attributes of Physical Intervention
Functional Constraint
The most important attribute of physical intervention was “functional constraint,” which is the extent to which the function is limited in achieving the product’s original purpose. Existing cases often involve blocking user behaviors related to resource consumption through the use of physical constraints. This type of intervention is especially useful for resources such as water and energy, which seem to be infinite, because it prevents wasting resources by controlling the beginning, end, and speed of consumption.
To intervene in user behaviors by constraining functions, automatic shutdown was used as a common design strategy. For example, automatic faucets (Figure 8, W04) in public toilets cut off the stream automatically when they are not in use and provide moderate flow speed. Users behave differently than they do with normal faucets because the behaviors of opening and closing the faucet are removed. E02 automatically separates a battery from a charger, like a toaster, when it is fully charged. Users do not need to pull out the battery, which makes them more comfortable. In this way, although automatic products constrain some functions, they are perceived as convenient and effective interventions.
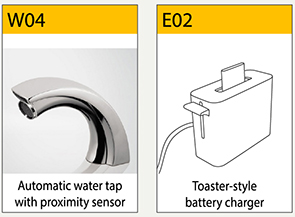
Figure 8. Design examples of automation. (Copyright: Royal &Co. (W04). Reprinted with permission.)
The second strategy for functional constraint is to modularize the amount of resource consumption. For example, if a system provides water in bottles instead of in a continuous flow, users can easily perceive the amount of water consumption because it is easy to count how many bottles of water they have used. W05, a concept called “1 Limit,” limits users to the use of only one liter of water in a glass cylinder (Figure 9). The participants stated that this type of tap intervened in their water-using behavior too much because they had to wait for another liter to come in after the cylinder was empty. They said they would wash their hands much faster with the 1 Limit if they did not have to wait for another liter of water. Similarly, with W06 users would try to use only the water that filled one basin because they did not want to drain the used water several times. W07 and W08 are examples that provide several options using different amounts of water.
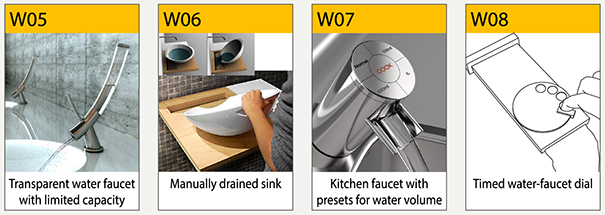
Figure 9. Design examples of modularization. (Copyright: Yonggu Do, Dohyung Kim & Sewon Oh (W05) / Maja Ganszyniec (W06) / Jae Il Bae (W07). Reprinted with permission.)
Operational Complexity
We found that users felt that an intervention was more intrusive when the operation of a product was complex and involved many steps. In contrast, intervention was weakened if an operation was easy and involved simple steps. The design cases W06 and W08 (Figure 10) were said to be examples of more complex interaction than normal products. With W08, users had to calculate or set how much water they would use before they used it, which made participants uneasy because the calculation process was added unnecessarily. W06 was also discussed as a strong intervention because users might consider the process of lifting the basin inconvenient.
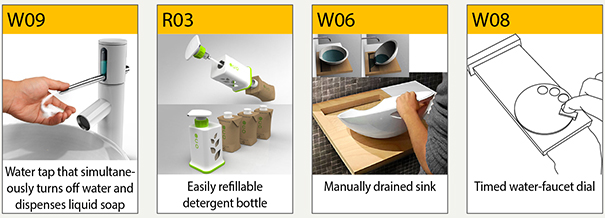
Figure 10. Design examples of operational complexity from simple (W09 & R03) to complex (W06 & W08). (Copyright: Junjie Zhang (W09), SONIC Design (R03), Maja Ganszyniec (W06). Reprinted with permission.)
Meanwhile, the participants said that W09 and R03 (Figure 10) were less intrusive interventions because their interaction processes were simplified. With W09, the behaviors of pumping liquid soap and turning off the tap were combined into one simultaneous action. Similarly, R03 simplified the process of refilling a shampoo container. In this way, an intervention could be considered more intrusive when users have to interact with complex processes and less intrusive with simple and automated interactions.
Physical Workload
We also identified the “physical workload” of a product’s operation as one of the main attributes of physical intervention. This relates to a product’s distance, weight, or position. A product that requires more of a physical workload works as a stronger intervention. Such a product could be in a more distant location, have a heavier weight, or require a difficult posture to control. For example, W06 requires users to drain the used water manually by lifting the basin (Figure 11). The participants said that this was one of the strongest interventions because the basin was quite heavy. They said that they might need more physical energy to lift the basin when it was full of water.
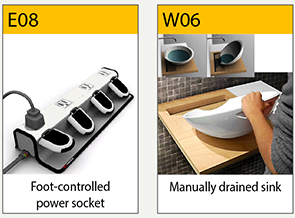
Figure 11. Design examples with low (E08) and high (W06) physical workloads. (Copyright: Mansour Ourasanah (E08), Maja Ganszyniec (W06). Reprinted with permission.).
On the other hand, E08 is a power socket in which users can pull out plugs by stepping on a lever. The participants said that, although it was possible to step on the lever by chance when passing by the power socket, it required much less energy than unplugging a cord by hand by bending forward.
Intervention Patterns
The framework can be described in the form of a matrix, as shown in Figure 12. This matrix contains the two types of intervention, their seven attributes, and the associated scales. The scales are listed according to the strength of intervention from low to high, as an example. We can create an intervention pattern by indicating the scale of each attribute in a design case (Figure 13). For example, W01 has a pattern of low cognitive intervention (Figure 13, left) and W06 has a pattern of high physical intervention (Figure 13, right). We expect that this framework can be used as an effective inspiration source for designers in concept development process. Designers can refer to various alternatives with the scales in each attribute when creating new concept ideas and determine the intrusive level which is most suitable for their design context. In addition, the intervention patterns enable designers to analytically understand about why a product or a design concept is effective to reduce resource consumption.
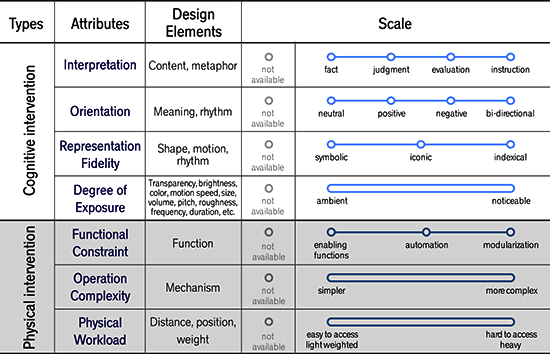
Figure 12. Intervention framework.
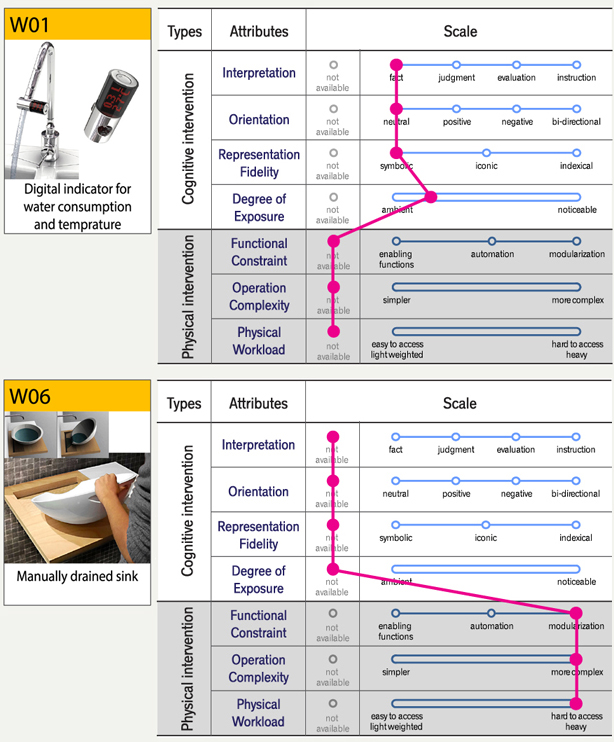
Figure 13. Examples of weak cognitive intervention (W01) and strong physical intervention (W06). (Copyright: Uyeol Baek (W01), Maja Ganszyniec (W06). Reprinted with permission.)
Impact of the Intervention Framework on the Conceptual Design Process
Aim and Method
In the second phase of the study, we conducted design workshops to identify how the framework affects design processes, especially the concept development process. To understand the usefulness of our intervention framework, we compared design development processes in which the framework was and was not utilized. Two groups of designers participated in the workshop. One group used the attribute framework for brainstorming and the other group conducted general brainstorming without the framework. The scales and design examples of the seven attributes were provided on cards, which were delivered in an envelope that explained the attributes (Figure 14) on the basis of the framework’s contents.
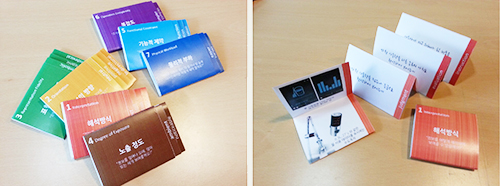
Figure 14. Tools describing design attributes for product intervention.
Participants
We recruited 16 designers to comprise the four teams for the workshop. They were undergraduate and graduate students who had two to eight years of experience with design projects and studies. The designers were evenly dispersed into four teams according to their experience level. Teams A (participants P1 to P4) and B (participants P5 to P8) were provided with the framework tools, while teams C and D were not.
Workshop Process and Task
The workshop lasted about 90 minutes and consisted of four sessions: individual brainstorming, discussion, refinement, and interview. In the individual brainstorming session, the designers developed concept ideas on their own for 20 minutes. They then shared their ideas and developed concepts together for 30 minutes in the discussion session. In the refinement session, they spent 15 minutes individually developing two concepts in detail and creating design briefs with those concepts. In order to fairly compare the design outcomes of the two groups, we gave them equal amounts of time to complete their tasks. Finally, in the interview session, we asked how the tools were helpful for their design process.
The task of the workshop was to design a water supply with a cistern for a camping site. We selected water as the design target because of its fluid and tangible characteristics. Users cannot easily recognize the extent of water consumption because water flows quickly; however, unlike intangible elements such as electricity, users can touch and see the physical substance of water. Therefore, we expected that both cognitive and physical interventions would be helpful for saving water. We selected a camping site as a design context to correspond with our main research question, which was how to design a product intervention that induces instant pro-environmental behaviors. Camping sites are spaces that people use temporarily, so immediate changes in behavior are required at the moment of interaction.
Analysis
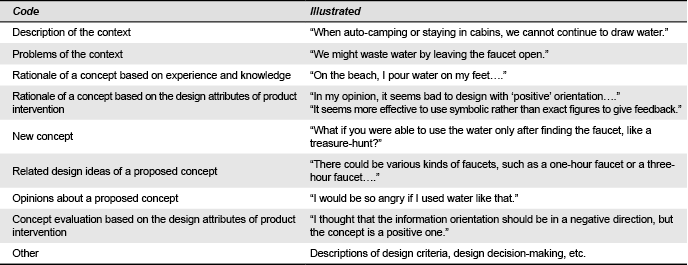
To assess the results of the workshop, we analyzed the verbal and non-verbal protocols of each session through a protocol analysis. The verbal protocols in the discussion session were the most important results through which to understand the concept development process and compare the two groups. All of the conversations were transcribed, reduced to meaningful sentences or phrases, and tagged with nine codes (Table 1). We compared how the designers explained their concepts and developed ideas with and without the design attributes of product intervention. We thereby focused on how the rationale of a concept based on the framework and the concept evaluation based on the attributes were helpful in the concept development phase.
Table 1. Protocol analysis codes and example sentences.
Findings: Impact of the Intervention Framework
When comparing the two workshop groups, we observed that the framework is helpful for developing design directions in the early phases of ideation, communication among designers, and applying various design strategies in concept development. We concluded that the framework was useful for exploring ideas in detail during the concept design process. The findings can be summarized in three parts.
Firstly, the attributes and their scales were used to specify design directions when designers individually brainstormed initial ideas. While examining the seven attributes one by one, they determined the proper scales for each attribute after considering the scales’ effect in the given design context. For example, participant P4 in Team A decided to design a “symbolic” feedback in terms of its representation fidelity. He stated, “I am concerned about the water bill for my home because I pay for it, but I don’t think about consumption or price in numbers at public facilities. That is why I would like to display symbolic feedback instead of exact numbers.” In the interview after the workshop, P7 reported that he had checked the scales of the attributes before beginning ideation and chosen several of them, such as “negative” orientation. P3 also said that the framework was useful because designers could choose which scale is most effective for each attribute. P6 and P8 agreed that the framework could guide the brainstorming process in an unfamiliar context, helping them to easily determine design direction and proceed with ideation.
Secondly, we observed that the designers who used the framework held group discussions to find the proper scale for each attribute. This made it possible for them to discuss a concept in more detail than the group without the framework could. For example, Team A agreed that “interpreted” information, in terms of the interpretation attribute, was more effective than factual information on water supply, especially at a camping site. P2 explained, “it is more effective to express this with other values instead of showing the amount of water consumption as it is,” while P4 asserted that “it will be more effective if we can see the interpreted information, such as the remaining time for the water in the cistern.” Meanwhile, P7 and P8 debated the positive and negative directions of orientation. They did not conclude this argument, as P7 insisted that a negative direction of information change is more effective, while P8 wanted to create a design with a positive orientation. In addition, in a contrast between physical and cognitive intervention, P7 said that he preferred emotionally affecting designs to physically constraining designs. In this way, the designers who worked with the help of the intervention framework had more discussions about the proper scales of each attribute for the given design context.
Thirdly, the group that used the intervention framework developed more concept ideas, which evenly reflected the various attributes. When comparing the number of ideas generated during the two groups’ individual brainstorming and discussion sessions, the group with the framework generated about twice as many ideas as the group without the framework (Figures 15 & 16). Teams A and B produced 44 and 33 ideas, respectively, while Teams C and D developed 17 and 20 ideas, respectively. The results of the protocol analysis showed that the teams with framework easily developed advanced ideas based on the concepts of other designers by referring to the attribute scales. On the other hand, the teams without the framework spent a lot of time evaluating their initial ideas, but could not develop them further. In terms of concept diversity, all seven attributes were evenly applied to the ideas of the groups with the framework (Figure 16, left) while the other two groups mostly focused on two attributes at a time, such as functional constraint and interpretation (Figure 16, right).
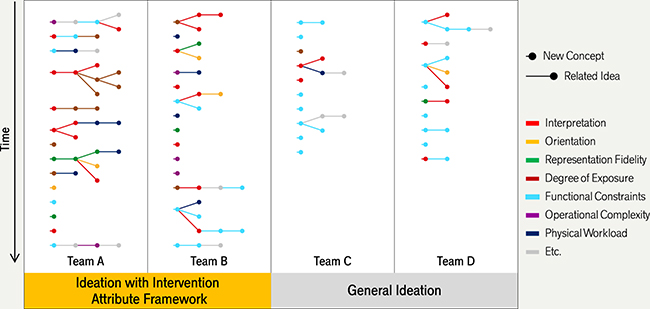
Figure 15. The results of the verbal protocol analysis.
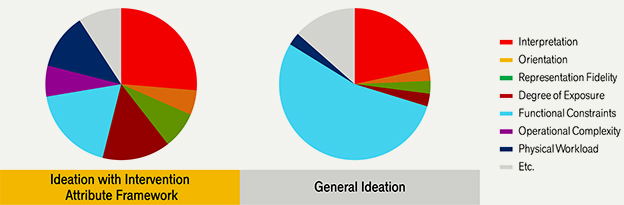
Figure 16. Diversity of concept ideas from the groups with and without the framework.
Effects of the Design Attributes of Product Intervention on User Reactions
Aim and Method
From the results of the concept development workshop, we concluded that the intervention attribute framework can guide designers to design products that induce instant reactions from users. To utilize the framework more effectively, it is necessary to understand the behavioral effects of the design alternatives of each attribute in terms of product categories and context. Thus, we aimed to examine users’ immediate reactions to products containing the seven attributes at different intervention strengths. We conducted an online survey to understand how these design attributes affect users’ reactions. We presented users with product designs for public water supplies and asked them to evaluate the designs.
Stimulus
The designs used in the survey were created using the outcomes of the workshop. In order to compare designs with high and low degrees of attribute intervention, we designed representative product pairs for each attribute and attempted to control all of the other attributes. For attributes with several scales, we selected the two most representative scales with which to create an effective survey. For instance, the scales of the interpretation attribute are described in four ways: fact, judgment, evaluation, and instruction. We used only fact and evaluation as representative aspects of the interpretation attribute because they are opposite in terms of interpretation and are able to control stimuli for the sake of comparison. Each concept was displayed with one or two pictures and accompanying sentences to clearly describe the interaction situation.
In order to verify the attributes of cognitive intervention, we adopted a design that shows the amount of water used (Figure 17). To determine the differences between the low and high degrees of intervention of the interpretation attribute, we showed the amount of water in text form on a display over the sink. To show fact, the water consumption amount was shown in liters. To show evaluation, we displayed the monetary value of the water, which most people easily understand and believe to be important (a, b). For the orientation attribute, the consumed amount was shown as for a neutral orientation and the amount of water remaining in the water tank was shown as for a negative orientation (a, c). These designs were selected for the purpose of presenting opposite directions of information transition as water flows, thereby increasing and decreasing the numbers. The designs for representation fidelity were chosen to describe the same information in symbolic and indexical ways. Symbolic design was implemented by describing the quantity of water remaining in the water tank in text, while indexical design was employed by exposing a part of the water tank such that the water could be viewed (c, d). In order to verify the degree of exposure, a partly exposed water tank was used as a low level of exposure and the whole tank was shown for a high level of exposure (d, e). We expected that users would experience a stronger intervention when viewing the entire exposed water tank.
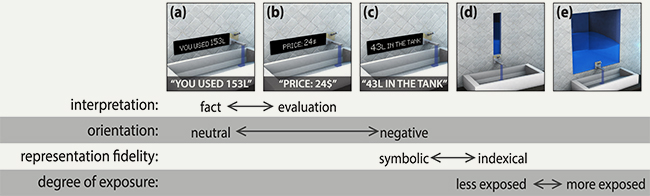
Figure 17. Design stimuli for evaluating the attributes of cognitive intervention.
To verify the attributes of physical intervention, we designed various types of water supplies (Figure 18). In order to compare different levels of functional constraints, we presented an ordinary faucet, button faucet, and blocked sink (f, g, h). Button faucet and blocked sink were concepts that were cited in the design workshop as the most constraining types of products. A button faucet constrains control mechanisms such as strength, temperature, and time. A blocked sink constrains drainage, as it drains water only when the faucet is closed. This makes users not to continuously flow water because the sink will be filled with the used water. To examine operational complexity, we compared ordinary and option faucets (f, i). Compared to the ordinary faucet, which is operated by the simple lift of the lever, the option faucet is more complex, as it involves setting several options before pushing the button. None of the functions for water use were constrained and no physical workload was added, but users felt that the option faucet was complex because of the many required steps. To determine physical workload, we compared a wind-up faucet (j) to button faucet (g) because winding up a handle requires more physical work than simply pushing a button.
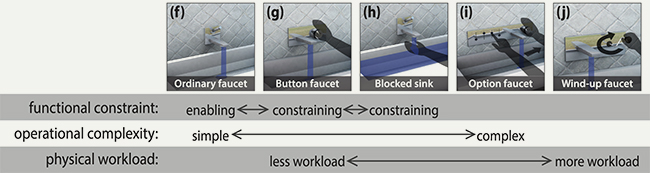
Figure 18. Design stimuli for evaluating the attributes of physical intervention.
Questions and Analysis
Norman (1998) explained the human action cycle in three stages; evaluation, goal formation, and execution stages. In this study, we analyzed interaction in terms of those three stages in order to thoroughly understand how the designs of each attribute affect users. We focused on determining how much a design stimulus affects each step when users encounter a product for the first time. The questions on the survey were constructed to determine how users reacted in terms of water conservation. We presented five questions to see how much users agree to the sentences which represent the stages of interaction cycle. In the evaluation stage, we asked two questions that are related to the status of users and resources: whether the product made them aware of their water consumption and whether they were made conscious by the product that water is a finite resource. In the goal formation stage, we asked users whether they thought that they had to save water, while for the execution staged we asked their willingness to take proper action immediately to consume less water. Although we cannot measure users’ actual behaviors on survey, we assumed that a greater desire of willingness to an immediate action would lead to an action. Finally, we asked the respondents if they would use less water with the given product. The purpose of this question was to determine whether water consumption could be reduced not necessarily by users’ own effort, but because of a particular product. The sentences we used in the survey are described in the legends of the graphs in Figure 19 and 20.
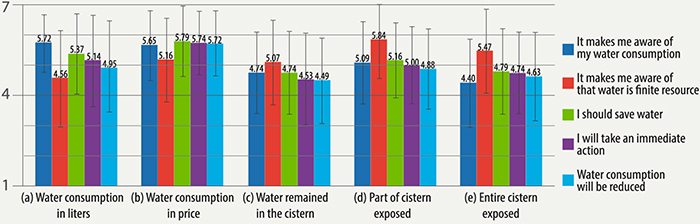
Figure 19. Results of the survey on cognitive intervention designs.
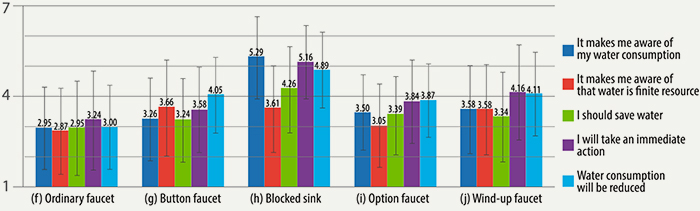
Figure 20. Results of the survey on physical intervention designs.
All of the survey questions were measured on a 7-point Likert scale, and the results were analyzed with a paired-samples t-test to compare the design pairs of each attribute. Stimuli of cognitive and physical intervention were independently investigated in two different surveys, in both of which they were presented in random order. After evaluating each product, we asked the participants to select the most and the least effective designs and requested to explain the reasons behind their selection.
Participants
Respectively, 43 and 38 university students participated in the surveys of cognitive intervention (average age: 22.52, SD: 3.38) and physical intervention (average age: 22.49, SD: 3.41).
Results: Initial Reaction of Users to the Design Concepts
Effects of the Attributes of Cognitive Intervention
Among the design stimuli of cognitive intervention, the design presenting the water price which gained 5.72 points was revealed to be the most effective design for reducing water consumption (Figure 19). However, the most effective one varied according to the stages of interaction cycle. The most effective design for raising awareness of water status was an indexical design that showed only a part of the cistern (5.84 points). We compared the design pairs of low and high degrees of intervention in each attribute one by one.
There were significant differences between the designs with low and high degrees of interpretation. This revealed that interpreted information was more effective for inducing users’ immediate reactions than factual information. When they saw the price of the water, they more agreed to “it makes me aware of that water is a finite resource (5.16 points, p = 0.025)”, “I should save water (5.79 points, p = 0.020)” and “I will take an immediate action to reduce water consumption (5.74 points, p = 0.008)”. Accordingly, they agreed to “water consumption will be reduced (5.72 points, p = 0.001)” more when they received information about its price than its amount in liters.
However, a higher degree of intervention was less effective regarding the orientation attribute. The effect of intervention was decreased when users evaluated the remaining amount of water in the cistern (negative direction). Compared to the results of the designs in the neutral direction, users evaluated that they were not aware of their consumption (4.74 points, p < 0.001) and did not think that they should save water (4.74 points, p = 0.013) with the negative direction. Therefore, they less agreed to that they would take an immediate action (4.53 points, p = 0.028).
Indexical expression was revealed to be more effective than symbolic expression. When encountering the realistic design that showed part of a water tank, users were more likely to be aware that water is a finite resource (5.84 points, p = 0.001) and that they should save water (5.16 points, p = 0.048). Thus, they more agreed to that they would take an immediate action to reduce water consumption (4.88 points, p = 0.044).
On the other hand, the effect was decreased when the water tank was more exposed. The designers expected that it would be more effective for users to be more exposed to information, but the survey design case had the opposite result. Users answered that they would be less aware of their water consumption (4.40 points, p = 0.003) and were less conscious that water is a finite resource (5.47 points, p = 0.048) when they could see the whole water tank. As a reason of the least effective design, several participants stated that they would not think they had used much water because their consumption amount was only a small portion of such a large tank. Other users also pointed out the ineffectiveness of this design in that it does not raise users’ awareness when the water tank is full.
Effect of the Attributes of Physical Intervention
The scores of the design concepts of physical intervention were generally lower than the concepts of cognitive intervention (Figure 20). The button faucet, option faucet and wind-up faucet were not effective to induce users’ reactions, as most of their scores were below four. Blocked sink was the most effective among the concepts, but we found that it affected users in both physical and cognitive ways. Several participants answered that the reason of effectiveness of the blocked sink was that they could see the water that filled the sink. Thus, we excluded this concept in the analysis of physical intervention.
By comparing the pairs of design concepts, we found that a product that constrains functions was more effective at conserving water than a product without such constraints. Users evaluated that they would more be aware that water is a finite resource with a button faucet (3.66 points, p = 0.008), compared to an ordinary faucet. They expected to reduce their amount of water consumption (4.05 points, p < 0.001), although there was no significant difference in their understanding of water conservation. The users who believed that the button faucet was the most effective of the design cases stated that they “would wash faster because it is bothersome to push the button continuously” and “would finish washing in a short time because it is inconvenient to push the button many times.” They tended to believe that the button faucet forced them to save water rather than making them feel that they wanted to save it.
Regarding operational complexity, we also found that complex product were more effective. Compared to an ordinary faucet, users evaluated that they would more aware of their water consumption with the option faucet (3.50 points, p = 0.047). Accordingly, they agreed to that their water consumption would also be reduced (3.87 points, p = 0.005).
A large physical workload revealed to be more effective at conserving water than a product with a small workload. Users answered that they were more likely to take an immediate action with a wind-up faucet (4.16 points, p = 0.004) compared to the button faucet, as the wind-up faucet requires a more physical workload.
The suggested design attributes were shown to significantly influence users’ immediate reactions, such as awareness of their status and the context and willingness to perform water-saving behaviors. However, the attributes affect different stages of the interaction cycle, according to the attributes. Although we cannot generalize that a higher degree of intervention leads to greater effectiveness, we can confirm that these are critical elements that should be carefully and appropriately used in designs.
Discussion
The designer interviews, design workshop, and user survey helped us to identify the design attributes of product intervention and understand how the framework can be used for designing products that induce immediate sustainable behaviors. Based on the findings, we discuss ways to apply each attribute to design, effective utilization methods for cognitive and physical intervention, differences between these attributes and the results of prior studies, and the limitations of this study.
Implications for the Use of the Attributes for Sustainable Behavior
The survey results have implications that should be considered when applying several of the attributes to design. For example, regarding interpretation in cognitive intervention, determining the degree of interpreted value is a critical issue. Unlike informative facts, such as water amount in liters, the intrusiveness of monetary value differs according to price range. While most users thought that the water price information was effective in making them aware of water consumption, two users pointed out that they would waste water if the price were much lower than they expected. In addition, we can anticipate that users might not believe—and might therefore ignore—the price information if it is unrealistically expensive. Thus, it is important to interpret values to which users can easily conform. Interpreting water amount via the price of bottled water could be a more effective way to raise users’ awareness than referencing the cheaper price of public water supplies. The verification of the effects of such designs would be an interesting direction for future research.
In regard to the attributes of orientation and degree of exposure, products with higher degrees of intervention were shown to be less effective than our initial expectation. To the subjective questions, users answered that they were relieved when they saw how much water remained in the tank (negative orientation), which was the reason for its lesser effectiveness than presenting the usage amount (neutral orientation). This implies that it is important to consider the initial amount of a given resource when presenting the remaining amount. Regarding degree of exposure, although designers anticipated that users would save more water when they saw the whole tank, users said the opposite, stating that they would not necessarily save water because they could see that plenty of water remained. Thus, for increased effectiveness, the amount of a resource needs to be presented not as it is, but in a modularized amount that is appropriate to users’ activities. It is necessary to further examine this issue in terms of target product and usage context.
With respect to the attributes of physical intervention, we observed that a physical intervention can also affect users in a cognitive way. The blocked sink stimulus was intended as a physical intervention. However, users said that it was effective for water saving because they could see the water filling the sink. This cognitive intervention resulted from a physical intervention; thus, we could not analyze this case together with the other design stimuli in the survey. It is therefore necessary to carefully observe whether the design of one attribute affects other attributes. The attribute framework can be further elaborated by identifying the relationships among the attributes.
Designs for Cognitive and Physical Intervention
We observed the different characteristics of cognitive and physical intervention in terms of the interaction cycle, as they affected different stages of the interaction cycle. Users rated the evaluation and goal formation stages higher than the execution stage for cognitive intervention, while they rated the execution stage higher for physical intervention. This means that users are more aware of their water consumption and more cognizant that they need to conserve water with cognitive intervention designs, which tend to increase users’ willingness to take voluntary action. On the other hand, physical intervention leads users to take action immediately, but without much awareness of consumption or understanding of conservation. These differentiated characteristics may help determine the most effective type of intervention in a design context. For example, physical intervention might be effective in public toilets at highway rest areas, which draw masses of one-time users. It might be inconvenient but bearable to consume less water in such a context. However, in the context of toilets in an office building, which several users continuously visit but for which they are not financially responsible, cognitive intervention might be more effective, as it causes no inconvenience with regard to function but still causes users to consume less water.
In order to enhance the effect of an intervention, cognitive and physical methods may be applied together in a single product. This was confirmed through the results of both the interviews and the survey. W05 and E09 are representative examples (Figure 21). W05, an example of physical intervention, is designed to use only one liter of water in a glass cylinder; once that water is gone, users have to wait for another liter to fill up. Although waiting for water is intrusive to users, the interview participants said that they were willing to wait because they could see the water filling up through the glass cylinder. This works like a progress bar in a computer program, but is less boring because users can see physical progress. This means that a strong physical intervention can be lessened with cognitive treatment. In the case of E09, the product not only cognitively intervenes with users through the use of light, but also provides a handle with which to unplug a cord with minimal physical workload. The participants expected that this design would be more effective than E07, a power-aware cord (Figure 7), because less physical work is required to remove it from the wall outlet. In the survey, users also evaluated a blocked sink (Figure 18-h) as a much more effective design for inducing water conservation, as it intervenes both physically and cognitively. Thus, cognitive and physical interventions can be applied together for designing more effective product.
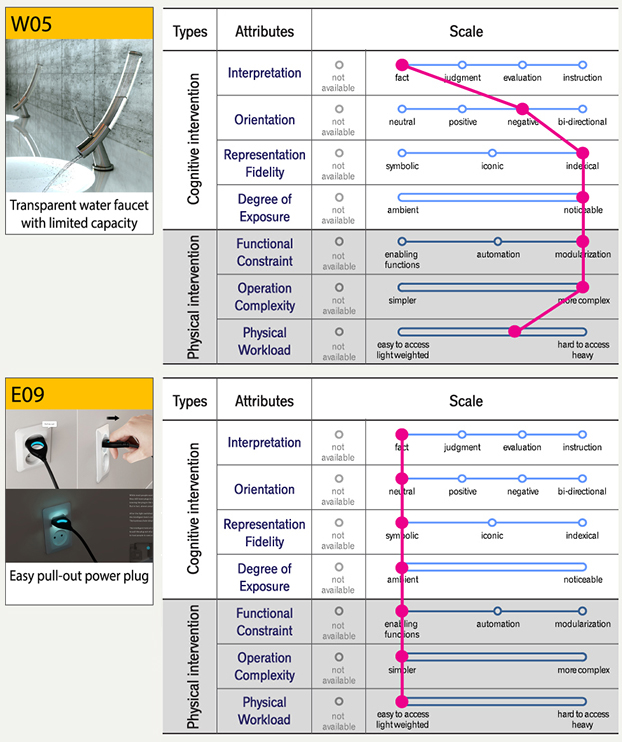
Figure 21. Examples of the most effective interventions. (Copyright: Yonggu Do, Dohyung Kim & Sewon Oh (W05), Seungwoo Kim (E09). Reprinted with permission.)
Comparisons to the Results of Prior Studies
The framework suggested in this paper includes a comprehensive set of attributes. While studies in the HCI field have focused on feedback and information systems as design outcomes—thereby mainly examining products’ cognitive aspects—the scope of this research includes holistic product design features. As a result, we newly identified the attributes of physical intervention, while the meanings of the cognitive intervention attributes were differentiated from those of existing studies in that ours cover a broader area. For example, representation fidelity has been suggested in several studies (Matthews et al., 2003; Pousman & Stasko, 2006), but we found this attribute relevant to graphical representation as well as physical movement and interaction. Degree of exposure in this study includes several dimensions from prior studies, such as transition, notification level, frequency, and duration.
At the same time, some attributes of existing studies were identified as less critical in this study, because we extracted most important factors that induced users’ immediate sustainable behaviors. Thus, several design attributes from prior studies were omitted. For example, information capacity, one of the design dimensions of ambient information systems (Pousman & Stasko, 2006), was revealed by our interview results to be less dominant than other attributes. When comparing the two cases with the largest difference in information capacity, the participants said that they did not expect more information to affect their behavior in reducing environmental impact (Figure 22). They did not feel that exposure to many kinds of information intervened more strongly because they were able to pay attention to only what they wanted to see.
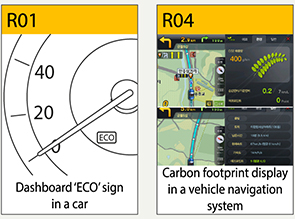
Figure 22. Cases with different information capacities. (Copyright: Peasant (R04). Reprinted with permission.)
Limitations
In the present study, we conducted interviews using concept images to identify the design attributes of product intervention. In the survey, users evaluated design stimuli by viewing images of concept ideas. As we conducted our study based on these images instead of real products, designers and users were unable to experience the interventions in a real context. This means that the results were based on participants’ perceived intervention instead of actual intervention. Thus, there could be some differences between the results of this study and actual user reactions. These differences might be more significant in physical intervention than in cognitive intervention. While cognitive intervention designs were composed of visual stimuli in which participants could at least partially experience a concept by seeing an image, they were unable to experience the tactile concepts of physical intervention. To address this problem, we asked the survey and interview participants to vividly imagine what it would be like to use the products. In the interviews, the designers were given the task of transforming the concepts into stronger or weaker intervening ideas in order to help them imagine more detailed interaction processes. In the survey, we provided descriptions of interaction processes with several scenes for each concept in order to help users think specifically about the usage context. Although an actual intervention is different from an imagined intervention, this can be an effective method with which to comprehensively analyze various cases. The framework and attributes can be more precisely verified in future research that involves real products or prototypes in an actual context.
Conclusion
This study was conducted in order to understand the design attributes of product interventions that can induce pro-environmental behavior during the use phase. We focused on designs that immediately induce user behavior in the context of product use. We identified the design attributes of product interventions and suggested a framework that includes these attributes and their associated scales. Through verifications of the framework and each attribute, we discovered that the framework can be utilized in the design process and that design outcomes using these attributes can affect user reactions.
This study makes three main contributions. The first is the identification of the design attributes of product intervention. We identified two types of intervention—cognitive and physical—and the seven attributes associated with them. We found interpretation, orientation, representation fidelity, and degree of exposure to be the attributes of cognitive intervention and functional constraint, operational complexity, and physical workload to be the attributes of physical intervention. We presented our framework in the form of a matrix containing the seven attributes and their design directions in order to help designers easily utilize it when developing design ideas. Secondly, we revealed that the attribute framework was helpful for determining design directions in the concept development stage and for facilitating effective communication among designers. It increased the number of generated concept ideas and allowed the seven attributes to be evenly applied. Lastly, we verified that the seven attributes are critical elements for designing product interventions through the evaluation of design cases, which significantly influenced users’ immediate awareness in water-use contexts. The design cases developed for the online survey and the users’ reactions can also be useful references for design processes, in tandem with the attribute framework.
We expect that the intervention framework can be used as a form of basic knowledge in the realm of design for sustainable behavior. Design cases and user studies from various academic fields can be classified and accumulated in this simple framework in terms of the seven design attributes. Designers can develop new design ideas by combining the scales of each design attribute for their particular context. If we provide sufficient numbers of design and research cases for each attribute scale, designers might be able to anticipate the effects of an intervention pattern. Future research may include empirical studies to observe actual changes in user behavior and environmental impact according to intervention pattern. In particular, it is necessary to verify which pattern is most influential according to users’ value, context, and usage period.
References
- Abrahamse, W., Steg, L., Vlek, C., & Rothengatter, T. (2005). A review of intervention studies aimed at household energy conservation. Journal of Environmental Psychology, 25(3), 273-291.
- Arroyo, E., Bonanni, L., & Selker, T. (2005). Waterbot: Exploring feedback and persuasive techniques at the sink. In Proceedings of the SIGCHI Conference on Human Factors in Computing Systems (pp. 631-639). New York, NY: ACM Press.
- Bhamra, T., Lilley, D., & Tang, T. (2011). Design for sustainable behaviour: Using products to change consumer behaviour. The Design Journal, 14(4), 427-445.
- Bovea, M., & Pérez-Belis, V. (2012). A taxonomy of ecodesign tools for integrating environmental requirements into the product design process. Journal of Cleaner Production, 20(1), 61-71.
- Charter, M., & Tischner, U. (2001). Sustainable solutions: Developing products and services for the future. Sheffield, UK: Greenleaf publishing.
- De Young, R. (1993). Changing behavior and making it stick. Environment and Behavior, 25(3), 485-505.
- Fang, W. -C., & Hsu, J. -Y. (2010). Design concerns of persuasive feedback system. In Proceedings of the 24th AAAI Conference on Artificial Intelligence (pp.20-25). Menlo Park, CA: AAAI Press.
- Fidler, M., Tan, S., Alqatari, S., Bhansali, N., Chang, A., Davis, M., …, & Cornelius, M. (2012). Sensor-based physical interactions as interventions for change in residential energy consumption. In Proceedings of the SIGCHI Conference on Human Factors in Computing Systems (pp. 2129-2134). New York, NY: ACM Press.
- Foster, D., Lawson, S., Wardman, J., Blythe, M., & Linehan, C. (2012). “Watts in it for me?”: Design implications for implementing effective energy interventions in organisations. In Proceedings of the SIGCHI Conference on Human Factors in Computing Systems (pp. 2357-2366). New York, NY: ACM Press.
- Froehlich, J., Findlater, L., & Landay, J. (2010). The design of eco-feedback technology. In Proceedings of the SIGCHI Conference on Human Factors in Computing Systems (pp. 1999-2008), New York, NY: ACM Press.
- Froehlich, J., Findlater, L., Ostergren, M., Ramanathan, S., Peterson, J., Wragg, I., …, & Landay, J. A. (2012). The design and evaluation of prototype eco-feedback displays for fixture-level water usage data. In Proceedings of the SIGCHI Conference on Human Factors in Computing Systems (pp. 2367-2376). New York, NY: ACM Press.
- Froehlich, J. E. (2011). Sensing and feedback of everyday activities to promote environmental behaviors. (Doctoral dissertation). University of Washington, Seattle, WA.
- Gustafsson, A., & Gyllenswärd, M. (2005). The power-aware cord: Energy awareness through ambient information display. In Proceedings of the SIGCHI Extended Abstracts on Human Factors in Computing System (pp. 1423-1426). New York, NY: ACM Press..
- Hanington, B., & Martin B. (2012). Universal methods of design: 100 ways to research complex problems, develop innovative ideas, and design effective solutions. Minneapolis, MN: Rockport.
- Holstius, D., Kembel, J., Hurst, A., Wan, P., & Forlizzi, J. (2004). Infotropism: Living and robotic plants as interactive displays. In Proceedings of the 5th Conference on Designing Interactive Systems: Processes, Practices, Methods, and Techniques (pp. 215-221). New York, NY: ACM Press.
- Jelsma, J., & Knot, M. (2002). Designing environmentally efficient services: A ‘script’ approach. The Journal of Sustainable Product Design, 2(3), 119-130.
- Kim, J. -W., Kim, Y. -K., & Nam, T. -J. (2009). The ténéré: Design for supporting energy conservation behaviors. In Proceedings of the SIGCHI Conference on Human Factors in Computing System (pp. 2643-2646). New York, NY: ACM Press.
- Kuznetsov, S., & Paulos, E. (2010). UpStream: Motivating water conservation with low-cost water flow sensing and persuasive displays. In Proceedings of the SIGCHI Conference on Human Factors in Computing System (pp. 1851-1860). New York, NY: ACM Press.
- Laschke, M., Hassenzahl, M., Diefenbach, S., & Tippkamper, M. (2011). With a little help from a friend: A shower calendar to save water. In Proceedings of the SIGCHI Conference on Human Factors in Computing Systems (pp. 633-646). New York, NY: ACM Press.
- Lidman, K., & Renström, S. (2011). How to design for sustainable behaviour? A review of design strategies and an empirical study of four product concepts. (Master’s thesis). Chalmers University of Technology, Gothenburg, Sweden.
- Lilley, D. (2009). Design for sustainable behaviour: Strategies and perceptions. Design Studies, 30(6), 704-720.
- Lockton, D., Harrison, D., & Stanton, N. A. (2010a). Design with intent: 101 patterns for influencing behaviour through design. Berkshire, UK: Equifine Windsor.
- Lockton, D., Harrison, D., & Stanton, N. A. (2010b). The design with intent method: A design tool for influencing user behaviour. Applied Ergonomics, 41(3), 382-392.
- Lockton, D. (2013). Design with intent: A design pattern toolkit for environmental and social behaviour change. (Doctoral dissertation). Brunel University, London, UK.
- Lofthouse, V. (2006). Ecodesign tools for designers: Defining the requirements. Journal of Cleaner Production, 14(15), 1386-1395.
- Matthews, T., Rattenbury, T., Carter, S., Dey, A. K., & Mankoff, J. (2003). A peripheral display toolkit (Tech. Rep. No. IRB TR-03-018). Intel Research Berkeley.
- Muller, M. J., & Kogan, S. (2010). Grounded theory method in hci and cscw. Cambridge, MA: IBM Center for Social Software.
- Mullet, K., & Sano, D. (1995). Designing visual interfaces. Upper Saddle River, NJ: Prentice-Hall.
- Norman, D. A. (1988). The psychology of everyday things. New York, NY: Basic books.
- Norman, D. A. (2002). The design of everyday things. New York, NY: Basic books.
- Nuffield Council on Bioethics. (2007). Public health: Ethical issues. Retrieved November 17, 2014, from http://nuffieldbioethics.org/wp-content/uploads/2014/07/Public-health-ethical-issues.pdf
- Petersen, D., Steele, J., & Wilkerson, J. (2009). WattBot: A residential electricity monitoring and feedback system. Proceeding of the SIGCHI Extended Abstracts on Human Factors in Computing Systems (pp. 2847-2852). New York, NY: ACM Press.
- Pierce, J., Fan, C., Lomas, D., Marcu, G., & Paulos, E. (2010). Some consideration on the (in) effectiveness of residential energy feedback systems. In Proceedings of the 8th ACM Conference on Designing Interactive System (pp. 244-247). New York, NY: ACM Press.
- Pousman, Z., & Stasko, J. (2006). A taxonomy of ambient information systems: Four patterns of design. In Proceedings of the Working Conference on Advanced Visual Interfaces (pp. 67-74). New York, NY: ACM Press.
- Rodriguez, E., & Boks, C. (2005). How design of products affects user behaviour and vice versa: The environmental implications. In Proceedings of the International Symposium on Environmentally Conscious Design and Inverse Manufacturing (pp. 54-61). Piscataway, NJ: IEEE.
- Sauer, J., Wiese, B. S., & Ruttinger, B. (2004). Ecological performance of electrical consumer products: The influence of automation and information-based measures. Applied Ergonomics, 35(1), 37-47.
- Sohn, M., Nam, T., & Lee, W. (2009). Designing with unconscious human behaviors for eco-friendly interaction. In Proceedings of the SIGCHI Extended Abstracts on Human Factors in Computing Systems (pp. 2651-2654). New York, NY: ACM Press.
- Steg, L., & Vlek, C. (2009). Encouraging pro-environmental behaviour: An integrative review and research agenda. Journal of Environmental Psychology, 29(3), 309-317.
- Thieme, A., Comber, R., Miebach, J., Weeden, J., Kraemer, N., Lawson, S., & Olivier, P. (2012). “We’ve bin watching you”: Designing for reflection and social persuasion to promote sustainable lifestyles. In Proceedings of the SIGCHI Conference on Human Factors in Computing Systems (pp. 2337-2346). New York, NY: ACM Press.
- Tromp, N., Hekkert, P., & Verbeek, P.-P. (2011). Design for socially responsible behavior: A classification of influence based on intended user experience. Design Issues, 27(3), 3-19.
- Wever, R., van Kuijk, J., & Boks, C. (2008). User-centred design for sustainable behaviour. International Journal of Sustainable Engineering, 1(1), 9-20.
- Wimmer, W., Ostad-Ahmad-Ghorabi, H., Pamminger, R., & Huber, M. (2008). Product innovation through ecodesign. International Journal of Sustainable Design, 1(1), 75-92.
- Zachrisson, J., & Boks, C. (2012). Exploring behavioural psychology to support design for sustainable behaviour research. Journal of Design Research, 10(1), 50-66.
- Zachrisson, J., Storrø, G., & Boks, C. (2012). Using a guide to select design strategies for behaviour change: Theory vs. practice. In M. Matsumoto, Y. Umeda, K. Masui, S. Fukushige (Eds.), Proceeding of the 7th International Symposium on Environmentally Conscious Design and Inverse Manufacturing (pp. 362-367). Heidelberg, Germany: Springer.
Appendix
Here we explain all the concepts used in this study.