
Using Social Distinctions in Taste for Analysing Design Styles across Product Categories
Dirk Snelders 1,2,*, Ruth Mugge 3, and Maartje Huinink 4
1 Eindhoven University of Technology, Eindhoven, The Netherlands
2 Aalto University, Helsinki, Finland
3 Delft University of Technology, Delft, The Netherlands
4 Scope Design & Strategy, Amersfoort, The Netherlands
People can develop a taste for particular styles of design across a wide range of product categories. The literature has suggested that people’s preferences for such ‘cross-category’ design styles are influenced by social distinctions, based on education level and age bracket. In this article, we have argued more precisely that such social distinctions are indispensable as criteria for an analysis of cross-category design styles. In a quantitative study with over 400 people and 200 products in 10 product categories, we have demonstrated how design preferences across product categories are related to people’s education level and age bracket. We then qualitatively analysed people’s design preferences across product categories, and we arrived at seven cross-category design styles. Five of these styles could be identified only on the basis of the differences in design preferences between groups of a different age and education level, as established in previous studies. Taken together, this article has provided an approach for designers to analyse cross-category design styles, based on the inclusion of social distinction indicators (education level and age bracket) that help identify critical differences in people’s tastes.
Keywords – Aesthetics, Demographic Variables, Evaluation, Lifestyle, Product Design.
Relevance to Design Practice – This research uncovers seven cross-category design styles and demonstrates how people’s preferences for these design styles are based on social distinctions. Knowledge of these cross-category design styles and the research approach might assist designers when faced with the challenge of how to address different market segments, and how to play with stylistic conventions.
Citation: Snelders, D., Mugge, R., & Huinink, M. (2014). Using social distinctions in taste for analyzing design styles across product categories. International Journal of Design, 8(3), 23-34.
Received March 6, 2013; Accepted November 3, 2013; Published December 31, 2014.
Copyright: © 2014 Snelders, Mugge, & Huinink. Copyright for this article is retained by the authors, with first publication rights granted to the International Journal of Design. All journal content, except where otherwise noted, is licensed under a Creative Commons Attribution-NonCommercial-NoDerivs 2.5 License. By virtue of their appearance in this open-access journal, articles are free to use, with proper attribution, in educational and other non-commercial settings.
*Corresponding Author: h.m.j.j.snelders@tudelft.nl.
At the time of writing this article, Dirk Snelders was associate professor at the Department of Industrial Design at Eindhoven University of Technology, and visiting professor at the International Design Business Management (IDBM) program at the School of Business at Aalto University in Helsinki. Currently, he is professor of Product and Service Development at the Faculty of Industrial Design Engineering, Delft University of Technology. Dirk has a background in psychology and marketing, and it is from these fields that he has developed his current research interest on the role of design in business. He has published on aesthetics, the importance of novelty and surprise in design, cross-cultural design, and service design. His work has appeared in journals such as the British Journal of Psychology, Design Issues, Design Studies, and the Journal of Product Innovation Management.
Ruth Mugge is associate professor in Consumer Research at the Faculty of Industrial Design Engineering, Delft University of Technology. After having studied why consumers become emotionally attached to their products, her research currently focuses on the influence of product appearance in evoking symbolic and functional impressions. Her work has appeared in journals such as Applied Ergonomics, the British Journal of Psychology, CoDesign, the Design Journal, Design Studies, the International Journal of Design, and the Journal of Engineering Design.
Maartje Huinink is consumer insight manager in the Consumer & Market Insights Department at the Dutch telecom company UPC Netherlands. Previously, she worked as a strategic and user centered designer at the design agency Scope Design & Strategy. At this agency she also performed a research project ‘there is accounting for taste’ to finalize her MSc. degree at the Faculty of Industrial Design Engineering at Delft University of Technology. The results of this project make up an important part of the empirical studies reported in this article.
Introduction
The application of style in design, as well as the practice of styling, is heavily related to the commercial role of design and to efforts of companies to visually position their products in the market (Moulson & Sproles, 2000; Person, Snelders, Karjalainen, & Schoormans, 2007; Pugliese & Cagan, 2002; Warell, 2001). Recently, Person and Snelders (2010) argued that design styles can be defined by the particular way designers respond to the functional and expressive challenges they are faced with. A design style is then descriptive of a way of designing that people (direct stakeholders, potential users, and a general public) can recognize based on a number of noticeable features in the design of products.
This view on style implies that people can make style attributions based on features in a design that point to a particular designer, user community, brand, period, design school, or even a nation’s industry (respectively, see Chan, 2000; Kawamura, 2006; Karjalainen, 2004; Cleveland, 2010; Betts, 2004; Razzaghi, Ramirez, & Zehner, 2009). However, many people lack knowledge about the source of these design features and the potential reasons for their existence. For example, not many people know that the use of black (vs. chrome) trim lines on cars had an original function in rally racing to limit the refraction of light that might blind the driver. In addition, the popularity of certain design features can lead to spill-over effects into other product categories. In the case of black trim lines, this spill-over occurred from rally cars to all cars, but also to fashion, furniture, and electronic products. Because of this, style reception can be relatively untied to particular–functional–product categories. Thus, people can relate a design from category X (e.g., car) and a design from category Y (e.g., chair) to the same design style, as long as they notice similar features in them, such as a black trim line. In addition, people may prefer styles based on black trim lines across many different product categories, without knowing (or caring) about its original application in rally cars.
Here, we have explored such cross-category design styles, and have focused on the question of how to find evidence for them in people’s aesthetic preferences for product design (in the remainder of this article more briefly described as ‘design preferences’). Given the above introduction, we have assumed that style attribution is based on perceived shapes, silhouettes, materials, textures, and colours that reoccur across product categories, as well as on inferences about the potential sources and implications of the style. According to Steffen (2002) and Vihma (1995), the combined design features making up a style can be regarded as ‘symbol complexes’ that carry meaning for people in a variety of ways: (a) iconically, in terms of what the features resemble, (b) indexically, in terms of what people infer as cause or effect for the features, and/or (c) symbolically, in terms of what people infer from these features by convention. It is for these reasons that our definition of cross-category styles includes both perceptual as inferential bases for style attribution, and that inference-based styles can point both to potential sources and implications of design features.
The effort to derive cross-category design styles from design preferences can be informed by literature that looks to a general evolutionary basis for aesthetic preferences (e.g., Bar & Neta, 2006; Berlyne, 1971; Hekkert & Leder, 2008). However, an alternative basis for style analysis can be the insight that many aesthetic preferences are a matter of taste, on which people seek to differ and express themselves. Taste has been defined by Bourdieu (1979/1984) as the “faculty of immediately and intuitively judging aesthetic values” (p. 99), and a “systematic expression of a … distinctive lifestyle” (p. 175). Taste can thus be seen as a way for people to signal and enforce social distinctions that cannot be accounted for by evolutionary factors. In this article, we have focused on people’s design preferences across product categories as indicators of people’s broader taste and lifestyle, and we have used social distinctions in these preferences as a basis for analysing cross-category design styles.
Some authors have argued that preferences for cross-category styles in art and design are influenced by the social stratification of society, determined by factors such as people’s age and education level (e.g., Bourdieu, 1979/1984; Holt, 1998; Vyncke, 2002). However, there has been little attention in the literature to the analysis of the art or design styles themselves. Studies have either used pre-defined style categories that were taken as given, or they identified design styles on the basis of quick pilot studies on how people perceive product designs. Both approaches depart from the idea that design styles are objectively ‘out there,’ in that their identification is independent of the people providing design preferences and their social background. In this article, we have argued that such a disinterested view of style is problematic, and we have taken the position that cross-category design styles should be identified on the basis of social distinctions in people’s design preferences.
In addition, this research contributes to earlier literature on design styles and shape grammars (Person et al. 2007; Chan, 2000; McCormack, Cagan, & Vogel, 2004) by exploring how design styles can transcend product categories. Part of this exploration is the development of an approach for analysing design styles across product categories based on social distinctions in design preferences. This approach may also be of assistance to designers in practice to develop methods for analysing cross-category design styles. Such methods could differ depending on the purpose of the particular practice, like designing products for a brand that ranges over multiple product categories, making collages, or making a visual analysis of design trends.
The remainder of this article is structured as follows. First, we discuss the literature in which the relation between social distinctions and design preferences was explored. Next, two studies are reported. The first is a large-scale quantitative study in which we relate the design preferences of over 400 people for 200 visual product designs distributed over ten different product categories to social distinctions based on people’s age and education level. Based on these results, we present a qualitative study where we identify seven cross-category design styles that are preferred by one or more social stratification groups. Finally, we discuss the relevance of these findings for design practice.
Social Distinctions in People’s Taste for Design
Grant McCracken (1990) cited an early example of someone’s taste for a cross-category design style. He reported how Diderot, the French 18th century writer-philosopher, wrote how he was brought to ruin by the purchase of a new gown, because it had led to his subsequent purchases of a matching chair and table, matching prints, and a host of other matching products. In architecture, art, business, and design, such a pervasive preference for particular styles across product categories has been seen as part of people’s broader development of their tastes and lifestyles. With respect to this, it should be noted that the literature has related the concept of lifestyle more to preferences for styles in art than to preferences for styles in design. However, as was argued by Bell (1976), and, according to Betts (2004) also at Ulm by Max Bense as early as the 1950s, people’s lifestyles have increasingly been expressed by their consumption of industrial goods rather than art.
An insight from architecture and design is that lifestyles depend on an intuitive feel for the appropriateness of artefacts, given people’s ambitions in life (Scruton, 1979). For art and a host of cultural products, it was argued similarly that people’s lifestyles are based on slowly acquired, practical knowledge and skills that determine a person’s status in society (Bourdieu, 1979/1984). By stressing the importance of lifestyle as an expression of people’s status and level of ambition, both authors identified a relation between someone’s lifestyle and the way society is stratified. Bourdieu focused on people’s taste as an important expression of lifestyle, and in several studies he showed how people’s taste (in his case aesthetic preferences across works of art and music) are related to their education level. As a guiding principle for this relation, Bourdieu posited the notion of distinction: Aesthetic preferences are higher for objects associated with social groups that people adhere to, and they are lower for objects associated with social groups that people are averse to. In this way, aesthetic preferences signal and enforce a particular adherence (and by implication aversion) to particular social groups.
There has also been an interest in lifestyles as a basis for market segmentation. In business, the lifestyle concept was introduced to show that there were some general tendencies in people’s consumption, which could be indicated by particular combinations of activities, personality indicators, and attitudinal preferences. This literature argued that lifestyle variables would provide a more powerful and communicable basis for defining market segments than socio-demographic factors, like age, gender, and education level (Cosmas, 1982; Plummer, 1974; Wells, 1975). However, in a review of the many lifestyle studies in the business literature, Wedel and Kamakura (2000) concluded that socio-demographic and lifestyle variables may both serve as bases for a general segmentation of a market, even if these variables should be regarded as too generic for being used to segment consumer markets for products within a single product category.
Although the literature on lifestyles is vast, there have only been a few studies where cross-category design preferences were explicitly included as an aspect of people’s lifestyles. This is not surprising when considering that lifestyle studies in the arts and business have generally assumed that aesthetic preferences were arbitrary and could be identified more or less independently from the social stratification that they were thought to denote (Bourdieu, 1979/1984, who used predefined style categories in some of his studies, can be seen as a good example of this position).
There are three studies that we are aware of that have looked into cross-category design preferences, and in some respects we can see the lack of interest in design styles reflected in them. First, in a qualitative study that focused on consumption goods, Holt (1998) confirmed the main tenet of Bourdieu’s work, in that people with high and low levels of education show distinctive tastes for certain designs across product categories. However, Holt refrained from a visual analysis of the styles of these designs. Instead, he described the preferred design styles of people with lower education levels by the terms these people used themselves, such as ‘practical,’ ‘comfortable,’ and ‘functional.’ For people with higher education levels, he discussed how design preferences are based on visual appeal, but in highly personalized and diversified ways. Holt’s findings echo adaptations of Bourdieu’s work to account for aesthetic preferences for art in postmodernity (DiMaggio & Mukhtar, 2004; Peterson, 1992), where it was argued that tastes of higher educated people had become more fragmented.
Second, in a quantitative study across a range of product categories (furniture, indoor plants, and bedroom interiors), Lanseng (2002) showed to some extent that people prefer the design of products across categories according to predefined styles (‘classic,’ ‘modern,’ and ‘country’). Thus, a preference for a modern looking couch made it more likely that someone would also like a modern looking plant or bedroom. In an additional study across different furniture categories (tables, beds, sofa’s, and easy chairs), Lanseng also replicated Bourdieu’s earlier findings for art: People with higher education levels preferred modern style products across furniture categories, while those with lower education levels preferred country style products.
Third, Vyncke (2002) looked at the role of design preferences in lifestyle-based market segmentation. In a pilot study, product-specific styles were identified for four classes of highly conspicuous products (clothing, cars, houses, and house interiors) by asking people to group products within each product category into different classes. In a main study, Vyncke then reported that preferences for these design styles were related to a number of more established lifestyle variables (values, life visions, and media preferences) and a number of socio-demographic variables (age, gender, and education level). Note that, here, style classifications were based on product clusters that were found separately within each product category. Such classifications can also be made on the basis of other than stylistic subdivisions within each product category (e.g., according to price range). Possibly as a result, in Vyncke’s study preferences for design styles were found to add little to the explanatory power of the broader lifestyle concept.
The above studies provide some evidence for the organization of preferences according to cross-category design styles, and for the relation of these preferences to lifestyle and socio-demographic variables. At the same time, by adopting methods earlier explored in studies on preferences for art, the choice has been either to refrain from a style analysis (Holt, 1998), to simply presuppose certain style categories (Lanseng, 2002), or to do a quick style analysis in a pilot study before investigating social distinctions in preferences for design styles (Vyncke, 2002). Moreover, these studies assumed that the design styles themselves could be easily identified, independent of the social distinctions that they denote. However, as we argue below, cross-category style attributions are likely to be made with particular social interests in mind. As a result, the identification of such styles cannot be achieved independent of the social distinctions that such styles denote.
Our argument starts with the work of Lahire (1998, 2003) on the consumption of cultural goods, where it is stressed that people’s aesthetic preferences can easily shift across different settings. In a large-scale study on a wide array of cultural goods (books, music, film, etc.), Lahire (2008) reported that the aesthetic preferences of most people express an affiliation to a group of a certain social status and ambition. However, Lahire also showed that most people dissociate from their group members in important and meaningful ways, creating a lot of instability in people’s aesthetic preferences and behaviours. Unlike the small-scale study of Holt (1998), Lahire showed that such ‘heterogeneity of preferences’ exists across all social strata, including lower educated people. People send out mixed signals, and as an explanation Lahire (2008) stated that “observable variations [in consumption patterns of cultural goods] can essentially be explained by the plurality of contexts in which the individuals concerned have been socialised in the past” (p.185).
Based on the work of Lahire, we feel it is plausible that people make use of different selections of products to signal different interests and ambitions in life. However, we argue that within each context, the design preferences for a selective group of products must still be clearly indicative of social distinctions. Ritterfeld (2002) coined such products ‘social prototypes,’ by which she meant products that have acquired a sufficiently established and recognizable meaning, easily decodable by relevant others. Thus, when people send out mixed, but meaningful signals (e.g., highly educated at work and young in the club at night), they can achieve this by favouring and disliking specific product designs that have a clear, ‘authentic’ reference to a particular social distinction. Under such circumstances, these designs would not merely signal a social distinction, but may even enforce it, ‘reminding’ people of (one facet of) who they are, or can become.
The above discussion of design preferences implies that an analysis of cross-category design styles depends on selected sets of products, each of which clearly signalling a particular social distinction. For these sets of products, a style analysis can be based on particular design features that resemble each other, or that lead to similar inferences (about a source or about potential social implications). However, such features only become identifiable once we know which products they can be found in, and this depends on how well products express certain social distinctions. It follows that we can no longer assume what prior studies have done, that cross-category design styles are ‘out there,’ and can be identified independent of their social-cultural implications. On the contrary, cross-category design styles should best be uncovered when focusing on particular sets of products that have been selected by people as signs of social distinction. We thus propose (a) that social distinctions will unveil coherent design preferences across different product categories, and (b) that these social distinctions enable a rich analysis of cross-category design styles. These two propositions are put to the test in two studies.
Quantitative Study on People’s Design Preferences
Method
Respondents
This research aimed at investigating whether social stratification influences people’s design preference of product designs. We contacted 375 members of a consumer panel in The Netherlands, and 290 (77%) responded. To arrive at a better representation of highly educated older people and younger people with a low education level, we approached additional people who were (mostly) in these groups to participate. This search led to another 168 respondents, resulting in a total of 458 respondents (Mage = 41.6, SD = 14.9; 49% males).
Stimuli
We selected a comprehensive set of 200 products from the following 10 product categories: car, cd-player, paperclip, coffee maker, perfume bottle, electric shaver, living room chair, sugar bowl, weighing scale, and alarm clock. These product categories were chosen because they differ greatly in price, importance of appearance versus function, degree of technology included, public versus private consumption, size, and level of detail in the product design. It was expected that respondents had regularly encountered and/or used these product categories, which would enable them to provide fast, intuitive judgements about the aesthetic value of the designs.
An expert in Industrial Design Engineering (BSc degree) conducted extensive Internet searches to collect a wide range of products that were available in the market during the time the study took place. From this set, the expert purposely selected 20 different products presented on a white background for each of the 10 product categories. This selection was made in such a way that a large diversity of shapes, silhouettes, materials, textures, and colours of the different designs within the category was covered. Because the use of a white background in product presentations can function as a signal of high product quality and modern values (Pracejus, Olsen, & O’Guinn, 2006), we actively sought to include designs that did not necessarily appear as being of high quality and/or modern. In addition, the pictures were presented in a web-questionnaire that had a white background itself, which made it look like the design stood in the background of the questionnaire.
The pictures of these products were standardized with respect to resolution (72 dpi), standard screen size (max. height = 13.5 cm), and orientation. To minimize possible brand recognition effects, small brand names and logos on the products were blurred, and large brand names that were an integral part of the design (as on some perfume bottles) were changed into meaningless words made out of the same letters as the originals.
Procedure and Measures
In an online questionnaire, respondents rated their design preference of all 200 products using a single item that is a conventional standard in product aesthetics research: A seven point scale anchored from ‘very unattractive design’ (1) to ‘very attractive design’ (7). Respondents were asked to only pay attention to the visual design. In the questionnaire, the products were presented per product category. To familiarize respondents with the range of design variation in each product category, respondents were first shown five product examples before rating the 20 products belonging to that same product category. These five examples were different products from the 20 products used for the ratings, but their pictures were selected and adapted at the same time and in exactly the same way. These examples thus helped respondents to get an initial feel for the variety of the stimulus set for this product category.
To prevent order effects, six different versions of the questionnaire were created. These versions differed in the order in which the product categories and the different products within the categories were presented to the respondents.
Finally, respondents were asked to fill in their age, gender, and education level. Level of education was divided into seven levels, ranging from ‘secondary school or lower’ (1) to ‘a Master degree or higher’ (7).
Results
Creating Social Stratification Groups
We categorized the respondents according to age, education, and gender. For age, we created three different age generations according to a classification of Schulze (1994), who himself recognized four generations: the quiet generation (1930-1940), the protest generation (1940-1955), the lost generation (1955-1970), and the pragmatic generation (1970-1988). People belonging to the quiet generation are now over 70 years old, and were few in number in our sample. Accordingly, we divided our respondents into the following three age groups: ≤ 1955; > 1955 and ≤ 1970; and > 1970.
Based on their education, we categorized the respondents into two levels. With the protest generation, higher education became more democratized in The Netherlands, resulting in a radical revision of societal relations (Becker, 1992). Accordingly, Schulze (1994) only distinguished two education levels for these and later generations, and we also divided our respondents into two education levels. Respondents who had a Bachelor’s degree or higher were categorized as having a high education level, whereas respondents with a degree lower than a Bachelor’s degree were categorized as having a low education level.
We carried out one-way Analyses of Variance to compare the different social stratification groups (based on age, education level, and gender) on their design preference scores. Among the three variables we looked at, age and education level turned out to be the most predictive of differences in design preferences between groups. This confirms earlier work in art (Bourdieu, 1974/1984; Schulze, 1994) and design (Vyncke, 2002) that social distinctions based on age and education level are important antecedents of design preferences for products. We thus continued by comparing six social stratification groups, based on three age levels and two education levels. Together, this resulted in six social stratification groups ranging from young to old: (1) lower educated pragmatics, (2) higher educated pragmatics, (3) lower educated losts, (4) higher educated losts, (5) lower educated protests, and (6) higher educated protests. The number of respondents in each of these six social stratification groups was between 45 and 125, thus all groups had a sufficient number of respondents for the analyses.
Comparing Social Stratification Groups on Their Use of the Design Preference Scale
To reliably determine whether social stratification affects people’s design preferences, it is important to verify whether the six social stratification groups have treated the seven-point design preference scale in a similar way. For that reason, the overall means on design preference were compared between the groups. No significant differences were found (M1 = 3.48; M2 = 3.48; M3 = 3.55; M4 = 3.40; M5 = 3.51; M6 = 3.49; Mgrand = 3.48; F(5, 452) = 0.72, p > .60). Second, Levene’s test of homogeneity of variances was performed to examine whether the six social stratification groups had equal variances with respect to design preference or whether certain groups were more expressive in their scores than others. Again, no significant differences were found (SD1 = .44; SD2 = .47; SD3 = .45; SD4 = .53; SD5 = .62; SD6 = .58; SDgrand = .51; Levene’s statistic = 2.09, p > .05). Together, these findings suggest that all social stratification groups have used the seven-point design preference scale in a similar way. Consequently, if we find differences between the groups on particular products then these are not are caused by a general group effect.
Comparing Social Stratification Groups on Design Preference
The results showed that for 129 of the 200 products the design preference score differed significantly between the six social stratification groups (p < .05). Based on chance, significant effects could be expected for one product per category (and 10 out of the 200 products). In our study, significant differences were found for 12 cars, 11 cd-players, 11 coffee makers, 14 paper clips, 11 perfume bottles, 13 shavers, 17 chairs, 9 sugar bowls, 15 weighing scales, and 16 alarm clocks (129 out of 200 the products). Thus, social stratification influenced design preference across all product categories included in our study.
Because the research objective was to uncover cross-category design styles and to explore how people’s preferences for these styles are socially stratified, we combined the individual design preference ratings per social stratification group. For each group, the 16 or 17 products with the highest design preference scores were selected. The mean preference scores for these products ranged from 4.60 to 5.71, confirming that the different social stratification groups preferred these product designs. Next, these products with highly preferred designs were included in a poster, providing an overview of the design preferences for each of the six groups. To uncover which design features should be avoided to create design preference for a specific social stratification group, we also created a poster with the 16 least preferred product designs per group. The means on the design preference scale of these products ranged from 1.37 to 2.49, confirming that all these product designs were indeed not preferred (i.e., considered unattractive) by the different groups.
We created two additional posters based on Bourdieu’s (1979/1984) notion of distinction, which described how people’s aesthetic preferences were guided by a distinctive (positive) adherence and (negative) aversion to social stratification groups. First, a distinctive adherence poster was created per social stratification group using the following criteria: For each product (1) the design preference mean score was positive (higher or equal to 4.00), (2) the mean score for this social stratification group significantly differed from at least one other group, (3) at least three other groups had a mean score lower than 4.00, and (4) the difference with the general mean score of the product was greater than 0.3 points. By combining these criteria, it was possible to create a poster for distinctive adherence that visualizes the distinctive positive preferences per social stratification group, while ensuring a sufficient number of product designs on the poster. This poster resulted in a total of 3 to 16 products per group. Second, a distinctive aversion poster was created using the following criteria: (1) The design preference mean score was negative (lower or equal to 3.00), (2) the mean score for this social stratification group significantly differed from at least one other group, (3) at least three other groups had a mean score higher than 3.00, and (4) the difference with the general mean score of the product was greater than 0.3 points. 5 to 13 products per group were included in this poster. All four posters were used as input for the qualitative study. Both the distinctive adherence and aversion posters demonstrated that important differences in design preference existed between the six social stratification groups.
Discussion
The findings of the quantitative study demonstrated that social stratification strongly influences people’s design preference of product designs. For the majority of products from ten highly diverse product categories, significant differences were found between the six social stratification groups. For a subsequent analysis of the different cross-category design styles, it is important to understand how the six social stratification groups differ in their design preference, and which product designs across the ten product categories are preferred by a specific group of people. To provide such an overview, we will qualitatively analyse, for each social stratification group, the four posters that showed each group’s positive design preferences, negative design preferences, distinctive adherence, and distinctive aversion.
In addition, it was anticipated that we would find some degree of consistency in design preferences between groups, based on prior research on general aesthetic rules (e.g., Bar & Neta, 2006; Berlyne, 1971; Hekkert & Leder, 2008). Thus, we searched the posters for positive and negative design preferences not only to find differences, but also commonalities between groups.
The four posters served as input for the qualitative study, which consisted of a series of workshops to interpret the posters, and consequently, to uncover cross-category design styles that clearly signal an affiliation to one or more of the six groups.
Qualitative Study to Uncover Cross-Category Design Styles
Method
Respondents and Procedure
Four workshops were organized with a total of 14 participants with considerable expertise in product design. The goals were to uncover cross-category design styles by analysing and interpreting the four posters from the quantitative study on positive and negative design preferences, and distinctive adherence and aversion. Participants worked as senior designers at design agencies (n = 11) and companies (n = 2) or were considered a scholarly expert in design (n = 1). Some participated in two workshops, so three to six design experts participated in each workshop.
We used design experts to analyse the posters, because they are thought to be better than people in general at recognizing detailed similarities and differences between the features of various product designs. For Bourdieu (1979/1984), the basis for the process of distinction “is not (or not necessarily) a distinct knowledge, … since it ensures recognition … of the object without implying knowledge of the distinctive features which define it” (p. 466, parentheses in the original). Accordingly, separating people’s preference scores from expert ratings of the design features is a well-established methodology for uncovering the rationale for people’s responses to design (e.g., Henderson & Cote, 1998; Henderson, Giese, & Cote, 2004; Orth & Malkewitz, 2008).
Analysing all four posters took up a lot of time, and for this reason we organized four workshops. Over the four workshops, we strived towards positive descriptions of cross-category design styles, which meant that we focused on features that were conspicuously present in the products belonging to a style. This meant that in the first workshop experts analysed the positive preference and distinctive adherence posters, and only in the later workshops did we also look at the negative preference and distinctive aversion posters. Over the workshops, experts checked that design features for a cross-category style would be (a) present in designs that were preferred by the same group, (b) absent in designs not preferred by the same group, (c) absent in the distinctive adherence of other groups, and (d) present in the distinctive aversions of other groups.
The first workshop was conducted with five design experts. The workshop started with a presentation of the six social stratification groups and the results of the statistical analysis of the quantitative study. During this workshop, the positive preference and the distinctive adherence posters were analysed and interpreted. We first gave all participants an A3 print of the positive preference poster. In an individual assignment, participants then searched for similar design features among products in different social stratification groups and marked the specific relations and differences between the groups. These findings were discussed with the other participants and summarized. This procedure was repeated for the distinctive adherence poster.
Three design experts participated in the second workshop, which was intended as a check of the results of the first workshop against the findings from the negative preference poster. Similar to the first workshop, the workshop started with a presentation of the six social stratification groups, and the results of the quantitative study. Next, the experts individually searched the positive and negative preference posters, and the distinctive adherence poster for the presence and absence of similar design features. After this they discussed their findings in a group session. Finally, results from the first workshop were presented, discussed, and joined with findings of this workshop.
The third workshop was conducted with six design experts and served to reflect on the trustworthiness of our conclusions from the previous workshops. The workshop started with a presentation of the six social stratification groups and the results of the quantitative study. As in the first workshop, the procedure of individual group analysis, group discussion, and conclusion was executed for the positive preference and the distinctive adherence posters. Subsequently, the findings of the previous workshops were presented, discussed, and joined with findings of this workshop.
The last workshop was conducted with the same five design experts as in the first workshop. Where these experts had previously only looked at the positive preference and distinctive adherence poster, they now analysed the negative preference and distinctive aversion posters in the same way as in the first workshop. The goal of this approach was to review the cross-category design styles identified in previous workshops and analyse them from a negative perspective (checking whether design features of a style were absent in designs not preferred by the same group, and present in the distinctive aversions of other groups). This analysis made it possible to uncover which social stratification groups are opposed to specific cross-category design styles.
All in-between results of the workshops were analysed by the researchers in order to develop (preliminary) cross-category design styles. First, this entailed a reformulation of the given descriptions of the design features in the workshop. Participants sometimes described the visual design of the products on different levels of abstractions (e.g., by using different terminology to describe a similar visual design or by using the same terminology for both an overall gestalt and details of the product design). To make the descriptions comparable to each other, all results were grouped into descriptions of visual design that fit in the framework of elements of order (Muller, 2001). Following this framework, product designs were analysed based on their orientation, internal arrangement, proportion, plasticity, colour, and material. Second, the results of the workshop were checked with the quantitative data. For example, if products were denoted in the workshop as positively preferred by certain designated social stratification groups because of specific design features, it was checked (a) whether these products were indeed more preferred by these social stratification groups than by other groups, and (b) whether the products in our stimulus set that had similar design features but that were not included in one of the posters were also more positively preferred by these same groups. This analysis resulted in the formation of the final cross-category design styles, to be discussed next. As a result of the iterative process with critical design experts, a strong basis for the trustworthiness of the results was obtained.
Results
The analysis of the results of the four workshops led to the development of seven cross-category design styles in total: Five distinctive design styles that were preferred by some of the social stratification groups but not by others, and two common design styles that were generally preferred by all groups. As far as possible, we clarified what the product designs belonging to each of the seven cross-category design styles looked like based on the framework of elements of order (Muller, 2001), and which social stratification groups had a preference for these styles. An overview of the preferred cross-category design styles per social stratification group is given in Table 1. To further illustrate each cross-category design style, product examples for the identified styles are shown in Table 2.
Table 1. Overview of the preferred cross-category design styles per social stratification group.
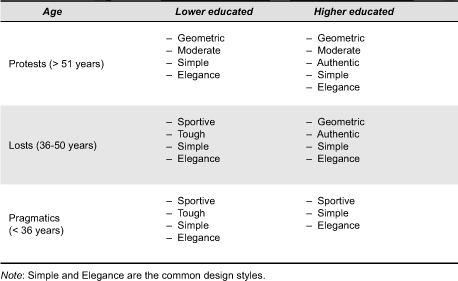
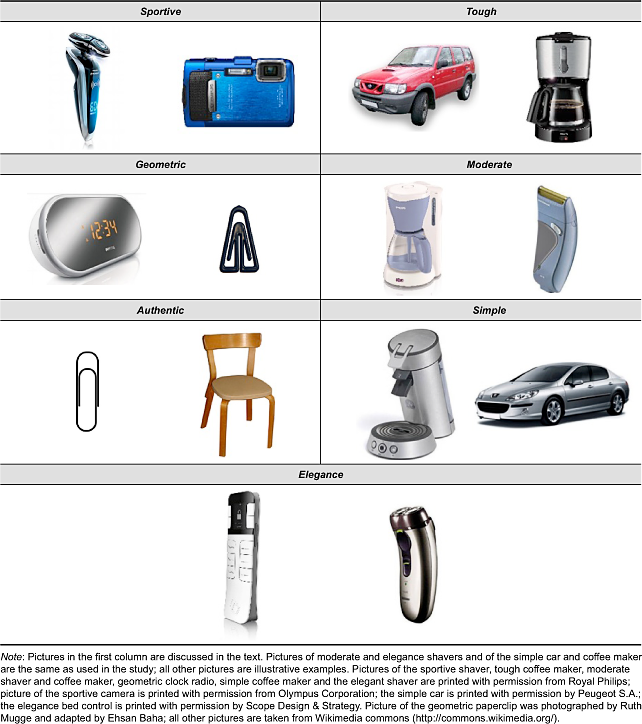
Table 2. Illustration of the identified cross-category design styles.
Before we present a detailed description of the seven cross-category design styles, we would like to stress that these cross-category design styles are not necessarily independent from each other, and we cannot guarantee exclusive membership of each design to a single style. The reason for this is that the identification of design features for a certain cross-category style is based on whether they co-occur in product designs that are equally (and distinctively) preferred by the same social stratification groups. Such co-occurrences can happen more or less often, thus the attribution of a style to a particular product design, based on shared features, is a matter of degree. Not all features need be present in all designs belonging to a style, and, to some extent, product designs might be examples for more than one style.
Distinctive Design Styles
Five distinctive design styles resulted from the workshops. The first distinctive design style was ‘Sportive’ and suggested that the product design represented speed and agility. The design style ‘Sportive’ consisted of product designs with an upward, elevated orientation. Furthermore, the internal arrangement of the designs could be summarized as an assembled look that is a mixture of different forms and shapes, due to the specific use of colour and material. With respect to plasticity, ‘Sportive’ suggested that the product designs had relatively complex forms and surfaces. More specifically, the surfaces tended to be rounded, continuous and with short lines. Highly expressive colours were applied in the designs. Table 2 visualizes a shaver and camera that belong to this design style. The shaver was a good example to illustrate the distinctive design style ‘Sportive.’ It consists of a mixture of various surfaces that differ in colour and texture. The handgrip has an organic feel to it as a result of the curved lines. Finally, the shaver head has a complex shape, and it is made up of various short lines. Product designs following the design style ‘Sportive’ were primarily preferred by the younger groups of pragmatics and the lower educated losts. We believe these social stratification groups prefer ‘Sportive’ product designs because these designs are associated with speed and agility that underline a certain youthfulness.
The second distinctive design style was ‘Tough,’ which implied that the product designs represented power and muscles. The orientation of this design style was primarily central. With respect to the internal arrangement, ‘Tough’ consisted of product designs that had complex and assembled forms, due to the use of colour and material. Furthermore, the product designs often made use of oversized details. The proportion could be summarized as massive, big, and solid. With respect to plasticity, the product designs generally incorporated many lines and complex surfaces. Finally, the product designs were often colourful. For example, the car that visualizes the design style ‘Tough’ in Table 2 has a massive-looking overall shape with a central orientation. The placement of mirrors, the bumpers, and grill gives it a complex and assembled look. These product parts are also relatively big, resulting in an oversized feel. The design style ‘Tough’ was primarily preferred by the lower educated pragmatics and the lower educated losts. The rationale for the finding that these social stratification groups prefer ‘Tough’ product designs may lie in the strong body culture of these groups, and the fact that, even today, many of the better paid jobs for lower educated people in the workforce require physical strength.
‘Geometric’ was the third distinctive cross-category design style. The internal arrangement of the product designs belonging to the design style ‘Geometric’ was symmetric, ordered, and harmonious. With respect to plasticity, the product designs often had geometric shapes. For example, the alarm clock that visualizes the design style ‘Geometric’ in Table 2 has a distinct, oval shape, is entirely symmetric, with a central display of time and brand name. These features give it a highly ordered look. The older protest generation and the higher educated losts had the highest preferences for product designs that could be classified as ‘Geometric.’ Our rationale for the fact that these social stratification groups preferred ‘Geometric’ product designs was that they raised positive feelings for a more ordered, high modern world, possibly experienced at a younger age.
The fourth distinctive design style was ‘Moderate,’ which implied that the product design was integrated and looking rather generic. Product designs belonging to the design style ‘Moderate’ had an internal arrangement that was harmonious, balanced, and leaning towards the symmetrical, but never strictly so. The proportion could be summarized as low in inherent contrast. As regards plasticity, ‘Moderate’ consisted of product designs with surfaces that were rounded, continuous and that demonstrated only very few elements of tension. Furthermore, the product designs often consisted of integrated forms and made use of smooth transitions. For example, the coffee maker that visualizes the design style ‘Moderate’ in Table 2 consists of various parts, but these are assembled into one coherent shape with very mild transitions. Product designs following the design style ‘Moderate’ were generally preferred by the older protest generation. Our rationale for the finding that these social stratification groups preferred ‘Moderate’ product designs lies in the fact that these product designs are rather conventional and adhere to accepted beliefs. While growing older, people generally may have stopped changing their design preferences, and their tastes may reflect fashions that younger generations know about, but do not adhere to anymore.
The fifth and last distinctive design style was ‘Authenthic.’ Unlike the previous styles, this style was not so much tied to shared design features, but on a shared inference about the products belonging to this style. Accordingly, this design style cannot be summarized by using Muller’s (2001) framework of elements of order. Rather, ‘Authentic’ implied that the product design referred to a historic, original source, and had been created within that particular context. Consequently, the product design could be seen as an expression of ‘good’ taste, and having a preference for such product designs demonstrated an appreciation for design icons and originality. For example, the Gem paper clip from the early 1870s in Table 2 is nowadays considered a classic, based on the fact that it is among the oldest and most practical models for paper clips, setting the world standard from the very beginning. The higher educated protests and higher educated losts had the most positive preferences towards product designs that could be classified as ‘Authentic.’ We believe that the education level of these social stratification groups allowed them to pick up on the meaning of these ‘Authentic’ product designs. Correspondingly, lower educated people may have had difficulty to relate to these designs, and they typically had low preference scores for the designs of these products.
Common Design Styles
Common cross-category design styles describe the features of visual product design that are preferred by all social stratification groups. Two such styles resulted from the workshops. First, the design style ‘Simple’ consisted of product designs with an internal arrangement that was symmetrical, ordered, and harmonious. Furthermore, ‘Simple’ suggested that the design had a balanced proportion. With respect to plasticity, the product designs had a geometric outline and simple-shaped surfaces. There was little contrast in colour, and the colour palette existed of one or two toned down colours, such as grey and black. Pure and cold materials were the most used, such as metal and glass. For example, the coffee maker that visualizes the design style ‘Simple’ in Table 2 combines two circular shapes with just three controls on each shape. This gives it a well-integrated, simple look.
The second common design style was ‘Elegance.’ Product designs that were perceived as belonging to this style had a vertical orientation and long sloping lines. The proportion could be summarized as slight, refined, and sophisticated. In terms of plasticity, ‘Elegance’ suggested that the product design made use of light organic shapes, few elements of tension, and curved, continuous surfaces. Colours were permitted in the product design, but the colours were mostly warm, and low in saturation. For example, the bed control that visualizes the design style ‘Elegance’ in Table 2 has a very tall and light shape, subtly accentuated by its rounded wedged shape at the base and black translucent material on top. Together this gives it an elegant appearance.
The common design style ‘Simple’ corresponds to prior research that has demonstrated a general preference towards objects and designs that are symmetric, unified, and have low complexity (e.g., Berlyne, 1971; Hekkert & Leder, 2008; Veryzer & Hutchinson 1998). The design style ‘Elegance’ corresponds to prior research that has demonstrated a generic preference for organic and curved product designs (Bar & Neta, 2006; Silvia & Barona, 2009). Both have argued their case from an evolutionary perspective, with simple forms leading to ease of classification, and elegant (soft) shapes being more approachable, and therefore preferred more positively.
General Discussion
Previous research has demonstrated the presence of relationships between socio-demographic variables and design preferences for style categories that were unspecified (Holt, 1998), pre-specified (Lanseng, 2002), or derived from independent observations from a general public (Vyncke, 2002). By doing so, these studies did not form a sufficient basis for analysing cross-category design styles. The present research has shown that social distinctions can explain people’s design preferences, and can serve as a basis for analysing cross-category design styles. When considering what a sociological analysis of cross-category design styles contributes to the existing evolutionary approaches, we note that five of the seven identified cross-category design styles could only be identified on the basis of social distinctions in age and education level. Thus, social distinctions in taste enable a much richer analysis of cross-category design styles.
Furthermore, past studies on design styles have assumed that styles can be uncovered from analysing wide ranges of products. However, for cross-category design styles this assumption is untenable; including all products in an analysis may negatively affect the chances of identifying such styles because many products may not be of interest to people for signalling a particular social distinction. In our research, the majority of our effort was spent on a pre-selection of products for which the social stratification groups differed in their design preference. We analysed those products for finding distinctive cross-category design styles. Our findings demonstrate that this selection procedure helped to identify products that can be regarded as social prototypes that clearly signal a particular social affiliation. In those cases, people become aware of and attach importance to design features that are found in some products, and not in others. Without this selection procedure, the five distinctive cross-category design styles we uncovered could not have been found.
In more pragmatic terms, what stands out in our approach is that we used variables of social distinction to come to a selection of designs across product categories that can be further analysed for commonalities in style. How exactly our approach could translate into design practice will depend on the particular field of application. As Chow and Jonas (2010) pointed out, in cases where the problem field and goals of the designer have been clearly defined, analyses such as the one presented in this paper can be used to create requirements for new design. In such cases of incremental (often user-driven) design innovations, information about cross-category design styles could help designers to style new products, based on comparable examples from other product categories. This could be the case when an established company seeks to upgrade or downgrade its products to appeal to market segments that might have different tastes. Another example could be when a well-defined brand seeks to extend its product range to new product categories, while targeting its current market segments.
However, Chow and Jonas also argued that an important part of design practice is not about addressing well-defined problems, but instead to reveal the potential of evolving user-technology relations. In those cases, analyses of cross-category design styles serve another purpose for designers, namely to serve as an archival knowledge base from which they can depart when designing highly novel products. For cross-category design styles, this is possible even when the artefacts are from different product categories than those that were previously analysed. Here, a designer could use analyses of existing cross-category design styles as inspiration for creating new designs. Playing with conventions that are recognized by people of different social backgrounds can encourage designers to look beyond existing styles. For example, designers could use previous analyses of cross-category design styles to make collages of visuals of the past, contrasting and blending distinct traditions in design as an inspiration for creating something new.
Limitations and Future Research
To keep our qualitative research feasible, we limited our investigation of the effects of social distinctions on people’s design preferences to age and education level. We focused on these socio-demographic variables because they had the largest impact on people’s design preferences in our study. Additionally, prior research has demonstrated that these variables are strongly related to people’s preferences of design (e.g., Bourdieu, 1979/1984; Schulze, 1994; Vyncke, 2002). However, we acknowledge that other socio-demographic variables and cultural factors may also have an important impact on people’s design preferences, and future research should examine their impact. Among these, gender may be the most interesting to study further. This variable had a smaller impact than age and education level in our study, but this could be related to the fact that The Netherlands, where the study took place, is among the countries in the world where gender differences are the least pronounced (see Hofstede, 2001). In countries where gender differences are more pronounced this variable may well have a stronger influence on design preferences and analyses of cross-category styles.
Our study is based on an analysis of a large set of visual product designs, presented to respondents in isolation against the white space of the web-questionnaire. The isolated presentation format allowed for an analysis of cross-category styles on the basis of shared design features that are inherent to the product (or in the case of the design style ‘Authentic,’ of shared inferences about the design features). In this sense we have contributed to the literature on design styles and shape grammars (Chan, 2000; McCormack, Cagan, & Vogel, 2004; Person et al., 2007) by showing how feature based design styles can transcend product categories, and by pointing to a social basis for cross-category styles. At the same time, this approach may be limited in that it cannot show how cross-category design styles are related to the broader lifestyles of people. It is likely that for some practices in design (trend analysis, for instance) it might be better to analyse design styles as they appear to people within particular contexts. For those purposes, it might be interesting to carry out similar analyses as we have done here, but then based on more contextualised visuals of product designs.
Related to the above point is the wider issue of the generalizability of our style analysis to other times and places. In this article, we assumed that the design preferences of people from different social stratification groups are part of a wider context, where people develop broad cultural tastes and lifestyles in a local, historical context. As such, the identified design styles are likely to connect to wider (life)styles that can be found throughout a local culture, and that can include fashion, literature, cinema, leisure services, the internet, etcetera. It follows that an analysis of cross-category design styles is likely to lead to different conclusions in other countries and/or other periods. Thus, what this article contributes for design scholars from other parts of the world is perhaps not necessarily our style analysis per se, but our employed theories and research approach to make such analyses fruitful for design.
Acknowledgments
The authors thank Hanneke Vons-van Kessel (Epiphany RBC) for her help in collecting the data, Pim Jonkman (Scope Design & Strategy) for his support and helpful suggestions on this research, Hanne Caspersen (Philips Design) and Oscar Person (Aalto University) for their comments on a previous version of this paper, and Ehsan Baha for his help on the visuals in Table 2. This research was supported by grant number 11129 of the Netherlands Organization of Scientific Research (NWO) awarded to Ruth Mugge.
References
- Bar, M., & Neta, M. (2006). Humans prefer curved visual objects. Psychological Science, 17(8), 645-648.
- Becker, H. (1992). Generaties en hun kansen. Amsterdam, the Netherlands: Meulenhoff.
- Bell, D. (1976). The cultural contradictions of capitalism. New York, NY: Basic.
- Berlyne, D. E. (1971). Aesthetics and psychobiology. New York, NY: Appleton-Century-Crofts.
- Betts, P. (2004). The authority of everyday objects: A cultural history of West German industrial design. Berkely, CA: University of California Press.
- Bourdieu, P. (1984). Distinction: A social critique of the judgment of taste (R. Pryce, Trans.). Cambridge, MA: Harvard University Press. (Original work published 1979)
- Chan, C. -S. (2000). Can style be measured? Design Studies, 21(3), 277-291.
- Chow, R., & Jonas, W. (2010). Case transfer: A design approach by artifacts and projection. Design Issues, 26(4), 9-19.
- Cleveland, P. (2010). Style based automated graphic layouts. Design Studies, 31(1), 3-25.
- Cosmas, S. C. (1982). Life styles and consumption patterns. Journal of Consumer Research, 8(4), 453-455.
- DiMaggio, P., & Mukhtar, T. (2004). Arts participation as cultural capital in the United States, 1982-2002: Signs of decline? Poetics, 32(2), 169-194.
- Hekkert, P., & Leder, H. (2008). Product aesthetics. In H. N. J. Schifferstein & P. Hekkert (Eds.), Product experience (pp. 259-285). Amsterdam, the Netherlands: Elsevier.
- Henderson, P. W., & Cote, J. A. (1998). Guidelines for selecting or modifying logos. Journal of Marketing, 62(2), 14-30.
- Henderson, P. W., Giese, J. L., & Cote, J. A. (2004). Impression management using typeface design. Journal of Marketing, 68(October), 60-72.
- Hofstede, G. (2001). Culture’s consequences: Comparing values, behaviors, institutions and organizations across nations. Thousand Oaks, CA: Sage.
- Holt, D. B. (1998). Does cultural capital structure American consumption? Journal of Consumer Research, 25(1), 1-25.
- Karjalainen, T. -M. (2004). Semantic transformation in design: Communicating strategic brand identity through product design references. (Doctoral dissertation). University of Art and Design Helsinki, Helsinki, Finland.
- Kawamura, Y. (2006). Japanese teens as producers of street fashion. Current Sociology, 54(5), 784-801.
- Lahire, B. (1998). L’homme pluriel. Les resorts de l’action. Paris, France: Nathan.
- Lahire, B. (2003). From the habitus to an individual heritage of dispositions, towards a sociology at the level of the individual. Poetics, 31(5-6), 329-355.
- Lahire, B. (2008). The individual and the mixing of genres: Cultural dissonance and self-distinction. Poetics, 36(2-3), 166-188.
- Lanseng, E. (2002). Taste consistency: An empirical study of consistency in aesthetic preference across product categories. (Doctoral dissertation). Agricultural University of Norway, Ås, Norway.
- McCormack, J. P., Cagan, J., & Vogel, C. M. (2004). Speaking the Buick language: Capturing, understanding, and exploring brand identity with shape grammars. Design Studies, 25(1), 1-29.
- McCracken, G. D. (1990). Culture and consumption: New approaches to the symbolic character of consumer goods and activities. Bloomington, IN: Indiana University Press.
- Moulson, T., & Sproles, G. (2000). Styling strategies. Business Horizons, 43(5), 45-52.
- Muller, W. (2001). Order and meaning in design. Utrecht, the Netherlands: LEMMA Publishers.
- Orth, U. R., & Malkewitz, K. (2008). Holistic packaging design and consumer brand impressions. Journal of Marketing, 72(May), 64-81.
- Person, O., Snelders, D., Karjalainen, T. -M., & Schoormans, J. (2007). Complementing intuition: Insights on styling as a strategic tool. Journal of Marketing Management, 23(9-10), 901-916.
- Person, O., & Snelders, D. (2010). Brand styles in commercial design. Design Issues, 26(1), 82-94.
- Peterson, R. A. (1992). Understanding audience segmentation: From elite and mass to omnivore and univore. Poetics, 21(4), 243-258.
- Plummer, J. T. (1974). The concept and application of life style segmentation. Journal of Marketing, 38(1), 33-37.
- Pracejus, J. W. G., Olsen, D., & O’Guinn, T. C. (2006). How nothing became something: White space, rhetoric, history and meaning. Journal of Consumer Research, 33(1), 82-90.
- Pugliese, M. E., & Cagan, J. (2002). Capturing a rebel: Modelling the Harley-Davidson brand through a motorcycle shape grammar. Research in Engineering Design, 13(3), 139-156.
- Razzaghi, M., Ramirez, M., & Zehner, R. (2009). Cultural patterns in product design ideas: Comparisons between Australian and Iranian student concepts. Design Studies, 30(4), 438-461.
- Ritterfeld, U. (2002). Social heuristics in interior design preferences. Journal of Environmental Psychology, 22(4), 369-386.
- Schulze, G. (1994). Die Erlebnisgeselschaft: Kultursociologie der Gegenwart. Frankfurt, Germany: Campus Verlag.
- Scruton, R. (1979). The aesthetics of architecture. London, UK: Methuen.
- Silvia, P. J., & Barona, C. M. (2009). Do people prefer curved objects? Angularity, expertise, and aesthetic preference. Empirical Studies of the Arts, 27(1), 25-42.
- Steffen, D. (2002). Design als Produktsprache: Der “Offenbacher Ansatz” in Theorie und Praxis. Frankfurt, Germany: Verlag Form.
- Veryzer, R. W., & Hutchinson, J. W. (1998). The influence of unity and prototypicality on aesthetic response to new product designs. Journal of Consumer Research, 24(4), 374-394.
- Vihma, S. (1995) Products as representations: A semiotic and aesthetic study of design products. Helsinki, Finland: University of Art and Design Helsinki.
- Vyncke, P. (2002). Lifestyle segmentation. From attitudes, interests and opinions, to values, aesthetic styles, life visions and media preference. European Journal of Communication, 17(4), 445-463.
- Warell, A. (2001). Design syntactics: A functional approach to visual product form. (Doctoral dissertation). Chalmers University of Technology, Gothenburg, Sweden.
- Wedel, M., & Kamakura, W. A. (2000). Market segmentation: Conceptual and methodological foundations. Boston, MA: Kluwer Academic Publishers.
- Wells, W. D. (1975). Psychographics: A critical review. Journal of Marketing Research, 12(2), 196-213.
